ECONOMIC OVERVIEW
The total number of Oregonians employed in March reached 1.94 million, which was up substantially from 1.84 million in March 2015. The rapid rise in the number of employed is the main driver of an increase in Oregon’s labor force participation rate, which shot up to 62.3% in March from a recent low of 60.8% in March 2015.
Oregon’s unemployment rate dropped to a record low of 4.5% in March—the lowest point since comparable records began in 1976. Oregon’s February unemployment rate was 4.8%. A year ago, in March 2015, Oregon’s unemployment rate was 5.7%.
Rapid job growth in concert with historically low unemployment rates demonstrates to me that Oregon’s labor market is stronger than it has been in decades.
HOME SALES ACTIVITY
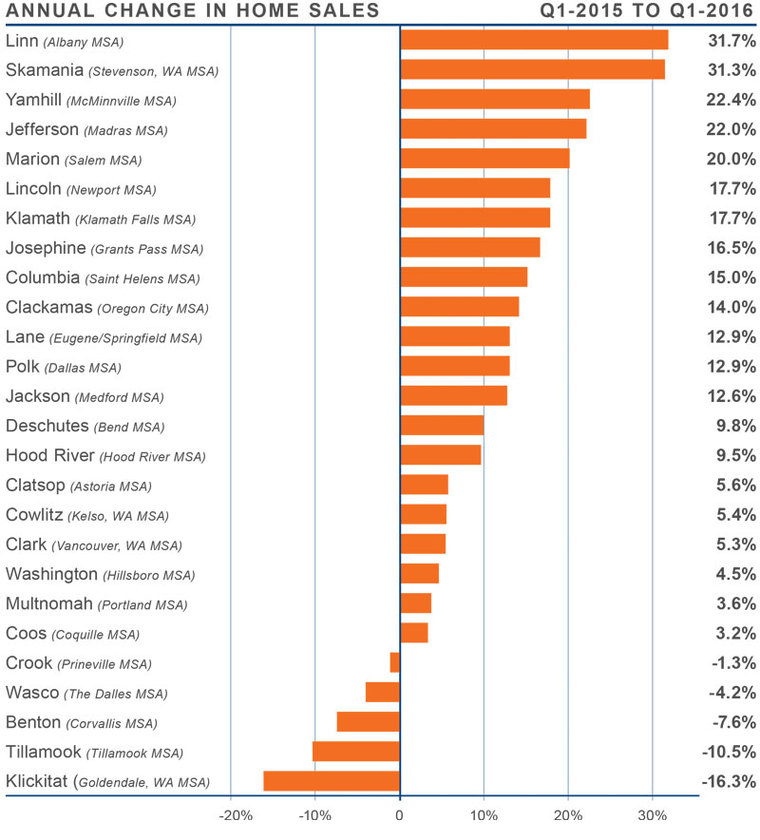
- Sales activity rose by 8.8% compared to the first quarter of 2015, with 13,094 home sales.
- Double-digit percentage increases in closed sales were again seen in a majority of the counties, but we did see some declines in five of the 26 counties that are contained in this report.
- Sales rose the fastest in smaller counties, with Linn, Skamania, Yamhill, Jefferson and Marion Counties leading the way.
- Decreases in sales activity also tend to be more prominent in smaller counties, which are prone to pronounced swings. At this point, I don’t believe any drop in sales is a function of declining demand.

HOME PRICES
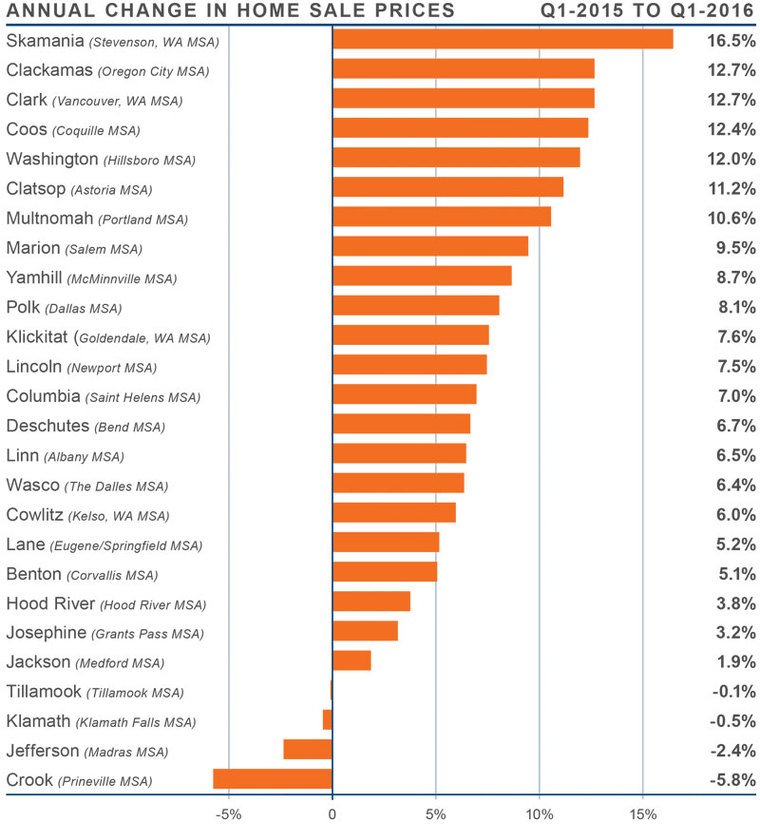
- Average prices in the region rose by 9.1% year-over-year to $315,746. The modest slowdown that was discussed in the last quarter’s report did not continue but has actually reversed course and started to increase at a faster pace than seen in recent quarters.
- All but four counties saw prices rise compared to the first quarter of 2015, with seven counties showing double-digit percentage gains.
- When compared to first quarter of 2015, Skamania County maintains its position as the market with the strongest price growth with home prices rising by 16.5%. This remains a function of the size of the market, which allows for substantial swings in price.
- Double-digit growth was seen in Clackamas, Clark, Coos, Washington, Clatsop and Multnomah Counties, demonstrating that markets close to urban centers, as well as smaller counties, can show fast price appreciation.

DAYS ON MARKET
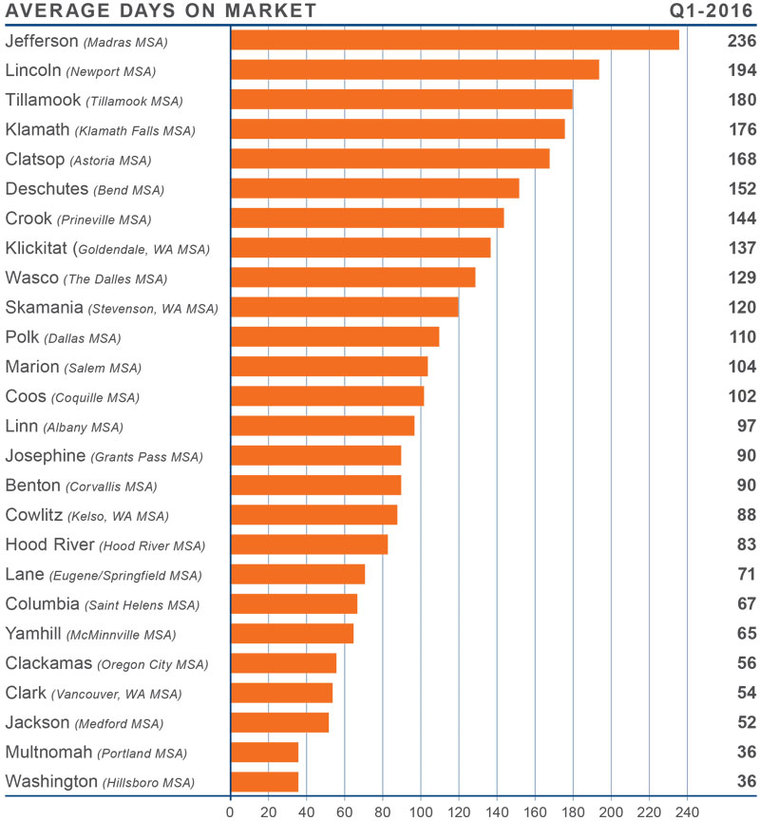
- The average number of days it takes to sell a home in the region dropped by 13 days when compared to the first quarter of 2015.
- The average time it took to sell a home in the region was 109 days.
- Jefferson and Skamania Counties were the only markets where the average time it takes to sell a home rose, but they are remarkably small areas, so the change does not concern me at this point.
- The fastest sales pace was seen in Washington and Multnomah Counties, which registered at a little over one month.

CONCLUSIONS
 The speedometer reflects the state of the region’s housing market using housing inventory, price gains, sales velocities, interest rates and larger economics factors. Growth in the Oregon economy is impressive and unlikely to slow down in the foreseeable future. This bodes well for the housing market.
Anticipated inventory growth in the spring has yet to emerge, but I am hopeful that we will see a modest uptick in listing activity as we move toward the summer months.
Interest rates will remain at very favorable levels which will continue to encourage buyers who, unfortunately, will still have to be very patient during the home buying process. As such, I have moved the needle just a little more in favor of sellers.
 Matthew Gardner is the Chief Economist for Windermere Real Estate, specializing in residential market analysis, commercial/industrial market analysis, financial analysis, and land use and regional economics. He is the former Principal of Gardner Economics, and has over 25 years of professional experience both in the U.S. and U.K.
 Facebook
 X
X
 Pinterest
 Copy Link


