ECONOMIC OVERVIEW
 After losing over 134,000 jobs during the Great Recession, the Las Vegas metropolitan area has recovered all of those jobs and employment is now at an all-time high of 934,600. Year-over-year, the market added 24,600 new jobs. This is up from the annual pace of 21,300 jobs seen at the end of last year, but below the average annual rate of 32,700 seen through the whole of 2015. However, with an annual growth rate of 2.7% I see no reason to complain.
The local unemployment rate rose from 5.6% to 6.0% between February and March of this year, but this data set is not seasonally adjusted. (Seasonal adjustments remove the influences of predictable seasonal patterns to show how unemployment changes from month to month.) As such, I am not too concerned and would note that the current rate is still down substantially from the 7.2% unemployment rate that was in place a year ago.
HOME SALES ACTIVITY
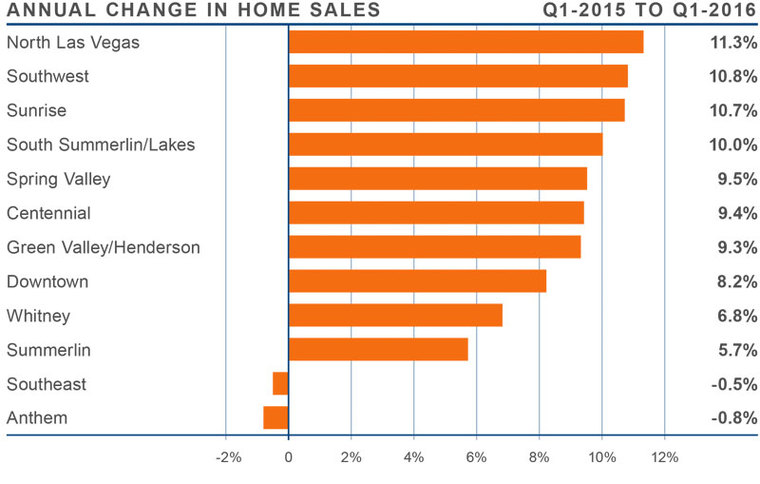
- Sales activity in the area rose by an impressive 7.7% when compared to the first quarter of 2015, with 7,248 home sales.
- The fastest rate of growth in sales came in the North Las Vegas sub-market which rose by 11.3% to 757 home sales.
- Pending sales rose across all areas, with the Sunrise sub-market showing the greatest growth when compared to the first quarter of 2015 (22.6%). This was followed by Downtown (+21.4%). Total pending sales were up by 12.9%.
- Inventory remains tight with half of the sub-markets seeing modest increases in listings compared to a year ago, and half showing a decline. In total, listings are down year-over-year by 3.3%. The greatest increase in listings was seen in the South Summerlin/Lakes sub-market (+6.6%).

HOME PRICES
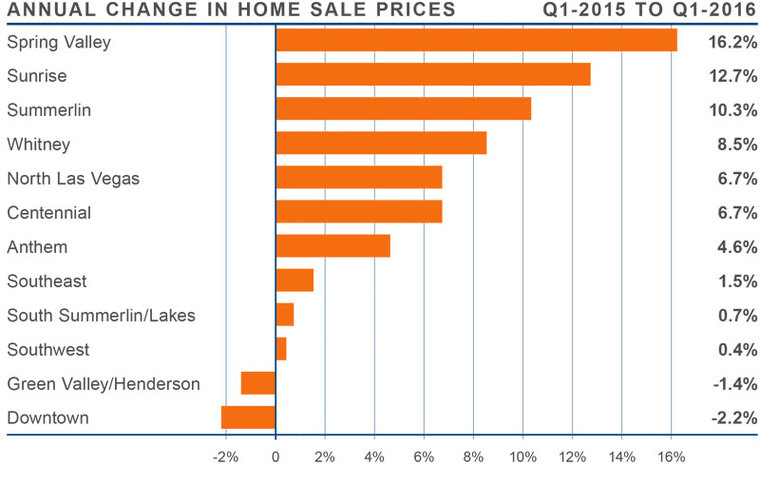
- Average prices in the region rose by 4.4% year-over-year to $232,045.
- All but two counties saw prices rise compared to the first quarter of 2015, and three sub-markets registered double-digit percentage gains.
- Spring Valley saw the strongest annual growth with home prices rising by 16.2%.
- Prices fell in the Downtown and the Green Valley/Henderson sub-markets but the declines were minimal.

DAYS ON MARKET
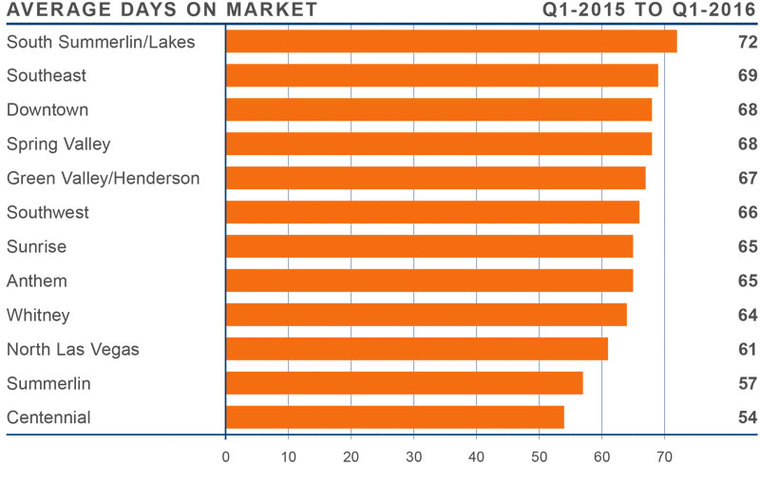
- The average days it takes to sell a home in the region dropped by six days when compared to the first quarter of 2015.
- The average time it took to sell a home in the region was 63 days.
- The South Summerlin/Lakes sub-market was the only market where the number of days on market increased (+3).
- The greatest drop in days-on-market was seen in the Southeast and Summerlin markets which both dropped by 16 days.

CONCLUSIONS
 The speedometer reflects the state of the region’s housing market using housing inventory, price gains, sales velocities, interest rates and larger economics factors. The Southern Nevada economy continues to expand and I do not see this changing in the foreseeable future. There has been some modest improvement in inventory levels across the region, but many areas are still well below historic averages, causing the market to remain in favor of sellers. While prices have not yet reached their historic peak, they’re showing strong gains, thanks in part to the continued decline of distressed home sales.
 Matthew Gardner is the Chief Economist for Windermere Real Estate, specializing in residential market analysis, commercial/industrial market analysis, financial analysis, and land use and regional economics. He is the former Principal of Gardner Economics, and has over 25 years of professional experience both in the U.S. and U.K.
 Facebook
 X
X
 Pinterest
 Copy Link


