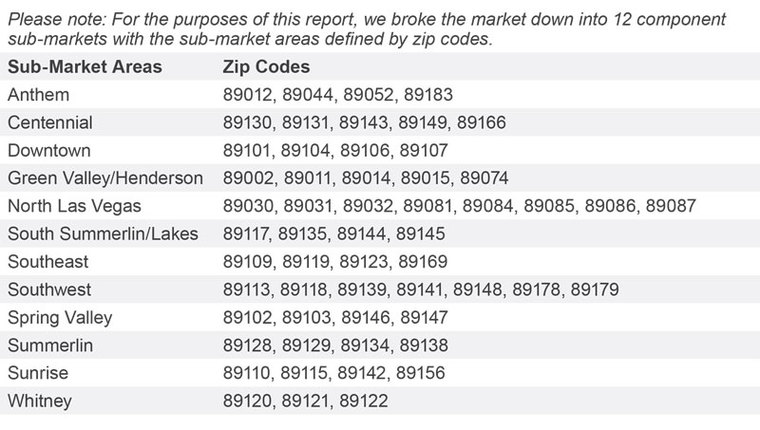
ECONOMIC OVERVIEW
Job recovery in the Las Vegas metropolitan area took a bit of a pause during second quarter. May employment was down by 200 jobs from the prior month, but still 21,300 higher than seen a year ago. This matches the annual pace of 21,300 jobs seen at the end of last year, but is below the average annual rate of 32,700 for the whole of 2015. It is too early to suggest that this “slowdown” will be ongoing, but I will be keeping a close eye on the numbers through
the summer months.
The local unemployment rate rose from 6.1% to 6.4% between April and May, but it’s important to keep in mind that this data is not seasonally adjusted. (Seasonal adjustments remove the influences of predictable seasonal patterns to show how unemployment changes from month to month.) The employment rate has been fluctuating quite frenetically over the past
few months, but I believe that Las Vegas is still trending in the right direction, especially considering that there were substantial additions to the workforce during the spring.
HOME SALES ACTIVITY
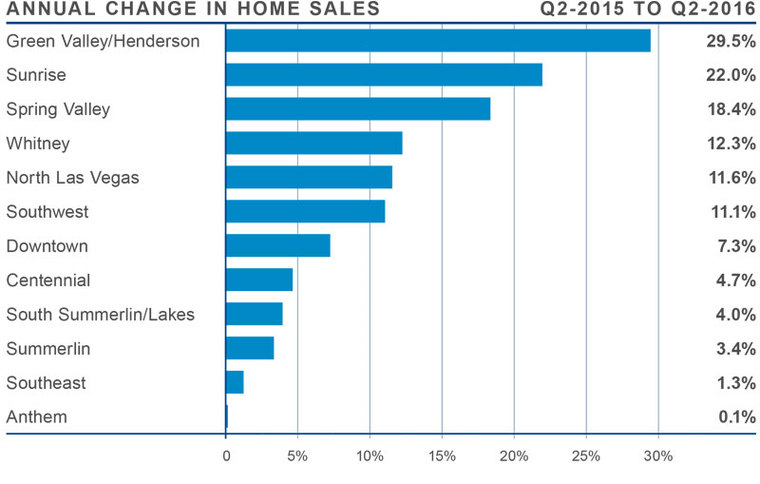
■ There were 9,717 home sales last quarter, which is an annual increase of 9.7%.
■ Sub-markets where sales activity was slow were limited to the Southeast and Anthem areas, but the declines were very modest.
■ The fastest rate of growth in sales came in the Green Valley/Henderson sub-market, which saw home sales rise by 29.5% over the past year.
■ Inventory levels remain a major issue with the number of homes for sale 3.9% lower than a year ago, and 9.4% lower than in the first quarter of the year. There were four areas where the number of homes for sale increased, led by the Southwest sub-market which saw listings increase by 7%.

HOME PRICES
■ Average prices in the region rose by 3.8% year-over-year to $230,500.
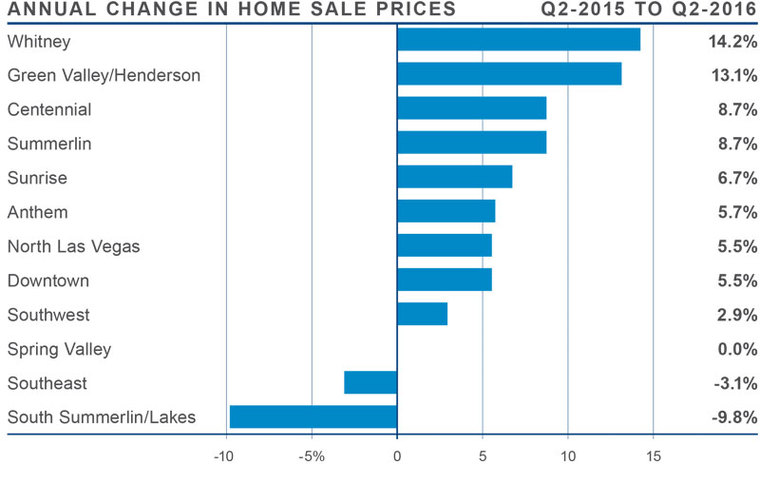
■ The Whitney sub-market saw the strongest annual growth with home prices rising by 14.2% to $174,333.
■ All but three sub-markets saw prices rise compared to the second quarter of 2015, and two sub-markets registered double-digit percentage gains.
■ Prices fell in the South Summerlin/Lakes and Southeast sub-markets, but I don’t believe that one declining quarter is enough to suggest that this trend will continue.

DAYS ON MARKET
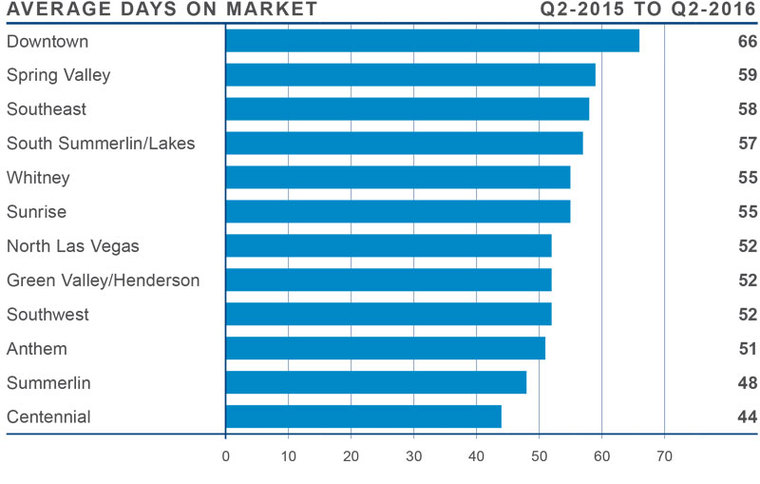
■ The average number of days it took to sell a home in the region dropped by nine days when compared to the second quarter of 2015.
■ The average time it took to sell a home in the region was 53 days.
■ The South Summerlin/Lakes sub-market was the only market where the number of days on market did not drop but it did not increase either!
■ The greatest drop in days-on-market was seen in the Sunrise sub-market, which dropped by
16 days.

CONCLUSIONS

The speedometer reflects the state of the region’s housing market using housing inventory, price gains, sales velocities, interest rates and larger economics factors.
The Southern Nevada economy continues to grow, but the pace has slowed. This is not a cause for concern at the moment, but I will be watching the data through the summer to better understand the reasons for the current slowdown.
Inventory levels are not what I would hope for, and it is clear that more choice in homes for sale will lead to a more balanced market. Home prices are still rising, but at a reasonable pace. Because of this, I am leaving the speedometer in the same position as last month—still in favor of sellers.
 Matthew Gardner is the Chief Economist for Windermere Real Estate, specializing in residential market analysis, commercial/industrial market analysis, financial analysis, and land use and regional economics. He is the former Principal of Gardner Economics, and has over 25 years of professional experience both in the U.S. and U.K.
 Facebook
 X
X
 Pinterest
 Copy Link


