ECONOMIC OVERVIEW
The counties covered by this report—Los Angeles, San Diego, San Bernardino, Orange, and Riverside—added 108,500 new jobs between August 2016 and August 2017. As a result, the unemployment rate dropped from 5.5% to 5.3%. As noted in last quarter’s report, employment growth in the Southern California market continues to taper, but the economy is still expanding and this will certainly continue through the balance of the year and into 2018.
HOME SALES ACTIVITY
 There were 51,906 home sales in the third quarter of this year. This was 0.5% lower than the same period in 2016, and 4.8% lower than in the second quarter of this year.
- The number of homes for sale remains well below the levels seen a year ago (-17.6%), and was 2.7% lower than the second quarter of 2017.
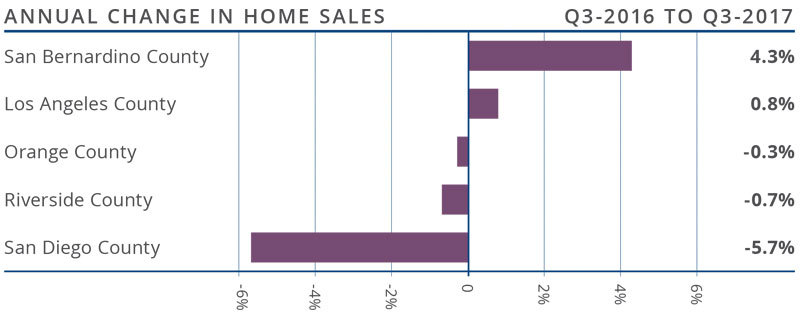
- Home sales were mixed, with reasonable growth in San Bernardino County but only modest gains in Los Angeles County. There was a small decline in sales in Orange and Riverside Counties but a more substantial drop in San Diego County. This continues a trend seen over the past two quarters that can again be attributed to woefully low levels of inventory.
- There was an average of 34,753 active listings in the third quarter, well below what is needed to get us to a balanced market.

HOME PRICES
- Year-over-year, average prices in the region rose by 7.9% but are just 0.3% higher than in the second quarter of this year.
- Home prices in the region continue to rise, but the pace of growth is decreasing. I do not consider this to be a concern at present, but we must keep an eye on housing affordability. Home prices cannot continue to rise at precipitous rates and a softening in growth has likely started, which is not necessarily a bad thing.
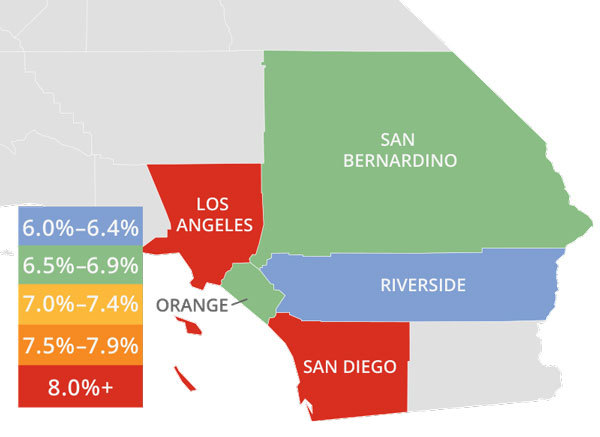
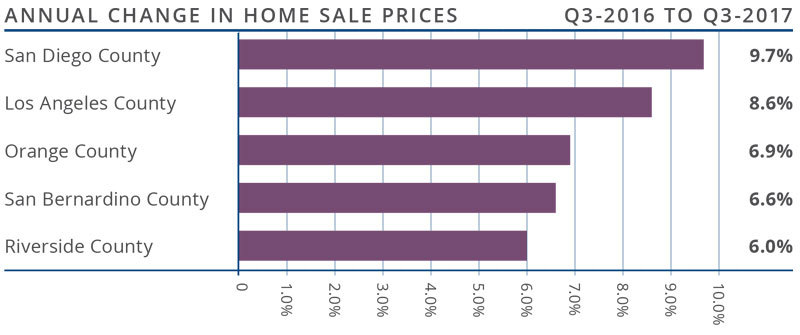
- San Diego County had the greatest annual appreciation in home values (+9.7%) and there were solid price increases across the rest of the region.
- Pending home sales dropped by 9% compared to the second quarter—likely due to a lack of inventory. Demand should remain robust, but, with fewer listings than needed, I anticipate a slight cooling in the markets for the balance of the year.

DAYS ON MARKET
- The average time it took to sell a home in the region was 38 days. This is a drop of 16 days compared to the third quarter of 2016, and 3 days shorter than the second quarter of 2017.
- The biggest drop in the number of days it took to sell a home was in Orange and San Bernardino Counties, where it took 24 fewer days to sell a home compared to the same period last year.
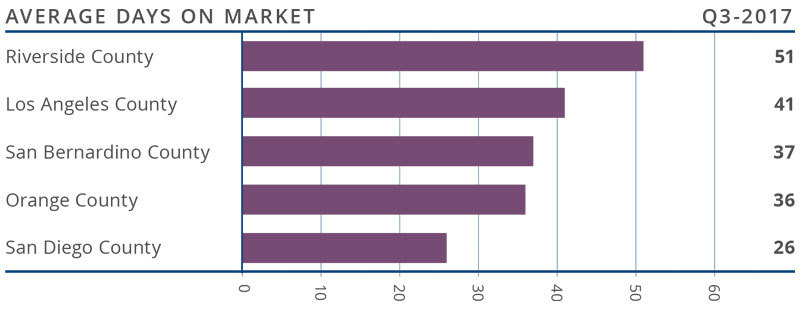
- Homes in San Diego County continue to sell at a faster rate than other markets in the region. In the third quarter, it took an average of just 26 days to sell a home, which is 4 fewer days than a year ago.
- All five counties saw a drop in the amount of time it took to sell a home between the third quarter of 2016 and the third quarter of 2017.

CONCLUSIONS
 The speedometer reflects the state of the region’s housing market using housing inventory, price gains, home sales, interest rates, and larger economic factors.
Southern California continues to add new households and job formation is still positive, which magnifies demand for housing. Mortgage rates remain historically low and low inventory continues to drive prices higher as demand exceeds supply. The number of homes for sale in the region is still well below the levels needed for a balanced market. Given all of these factors, I have moved the needle a little more in favor of sellers.
 Matthew Gardner is the Chief Economist for Windermere Real Estate, specializing in residential market analysis, commercial/industrial market analysis, financial analysis, and land use and regional economics. He is the former Principal of Gardner Economics, and has more than 30 years of professional experience both in the U.S. and U.K.
If you are in the market to buy or sell, we can connect you with an experienced agent here.
 Facebook
 X
X
 Pinterest
 Copy Link


