The following analysis of the Oregon and Southwest Washington real estate market is provided by Windermere Real Estate Chief Economist Matthew Gardner. We hope that this information may assist you with making better-informed real estate decisions. For further information about the housing market in your area, please don’t hesitate to contact your Windermere agent.
ECONOMIC OVERVIEW
The State of Oregon has added 30,400 new jobs over the past 12 months, representing a reasonable annual growth rate of 1.6%. It is clear, however, that job growth in Oregon has started to taper, with the annual rate dropping below 2% in the early spring of this year. This is no great cause for concern as the state has essentially reached full employment, which tends to slow employment growth.
The Southwest Washington market area added 5,580 new jobs over the past 12 months, representing an annual growth rate of 2.7%.
Oregon’s unemployment rate was 4.0% in June, marginally below the 4.1% rate seen a year ago. In Southwest Washington, the unemployment rate was measured at 5.3%, marginally lower than the year-ago rate of 5.4%.
HOME SALES ACTIVITY
- Second quarter home sales dropped by a modest 2.8% compared to the same period last year, with a total of 17,156 transactions occurring.
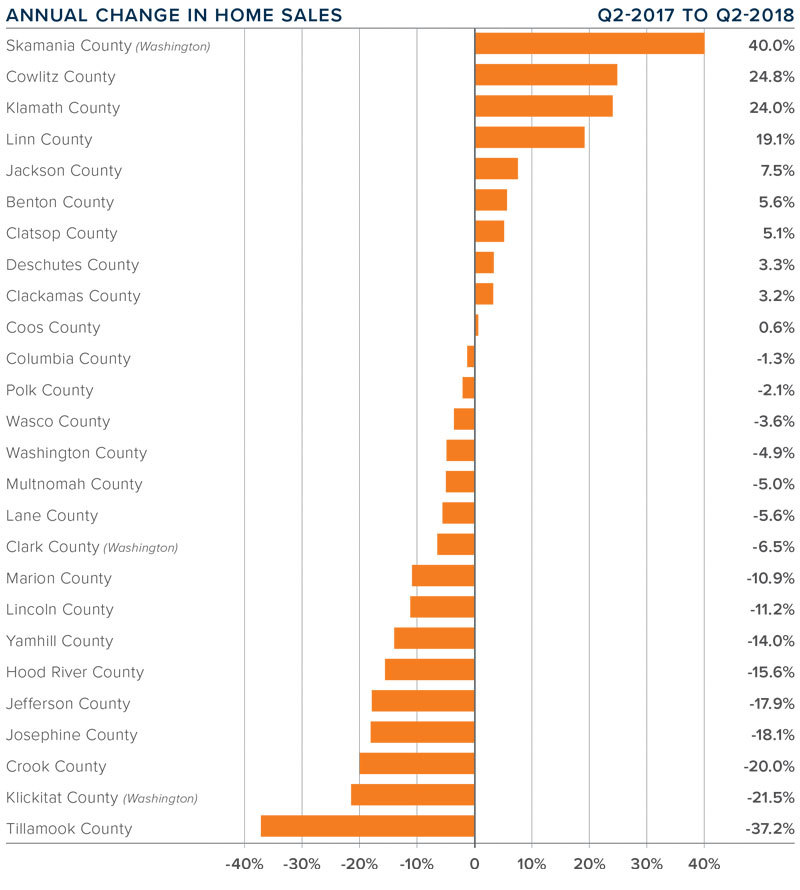
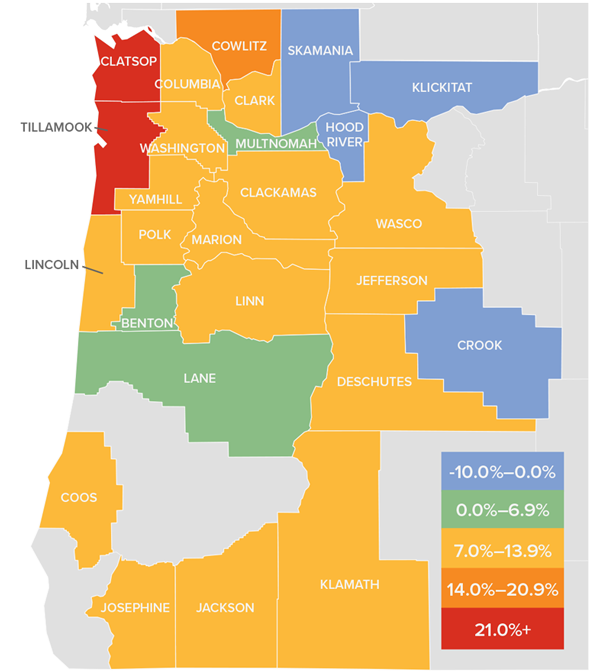
- Sales rose the most in Skamania County, which saw a 40% increase compared to the second quarter of 2017. There were also noticeable increases in Cowlitz, Klamath, and Linn counties. Home sales fell the most in Tillamook, Klickitat, Crook, Josephine, and Jefferson counties.
- Year-over-year sales rose in 10 counties and dropped in the other 16 counties contained in this report.
- Sales continue to be a mixed bag in the region. I am not overly concerned by the drop in sales in several counties as they are all small markets that are prone to substantial swings. Inventory remains tight and this can drag home sales lower.

HOME PRICES

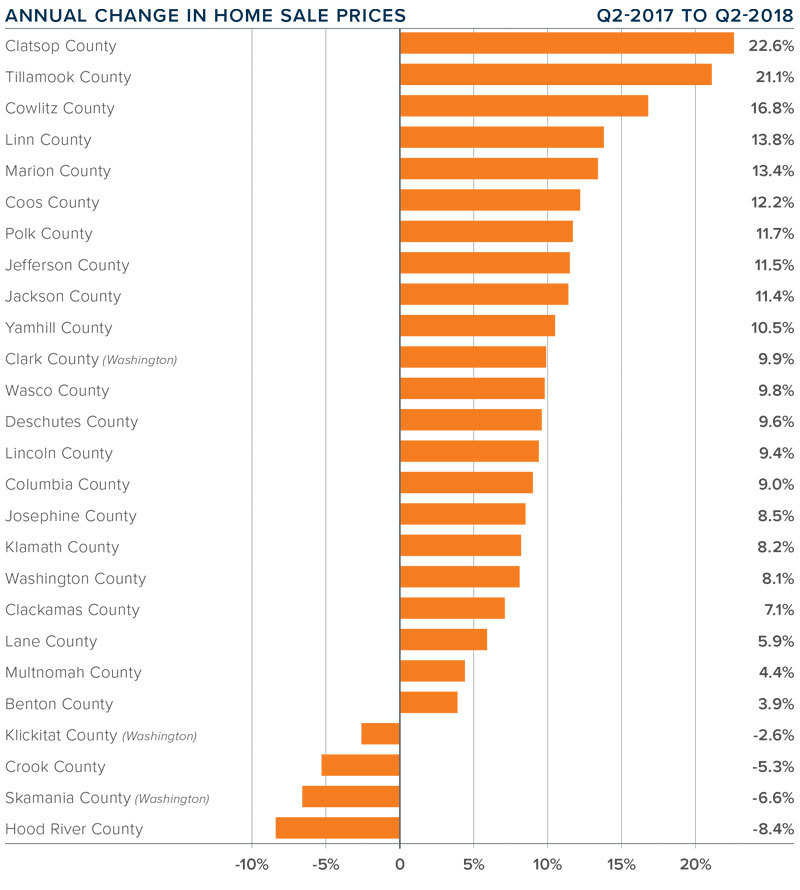
- The average home price in the region rose 7.9% year-over-year to $391,725. That number is 6.6% higher than the first quarter of 2018.
- Clatsop County led the market with the strongest annual price growth. Homes there sold for 22.6% more than a year ago.
- All but four counties saw price growth relative to the second quarter of 2017, with 10 of them experiencing double-digit increases.
- The takeaway from this report is that, in aggregate, price growth has started to slow but remains above the long-term average.

DAYS ON MARKET
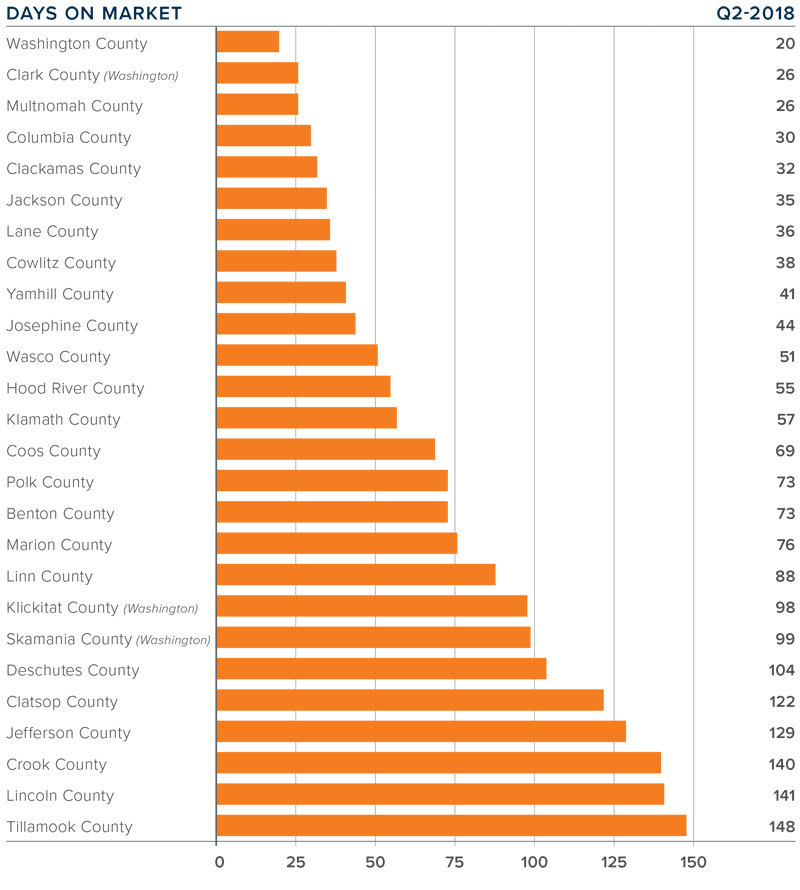
- The average number of days it took to sell a home in the region dropped by four days compared to the second quarter of 2017 and was down by 17 days from the first quarter of 2018.
- The average time it took to sell a home in the region last quarter was 71 days.
- Nineteen counties saw the length of time it took to sell a home drop or remain static when compared to a year ago. Seven counties saw market time rise.
- Homes again sold the fastest in Washington (20 days), Clark (26 days), and Multnomah (26 days) counties.

CONCLUSIONS
 The speedometer reflects the state of the region’s housing market using housing inventory, price gains, home sales, interest rates, and larger economic factors.
Housing markets throughout Oregon and Southwest Washington continue to benefit greatly from the healthy regional economy. Home sales remain solid; however, we are seeing some slowdown in prices, which I consider to be positive as affordability issues could start to taper. That said, housing inventory is still well below balanced-market levels. Sellers remain in the driver’s seat, but I am hopeful that inventory levels will start to increase, which will be a relief to home buyers. Because of this, the needle remains the same as last quarter.

Matthew Gardner is the Chief Economist for Windermere Real Estate, specializing in residential market analysis, commercial/industrial market analysis, financial analysis, and land use and regional economics. He is the former Principal of Gardner Economics and has more than 30 years of professional experience both in the U.S. and U.K.
 Facebook
 X
X
 Pinterest
 Copy Link


