The following analysis of select Montana real estate markets is provided by Windermere Real Estate Chief Economist Matthew Gardner. We hope that this information may assist you with making better-informed real estate decisions. For further information about the housing market in your area, please don’t hesitate to contact your Windermere agent.
ECONOMIC OVERVIEW
The State of Montana has added 4,800 new non-agricultural jobs over the past 12 months, representing an annual growth rate of 1%. Montana’s growth rate remains below the U.S. as a whole and my current forecast is for statewide job growth to rise 1.1% in 2019. My preliminary forecast for 2020 shows the state increasing employment by 1.2%.
In September, the state unemployment rate was a healthy 3.3%, down from 3.7% a year ago.
HOME SALES
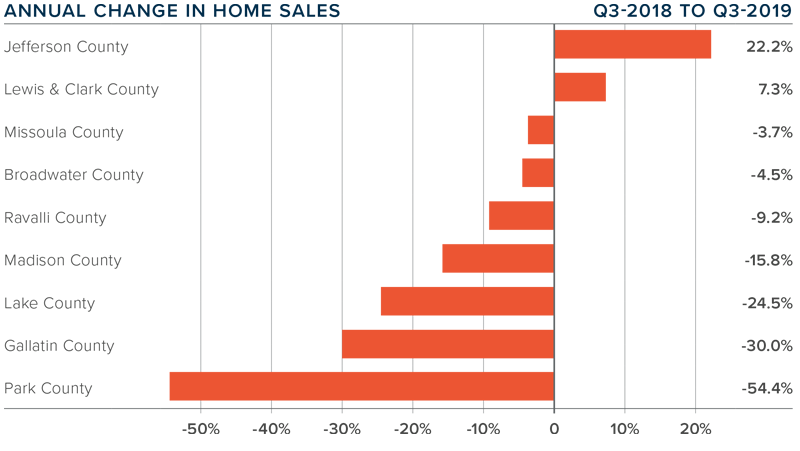
- During the third quarter of 2019, 1,070 homes sold — a drop of 15.5% over the same period in 2018.
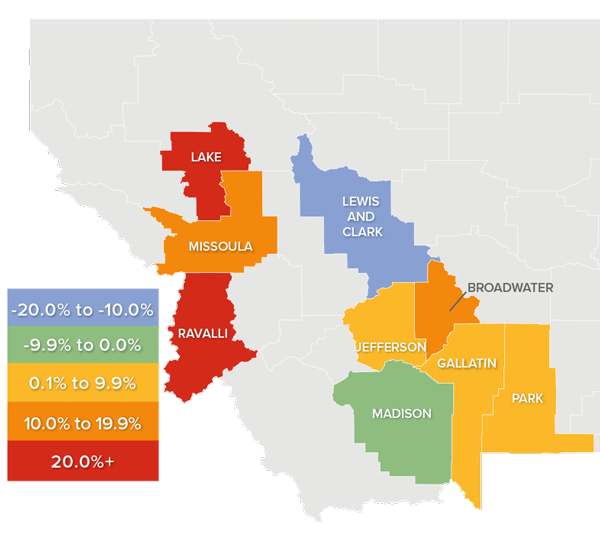
- Total sales activity was a mixed bag, with increases in only two counties and declines in seven. The largest annual increase was in Jefferson County, where sales were up more than 22%. The largest decline in sales was in the very small Park County.
- The number of homes for sale remains well below what I would like, with an average of 1,264 listings in the third quarter within the counties contained in this report.
- As mentioned above, inventory levels remain low, and this is holding sales back. Unfortunately, I don’t expect to see any significant increase in the number of homes for sale until next spring.

HOME PRICES
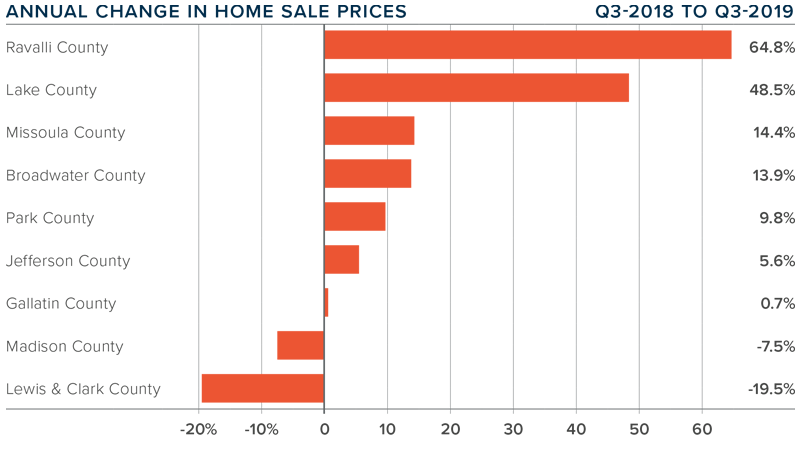
 Following the significant 25.2% annual increase in home prices in the second quarter, the third-quarter figures were not as impressive. Year-over-year prices dropped 7.1% to an average of $373,133.
- Average prices dropped in Lewis & Clark and Madison counties. I don’t believe this is endemic and expect prices to pick back up in the new year.
- Even though the region saw home prices drop, there were several counties that experienced significant price growth. Prices jumped in Ravalli and Lake counties, and solid gains were also seen in Missoula and Broadwater counties.
- The takeaway from this data is that prices continue to rise but not all markets are created equal.

DAYS ON MARKET
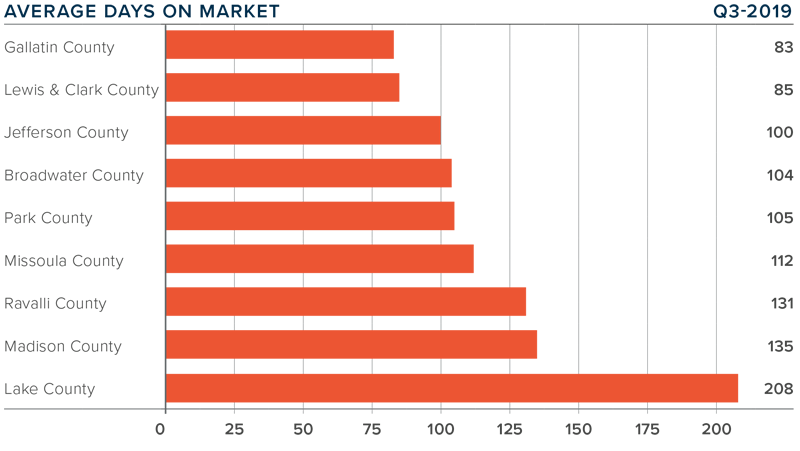
- The average number of days it took to sell a home rose four days compared to the third quarter of 2018.
- Homes sold fastest in Gallatin County and slowest in Lake County. Four counties — Missoula, Lewis & Clark, Jefferson, and Madison — saw days on market drop compared to the same period a year ago.
- During the third quarter of 2019, it took an average of 118 days to sell a home in the region.
- While days on market rose modestly in third-quarter, this is likely only a seasonal issue.

CONCLUSIONS
 This speedometer reflects the state of the region’s real estate market using housing inventory, price gains, home sales, interest rates, and larger economic factors.
For the third quarter of 2019, I have moved the needle a little more in favor of buyers, but it’s still a sellers’ market. Mortgage rates remain at very attractive levels and home price growth has slowed somewhat. That said, the number of homes for sale is still very low and this might lead some buyers to wait until next spring when they hope there will be more choice.
ABOUT MATTHEW GARDNER
 As Chief Economist for Windermere Real Estate, Matthew Gardner is responsible for analyzing and interpreting economic data and its impact on the real estate market on both a local and national level. Matthew has over 30 years of professional experience both in the U.S. and U.K.
In addition to his day-to-day responsibilities, Matthew sits on the Washington State Governors Council of Economic Advisors; chairs the Board of Trustees at the Washington Center for Real Estate Research at the University of Washington; and is an Advisory Board Member at the Runstad Center for Real Estate Studies at the University of Washington where he also lectures in real estate economics.
 Facebook
 X
X
 Pinterest
 Copy Link


