The following analysis of select neighborhoods in the Park City real estate market is provided by Windermere Real Estate Chief Economist Matthew Gardner. We hope that this information may assist you with making better-informed real estate decisions. For further information about the housing market in your area, please don’t hesitate to contact your Windermere agent.
ECONOMIC OVERVIEW
Though Utah is still feeling a significant economic hit, the jobs losses in March and April have certainly turned around. The pandemic caused the loss of more than 144,000 jobs in the state, but the most recent figures show that Utah has now recovered 95,900 of them. Although that still leaves a shortfall of 48,700 jobs, the numbers are promising.
The unemployment rate, which peaked at 10.4% in April, has dropped and now stands at a very respectable 4.1%.
If a headwind exists, it’s that new COVID-19 infection rates started to rise pretty aggressively again in September, and this has the potential to significantly slow Utah’s economic recovery.
HOME SALES
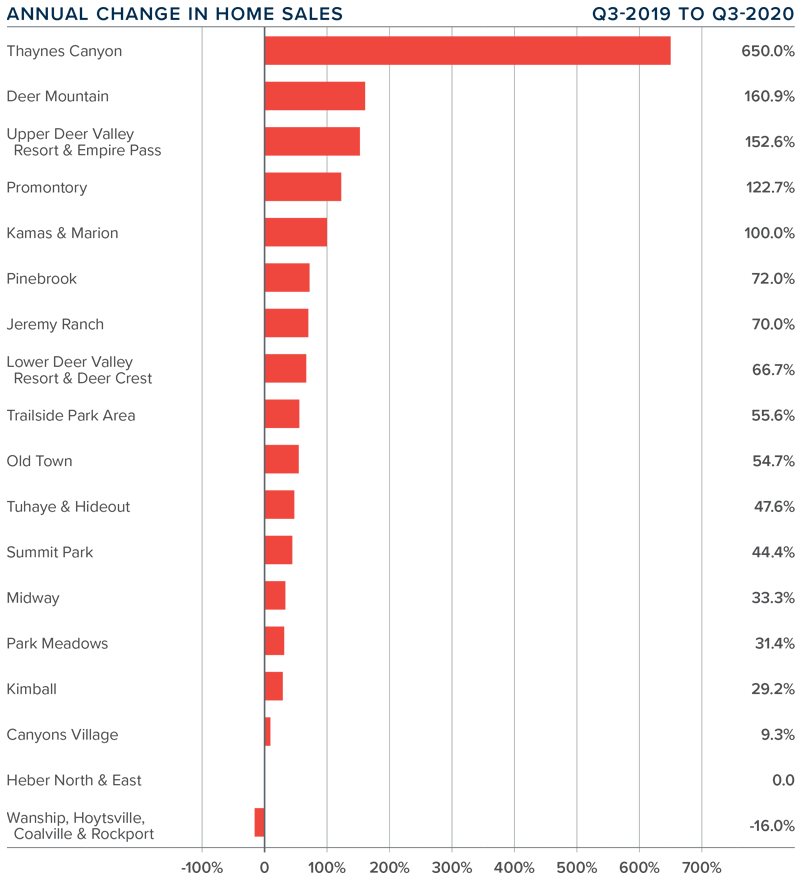
❱ In the third quarter of 2020, 349 homes sold in the Park City area, an increase of a very solid 46% compared to the third quarter of 2019. Sales were also up by a remarkable 166.4% compared to the second quarter of this year.
❱ Sales were down 16% in Wanship/Hoytsville/Coalville/Rockport, and static in Heber North & East from the quarter before. Sales rose in all other areas. Thaynes Canyon saw a remarkable 650% increase, though that equated to only 15 sales in the quarter.
❱ The growth in sales relative to the second quarter came as inventory levels dropped almost 10%. The growth in sales was a far cry from the significant decline we saw in the second quarter of the year. The market is clearly back!
❱ Pending home sales were 80.7% higher than a year ago, and up 228% compared to the second quarter of this year. Closings in the fourth quarter will be impressive.
HOME PRICES
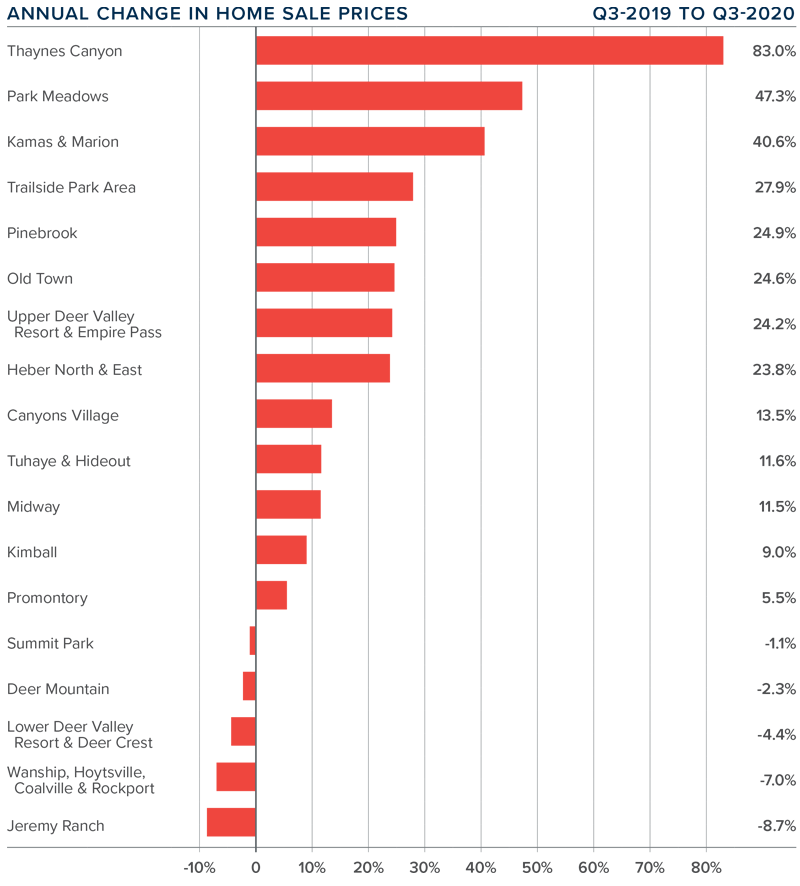
❱ The average home price in the Park City neighborhoods contained in this report rose 28.3% year over year to $1.469 million. Prices were 26.7% higher than in the second quarter of 2020.
❱ The most affordable neighborhoods in terms of average home prices were again in the Kimball, Heber North & East, and Wanship/Hoytsville/Coalville/Rockport neighborhoods. The most expensive areas were Thaynes Canyon and the Upper Deer Valley Resort, where average home prices exceeded $3 million.
❱ Even with aggregate prices up significantly, they did not increase in all neighborhoods. Prices dropped in five neighborhoods, but I am not particularly concerned, as small areas can experience wild swings in prices depending on the homes that sold. Annual prices dropped in seven markets, with the most significant decline in the Canyons Village area.
❱ The Park City market is relatively small but contains some very expensive real estate. I mentioned in last quarter’s Gardner Report that it would be interesting to see if COVID-19-related impacts were going to persist or not. It appears as if they haven’t.
DAYS ON MARKET
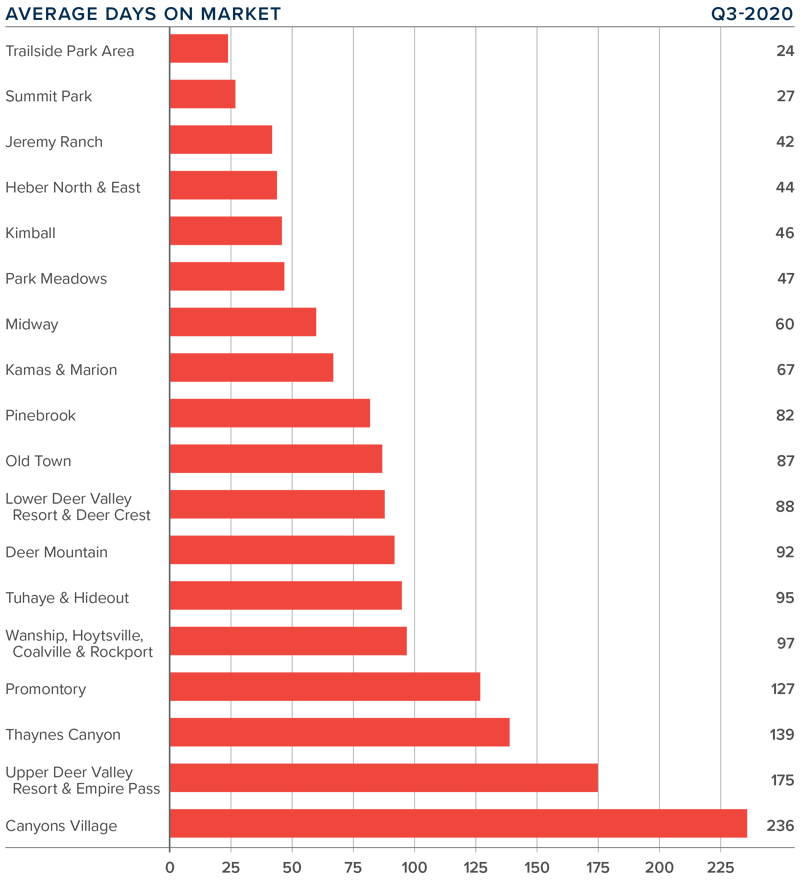
❱ The average time it took to sell a home in the Park City area dropped 25 days compared to the third quarter of 2019, and was down 13 days compared to the second quarter of this year.
❱ The amount of time it took to sell a home dropped in all but three neighborhoods relative to the third quarter of 2019: Wanship/Hoytsville/Coalville/Rockport, Deer Mountain, and Tuhaye/Hideout.
❱ In the third quarter, it took an average of 88 days to sell a home. Homes sold fastest in the Trailside Park and Summit Park areas and slowest in the Canyons Village neighborhood.
❱ The greatest drop in market time was in the Kamas & Marion neighborhood, where it took 94 fewer days to
sell a home than during the same period a year ago.
CONCLUSIONS
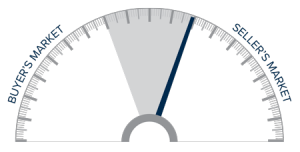 This speedometer reflects the state of the region’s real estate market using housing inventory, price gains, home sales, interest rates, and larger economic factors.
Buyers are trying to take advantage of historically low mortgage rates, and many are offering cash in order to put themselves in a more competitive position than other would-be buyers. Assuming the state gets new infection rates back under control, I believe sellers still have the upper hand.
I am therefore moving the needle a little more in their favor.
ABOUT MATTHEW GARDNER
 As Chief Economist for Windermere Real Estate, Matthew Gardner is responsible for analyzing and interpreting economic data and its impact on the real estate market on both a local and national level. Matthew has over 30 years of professional experience both in the U.S. and U.K.
In addition to his day-to-day responsibilities, Matthew sits on the Washington State Governors Council of Economic Advisors; chairs the Board of Trustees at the Washington Center for Real Estate Research at the University of Washington; and is an Advisory Board Member at the Runstad Center for Real Estate Studies at the University of Washington where he also lectures in real estate economics.
 Facebook
 X
X
 Pinterest
 Copy Link
