The following analysis of select Maui real estate markets is provided by Windermere Real Estate Chief Economist Matthew Gardner. We hope that this information may assist you with making better-informed real estate decisions. For further information about the housing market in your area, please don’t hesitate to contact your Windermere Real Estate agent.
Regional Economic Overview
Maui’s employment picture continued to improve in the third quarter, but the pace of the job recovery has slowed. This is likely due to the governor’s announcement discouraging tourists from visiting as COVID-19 cases in the state started to rise again. In total, Maui only grew by 600 jobs in the third quarter, down from 3,200 jobs that were added in the second quarter. At the end of the third quarter, Maui had recovered 12,400 of the 28,900 jobs that were lost due to COVID-19. With employment levels still down 16,500 jobs from the pre-pandemic peak, there is still work to be done. New cases have started to slow, which may lead to stronger job growth in the final quarter of this year, but we will not see a full job recovery until 2022. Maui’s unemployment rate remained elevated in September, with 8.1% of the workforce still without jobs. However, this is considerably better than the 32.9% rate of last April. The state unemployment rate was 6.6% in September, down from 7.7% at the end of the second quarter.
maui, hawaii Home Sales
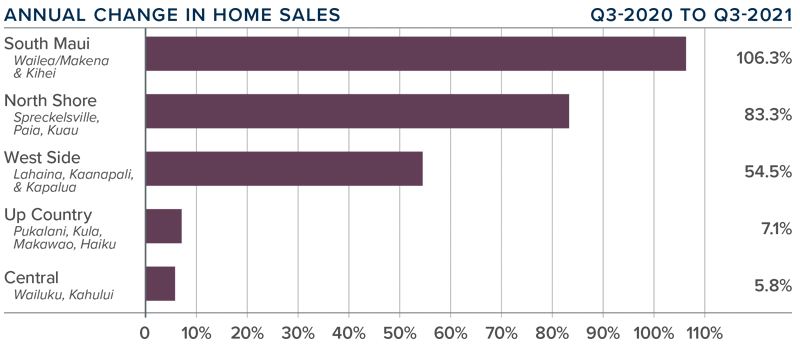
❱ In the third quarter of 2021, 729 homes sold, a significant increase of 49.7% compared to a year ago. However, as COVID-19 was taking hold at this time last year, this comparison is not informative. Compared to the second quarter of this year, sales fell 17.1%.
❱ Year-over-year, sales rose across the board, with significant growth in South Maui, North Shore, and the West Side. Sales fell in all areas other than the Central area compared to the second quarter of 2021.
❱ The average number of homes for sale in the quarter was down 19.5% compared to the second quarter of 2021. Fewer listings would explain the drop in sales between second and third quarter.
❱ Pending home sales dropped 14.4% compared to the previous quarter, suggesting that closings in the final quarter of the year may not show growth.
maui, hawaii Home Prices
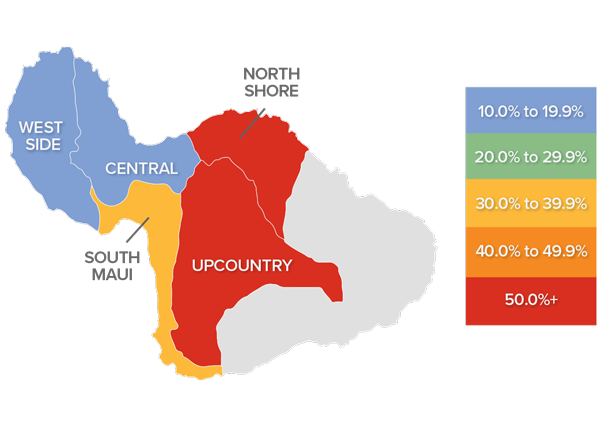
❱ Average home prices on Maui rose 37.8% year over year to $1.419 million. Prices were 2.9% higher than in the second quarter of 2021.
❱ Affordability issues persist and, thanks to favorable financing rates and persistently low levels of inventory, I still think the island will continue to see price appreciation. However, the rate of growth is steadily slowing.
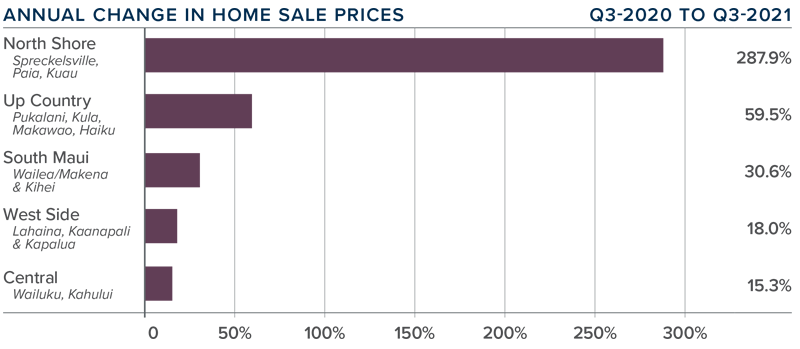
❱ All markets saw sale prices rise, but the massive increase in the North Shore area is a little deceiving. With only ten sales in the entire quarter, the increase of 287% was an anomaly. Compared to the second quarter, prices rose in all markets other than the Central area, but the drop there was minimal (-.4%).
❱ Limited listing inventory and solid demand have continued to push prices higher but, as I suggested in last quarter’s Gardner Report, the pace of price growth is unsustainable. I said then I expected to see a modest slowing in price appreciation, which appears to be the case.
Days on Market
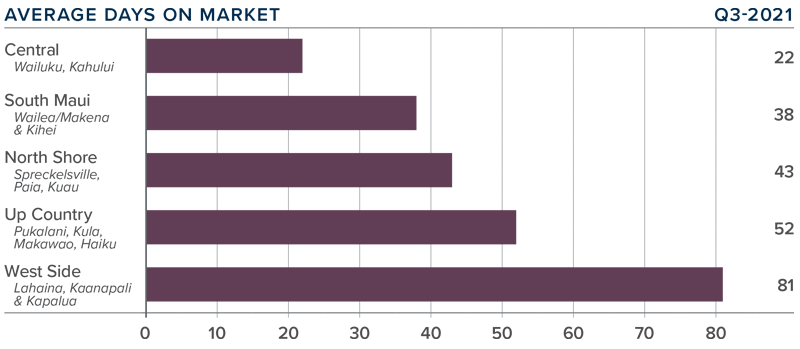
❱ The average number of days it took to sell a home on Maui dropped six days compared to the third quarter of 2020.
❱ The length of time it took to sell a home dropped year over year in the South Maui, Central, and Up Country market areas, but rose in West Side and the North Shore.
❱ In the third quarter, it took an average of 47 days to sell a home, with transactions occurring the fastest in the Central area and slowest on the West Side.
❱ Compared to the second quarter of 2021, market time dropped in the North Shore and Up Country areas but rose in the balance of the markets contained in this report.
Conclusions
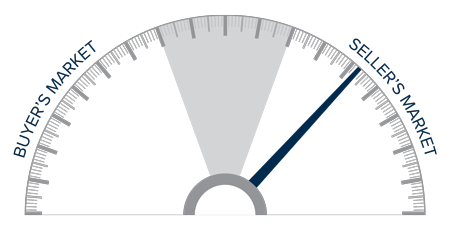
This speedometer reflects the state of the region’s real estate market using housing inventory, price gains, home sales, interest rates, and larger economic factors.
The number of homes for sale on Maui remains low. This has driven prices up and days on market down—both of which favor homes sellers. In addition to this, low mortgage rates are a stimulant to buying, especially if buyers believe rates will rise (which they have started to do). On the other hand, lower sales may lead sellers to list their homes more competitively to attract buyers, and this, naturally, favors home buyers.
Inventory levels are unlikely to rise significantly anytime soon, and while I expect price growth to continue slowing, it remains a seller’s market. The pendulum may start to move more toward buyers, but not yet. As such, I have left the needle in the same spot as in the second quarter of the year.
About Matthew Gardner

As Chief Economist for Windermere Real Estate, Matthew Gardner is responsible for analyzing and interpreting economic data and its impact on the real estate market on both a local and national level. Matthew has over 30 years of professional experience both in the U.S. and U.K.
In addition to his day-to-day responsibilities, Matthew sits on the Washington State Governors Council of Economic Advisors; chairs the Board of Trustees at the Washington Center for Real Estate Research at the University of Washington; and is an Advisory Board Member at the Runstad Center for Real Estate Studies at the University of Washington where he also lectures in real estate economics.
 Facebook
 X
X
 Pinterest
 Copy Link


