
 Facebook
 X
X
 Pinterest
 Copy Link
10 Housing Predictions for 2024

This video shows Windermere Chief Economist Matthew Gardner’s Top 10 Predictions for 2024. Each month, he analyzes the most up-to-date U.S. housing data to keep you well-informed about what’s going on in the real estate market. See more market insights on our blog here.
Matthew Gardner’s Top 10 Predictions for 2024
1. Still no housing bubble
This was number one on my list last year and, so far, my forecast was spot on. The reason why I’m calling it out again is because the market performed better in 2023 than I expected. Continued price growth, combined with significantly higher mortgage rates, might suggest to some that the market will implode in 2024, but I find this implausible.
2. Mortgage rates will drop, but not quickly
The U.S. economy has been remarkably resilient, which has led the Federal Reserve to indicate that they will keep mortgage rates higher for longer to tame inflation. But data shows inflation and the broader economy are starting to slow, which should allow mortgage rates to ease in 2024. That said, I think rates will only fall to around 6% by the end of the year.
3. Listing activity will rise modestly
Although I expect a modest increase in listing activity in 2024, many homeowners will be hesitant to sell and lose their current mortgage rate. The latest data shows 80% of mortgaged homeowners in the U.S. have rates at or below 5%. Although they may not be inclined to sell right now, when rates fall to within 1.5% of their current rate, some will be motivated to move.
4.Home prices will rise, but not much
While many forecasters said home prices would fall in 2023, that was not the case, as the lack of inventory propped up home values. Given that it’s unlikely that there will be a significant increase in the number of homes for sale, I don’t expect prices to drop in 2024. However, growth will be a very modest 1%, which is the lowest pace seen for many years, but growth all the same.
5. Home values in markets that crashed will recover
During the pandemic there were a number of more affordable markets across the country that experienced significant price increases, followed by price declines post-pandemic. I expected home prices in those areas to take longer to recover than the rest of the nation, but I’m surprised by how quickly they have started to grow, with most markets having either matched their historic highs or getting close to it – even in the face of very high borrowing costs. In 2024, I expect prices to match or exceed their 2022 highs in the vast majority of metro areas across the country.
6. New construction will gain market share
Although new construction remains tepid, builders are benefiting from the lack of supply in the resale market and are taking a greater share of listings. While this might sound like a positive for builders, it’s coming at a cost through lower list prices and increased incentives such as mortgage rate buy downs. Although material costs have softened, it will remain very hard for builders to deliver enough housing to meet the demand.
7. Housing affordability will get worse
With home prices continuing to rise and the pace of borrowing costs far exceeding income growth, affordability will likely erode further in 2024. For affordability to improve, it would require either a significant drop in home values, a significant drop in mortgage rates, a significant increase in household incomes, or some combination of the three. But I’m afraid this is very unlikely. First-time home buyers will be the hardest hit by this continued lack of affordable housing.
8. Government needs to continue taking housing seriously
The government has started to take housing and affordability more seriously, with several states already having adopted new land use policies aimed at releasing developable land. In 2024, I hope cities and counties will continue to ease their restrictive land use policies. I also hope they’ll continue to streamline the permitting process and reduce the fees that are charged to builders, as these costs are passed directly onto the home buyer, which further impacts affordability.
9. Foreclosure activity won’t impact the market
Many expected that the end of forbearance would bring a veritable tsunami of homes to market, but that didn’t happen. At its peak, almost 1-in-10 homes in America were in the program, but that has fallen to below 1%. That said, foreclosure starts have picked up, but still remain well below pre-pandemic levels. Look for delinquency levels to continue rising in 2024, but they will only be returning to the long-term average and are not a cause for concern.
10. Sales will rise but remain the lowest in 15 years
2023 will likely be remembered as the year when home sales were the lowest since the housing bubble burst in 2008. I expect the number of homes for sale to improve modestly in 2024 which, combined with mortgage rates trending lower, should result in about 4.4 million home sales. Ultimately though, demand exceeding supply will mean that sellers will still have the upper hand.
About Matthew Gardner
As Chief Economist for Windermere Real Estate, Matthew Gardner is responsible for analyzing and interpreting economic data and its impact on the real estate market on both a local and national level. Matthew has over 30 years of professional experience both in the U.S. and U.K.
In addition to his day-to-day responsibilities, Matthew sits on the Washington State Governors Council of Economic Advisors; chairs the Board of Trustees at the Washington Center for Real Estate Research at the University of Washington; and is an Advisory Board Member at the Runstad Center for Real Estate Studies at the University of Washington where he also lectures in real estate economics.
Q3 2023 Arizona Real Estate Market Update

The following analysis of select counties of the Arizona real estate market is provided by Windermere Real Estate. We hope that this information may assist you with making better-informed real estate decisions. For further information about the housing market in your area, please don’t hesitate to contact your Windermere Real Estate agent.
Regional Economic Overview
Job growth in Arizona has levelled off. The addition of 57,000 new jobs over the past 12 months represents an annual growth rate of 1.8%, which matches the level in the second quarter of this year. That said, Arizona’s unemployment rate in August was 3.8%, down from 4% in the third quarter of 2022.
Looking at the metro markets contained in this report, over the past 12 months Phoenix saw its job base rise 1.9% or 40,200 positions. With the addition of only 400 new jobs, employment in Prescott rose .6%. Unemployment rates suggested that both markets remain close to full employment, with the Phoenix area showing a jobless rate of 3.5%, while the unemployment rate in Prescott was 3.8%. The jobless rate in Phoenix matched the level in the third quarter of 2022, while Prescott saw its rate rise from 3.5%.
Arizona Home Sales
❱ In the third quarter of 2023, 14,711 homes sold. This was down 7% from the third quarter of 2022 and down 21.3% compared to the second quarter of this year.
❱ The slowdown in sales from the second quarter came in concert with a modest .9% increase in listing activity. It appears that the impact of higher mortgage rates is starting to be felt.
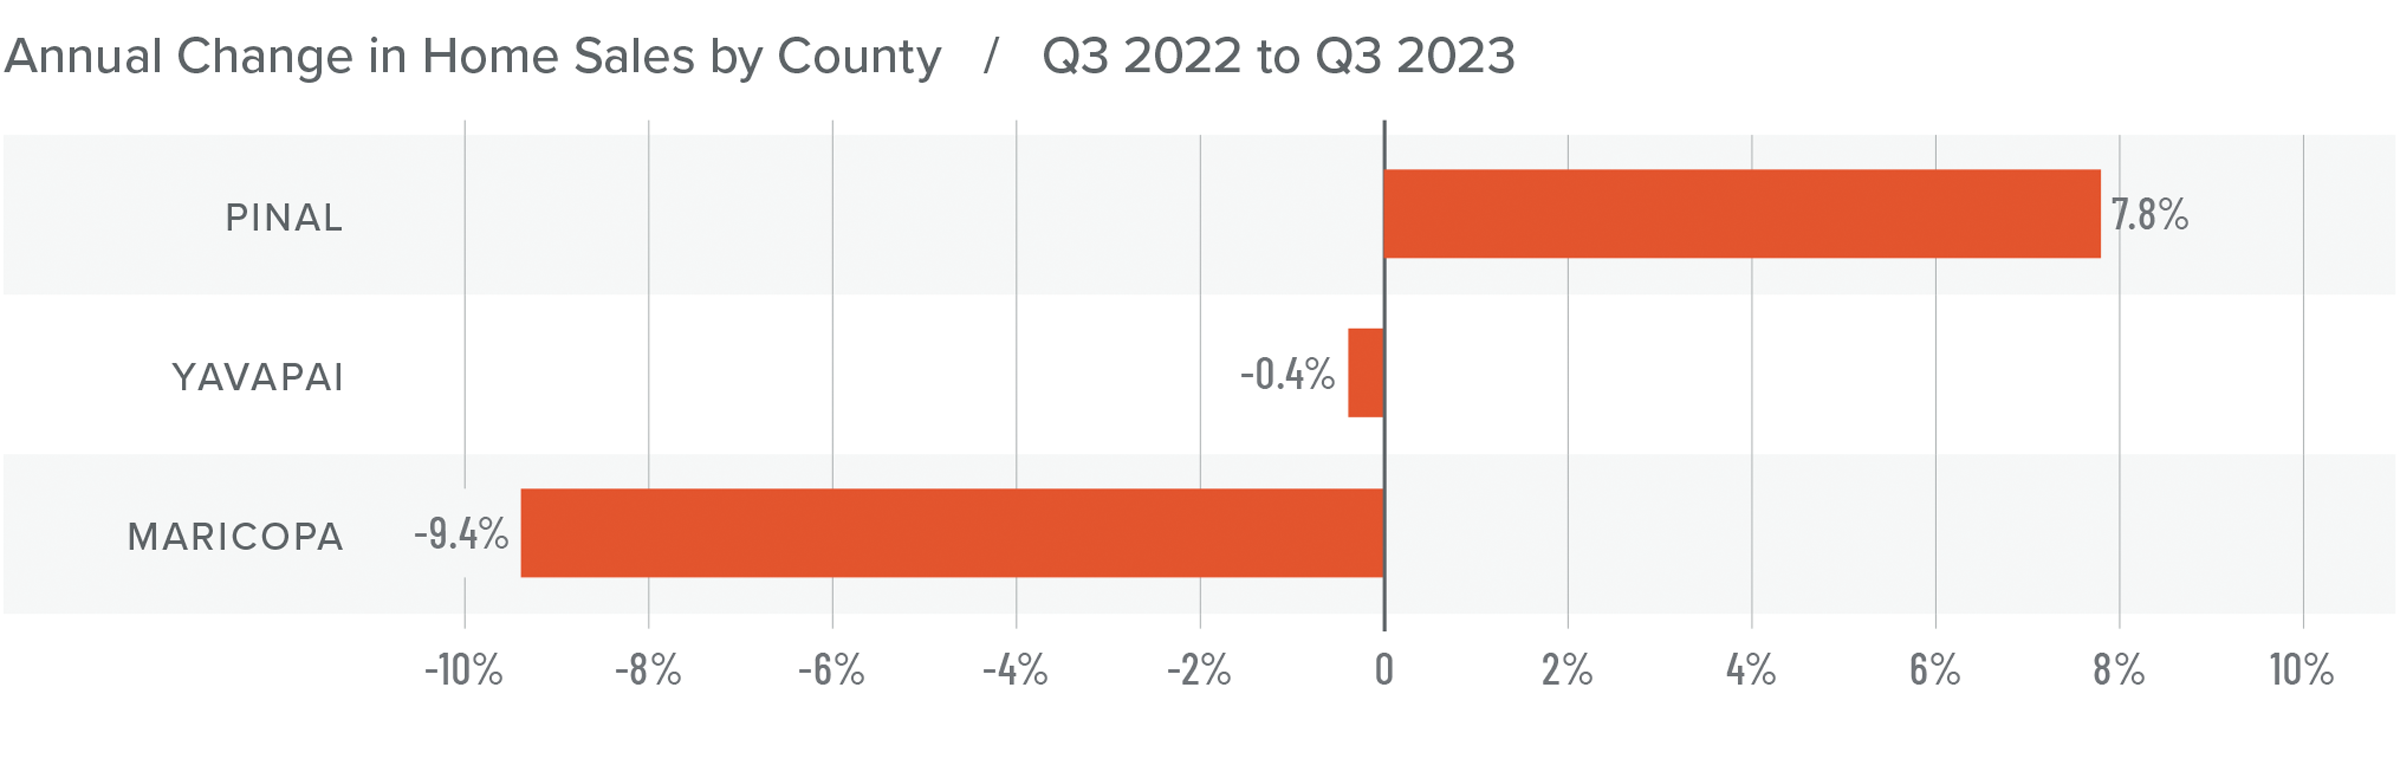
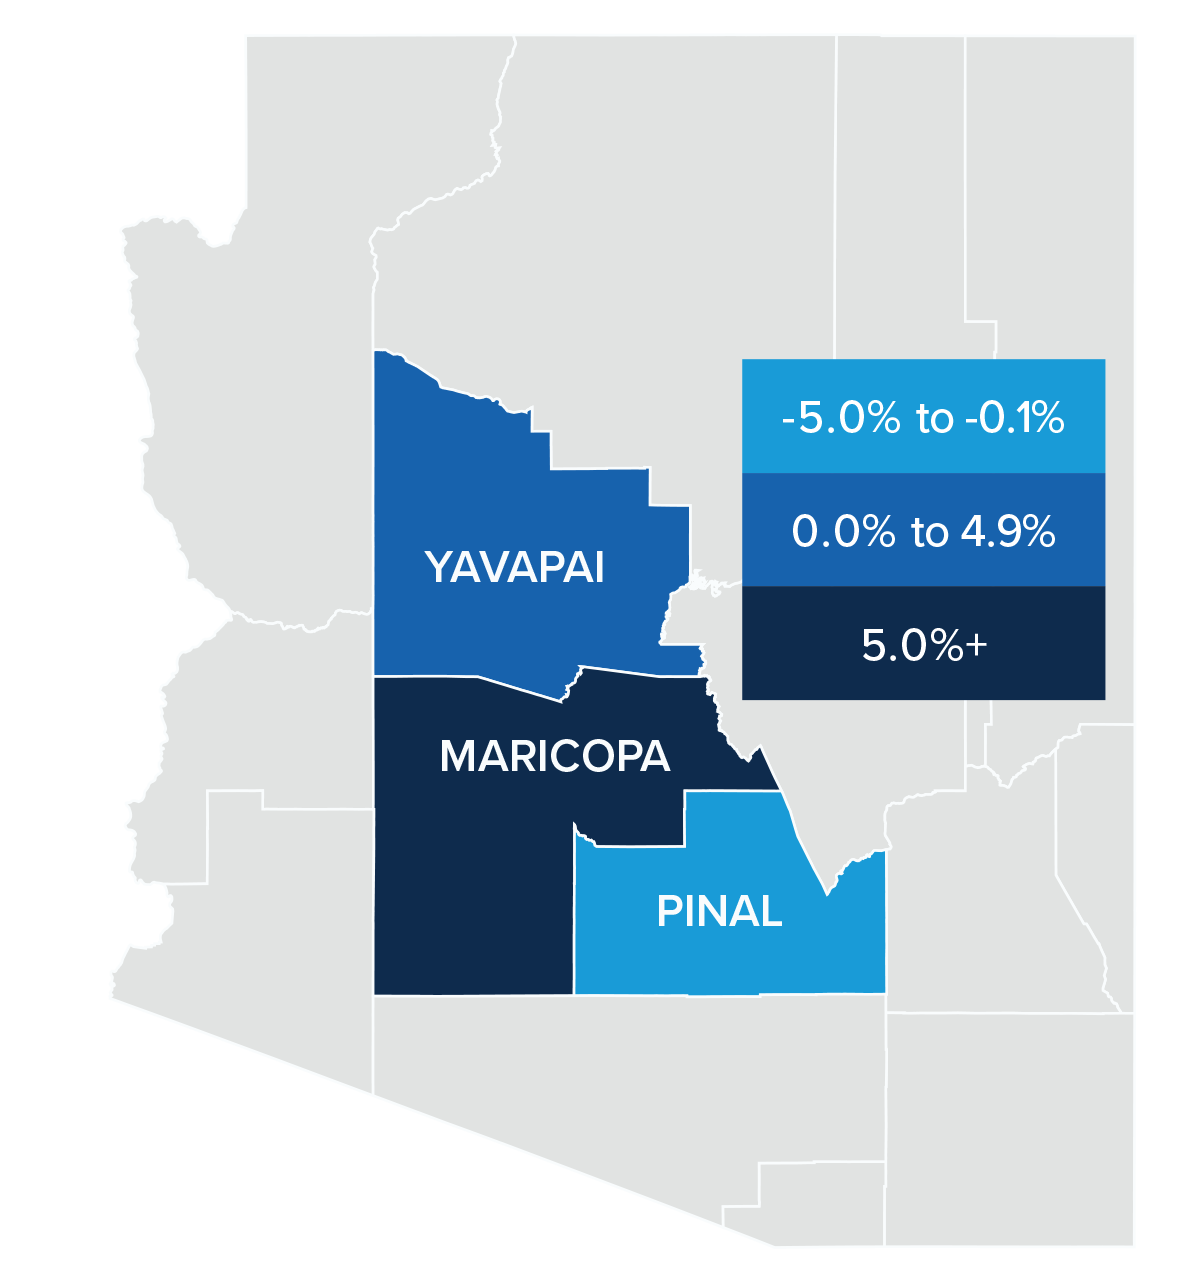
❱ Sales fell in Maricopa and Yavapai counties from the same period of 2022. Sales were up almost 8% in Pinal County. Compared to the second quarter of this year, sales fell across the board.
❱ Pending sales fell in Pinal and Maricopa counties but rose in the smaller Prescott market compared to the second quarter of 2023. With Maricopa County accounting for 84% of the market, I think it’s safe to assume that sales in the fourth quarter may also be down.
Arizona Home Prices
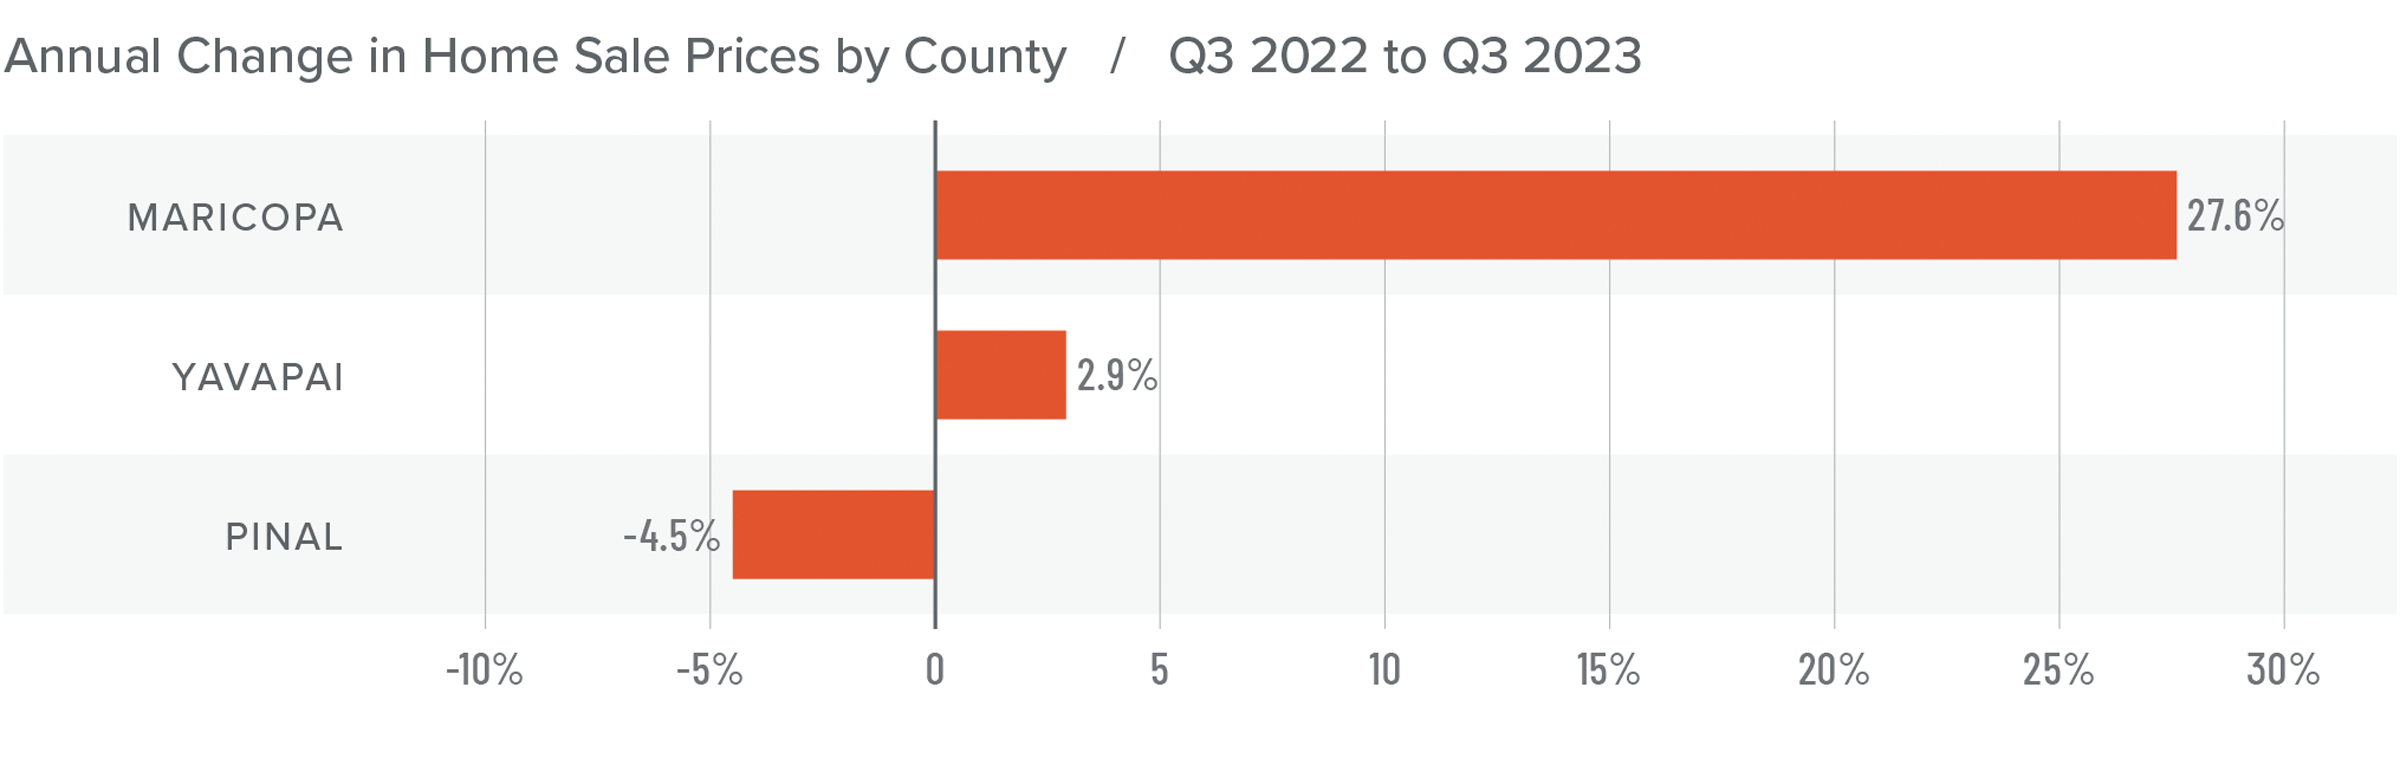
❱ Home sale prices rose a modest 1.9% compared to the third quarter of 2022 but were 2.2% lower than in the second quarter of the year. The average sale price was $596,465.
❱ Compared to the second quarter of this year, sale prices were 24.3% higher in Yavapai County but fell in the other two markets. Pinal County prices dropped .2% and Maricopa County prices were 2.3% lower.
❱ Lower sale prices are likely due to higher mortgage rates and decreasing affordability, as well as the fact that median list prices fell 1.7% between the second and third quarters of the year.
❱ With list prices lower and mortgage rates substantially higher, I doubt prices will see tangible increases for the remainder of the year.
Mortgage Rates
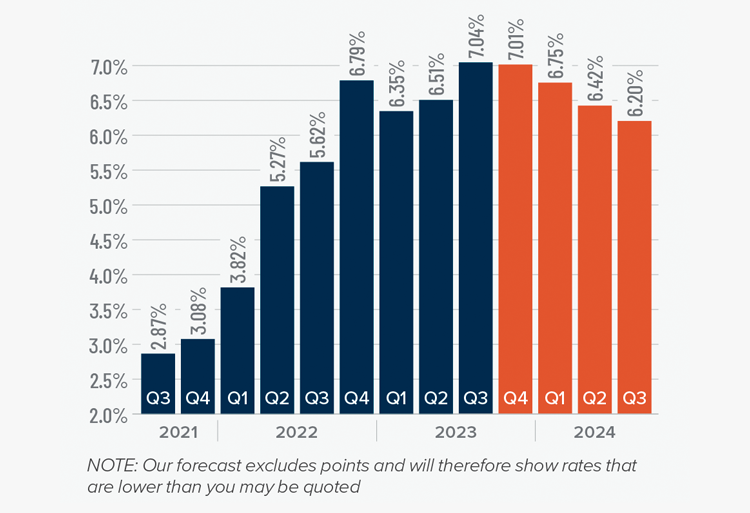
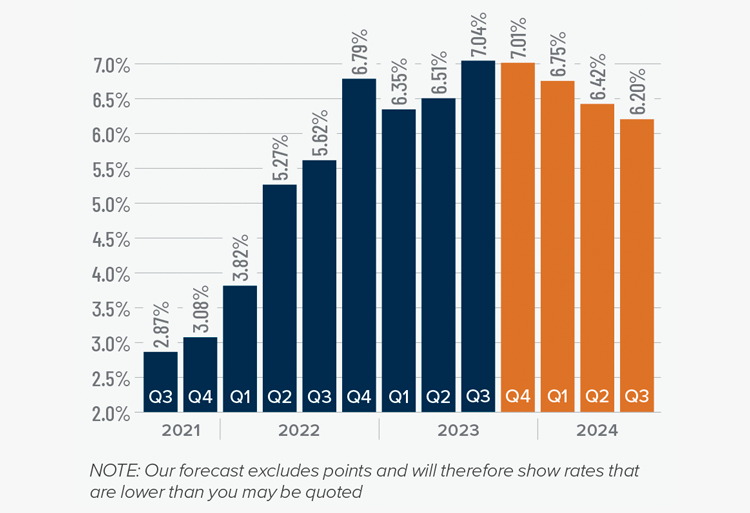
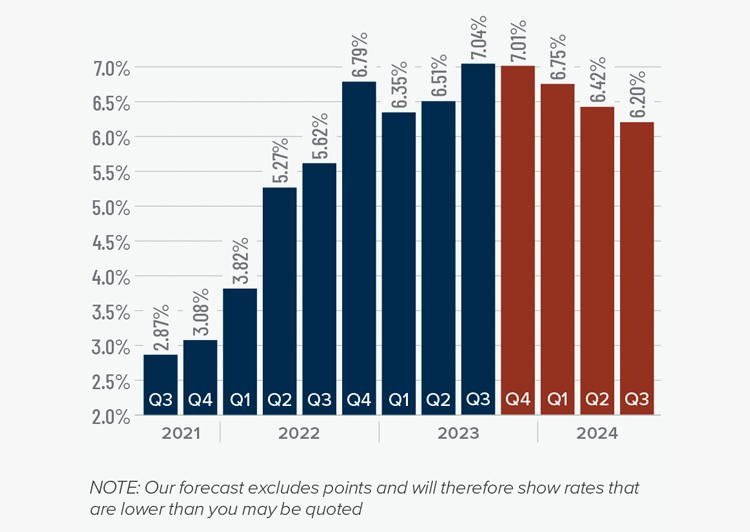
Mortgage rates continued trending higher in the third quarter of 2023 and are now at levels we have not seen since the fall of 2000. Mortgage rates are tied to the interest rate (yield) on 10-year treasuries, and they move in the opposite direction of the economy. Unfortunately for mortgage rates, the economy remains relatively buoyant, and though inflation is down significantly from its high, it is still elevated. These major factors and many minor ones are pushing Treasury yields higher, which is pushing mortgage rates up. Given the current position of the Federal Reserve, which intends to keep rates “higher for longer,” it is unlikely that home buyers will get much reprieve when it comes to borrowing costs any time soon.
With such a persistently positive economy, I have had to revise my forecast yet again. I now believe rates will hold at current levels before starting to trend down in the spring of next year.
Arizona Days on Market
❱ It took an average of 54 days for a home to sell in the third quarter of 2023. This was 20 more days than in the same quarter of 2022, but 11 fewer days compared to the second quarter of this year.
❱ Maricopa County was the tightest market in the region, with homes taking an average of 41 days to sell. Homes in Pinal and Yavapai counties took the longest time to sell at 61 days.
❱ All counties contained in this report saw average days on market rise from the same period in 2022, but market time fell across the board compared to the second quarter of this year.
❱ The greatest drop in market time compared to the second quarter of this year was in Pinal County, where it took 15 fewer days for a home to sell.

Conclusions
This speedometer reflects the state of the region’s real estate market using housing inventory, price gains, home sales, interest rates, and larger economic factors.
Lower pending and closed sales, in concert with falling list and sale prices, suggest that the market has shifted away from home sellers.
Although supply levels rose modestly from the previous quarter, they were down 42% from the same period in 2022, so the market cannot be described as oversupplied. This will function as some protection when it comes to home values, but prices likely won’t move much until mortgage rates start to drop, which won’t happen until early next year.
Home sales will still occur because there will always be households who have to move, but many buyers will be sidelined until rates come down, which means the housing market will remain somewhat static for the balance of the year.

Given these factors, the needle has been moved back into the balanced quadrant, with neither buyers nor sellers having the upper hand.
Q3 2023 Northern California Real Estate Market Update

The following analysis of select counties of the Northern California real estate market is provided by Windermere Real Estate. We hope that this information may assist you with making better-informed real estate decisions. For further information about the housing market in your area, please don’t hesitate to contact your Windermere Real Estate agent.
Regional Economic Overview
Total employment levels in the counties covered by this report fell year over year, with losses in all eight counties.
The regional unemployment rate rose to 4.3%, which was up from 3.3% in the third quarter of 2022, and is now at the highest level since January of 2022. By county, the lowest jobless rate was in Napa (3.6%) while the highest rate was in Shasta, where 5.1% of the labor force was looking for a job.
Northern California Home Sales
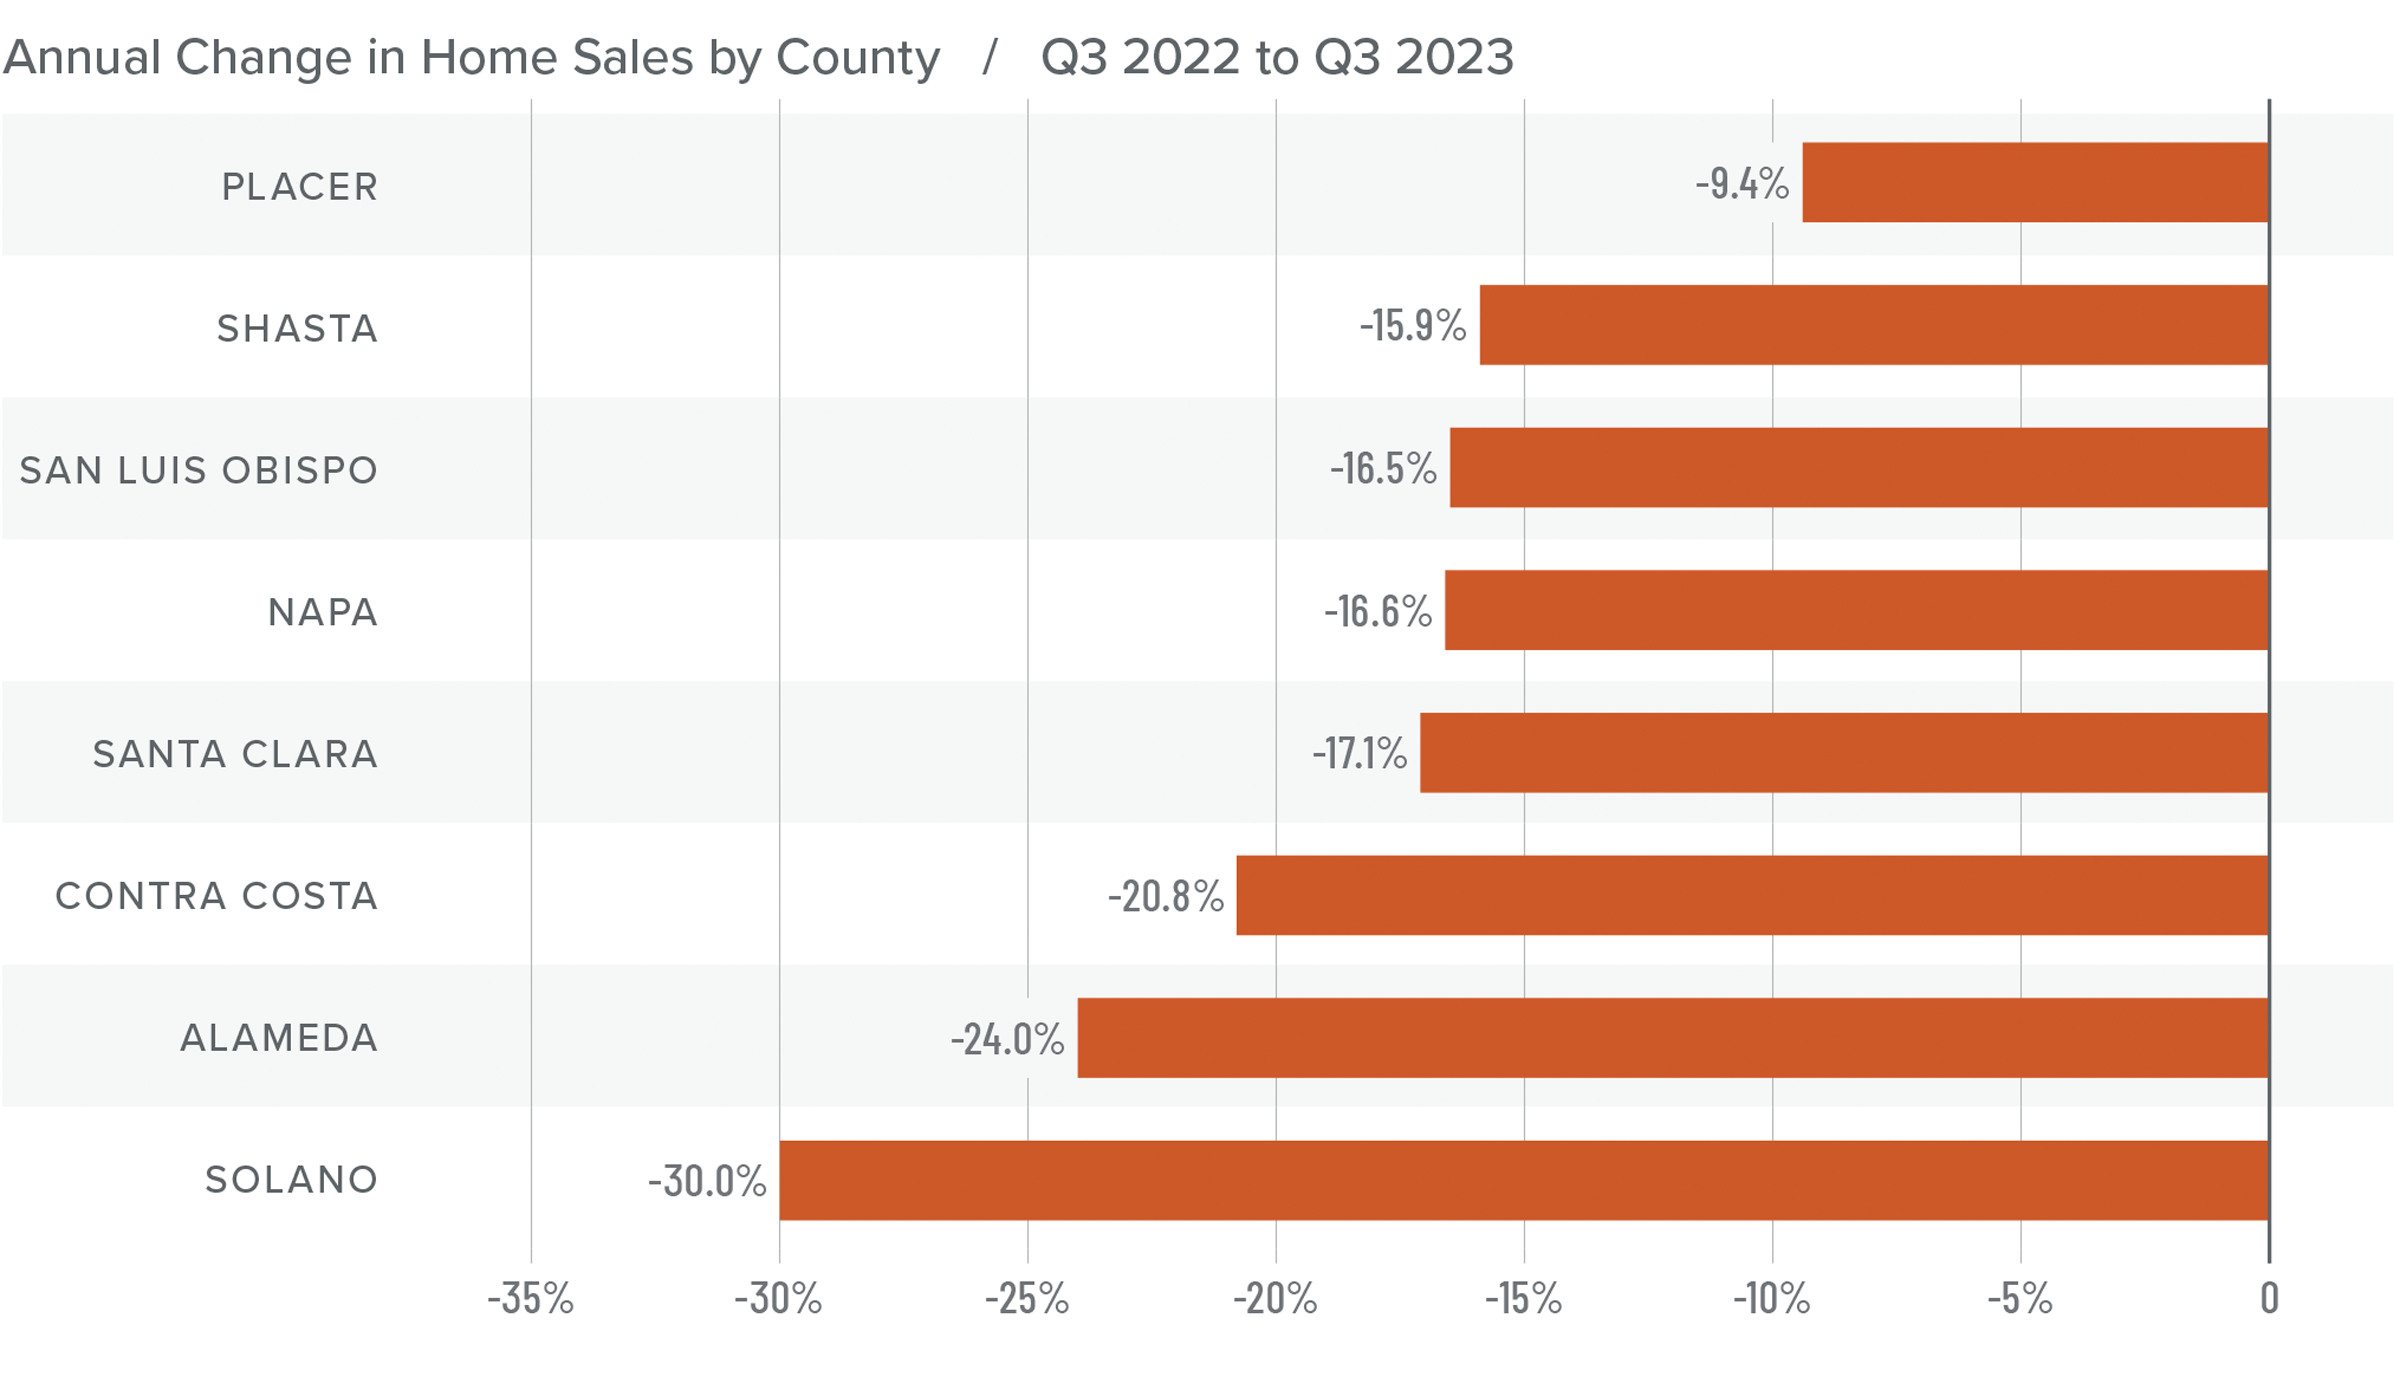
❱ In the third quarter of 2023, 9,284 homes sold, which was a 20% drop from the third quarter of 2022. Sales were 8.4% lower than in the second quarter of this year.
❱ Year over year, sales fell across the board. Only San Luis Obispo was able to grow sales from the previous quarter, but the increase was a very modest .9%.
❱ Quarter over quarter, listing inventory was up 16.2%. The average number of homes for sale was down 37.2% from the third quarter of 2022.
❱ Pending home sales were down 9.8% from the second quarter, suggesting that the market is likely going to continue cooling as we move through the balance of 2023.
Northern California Home Prices
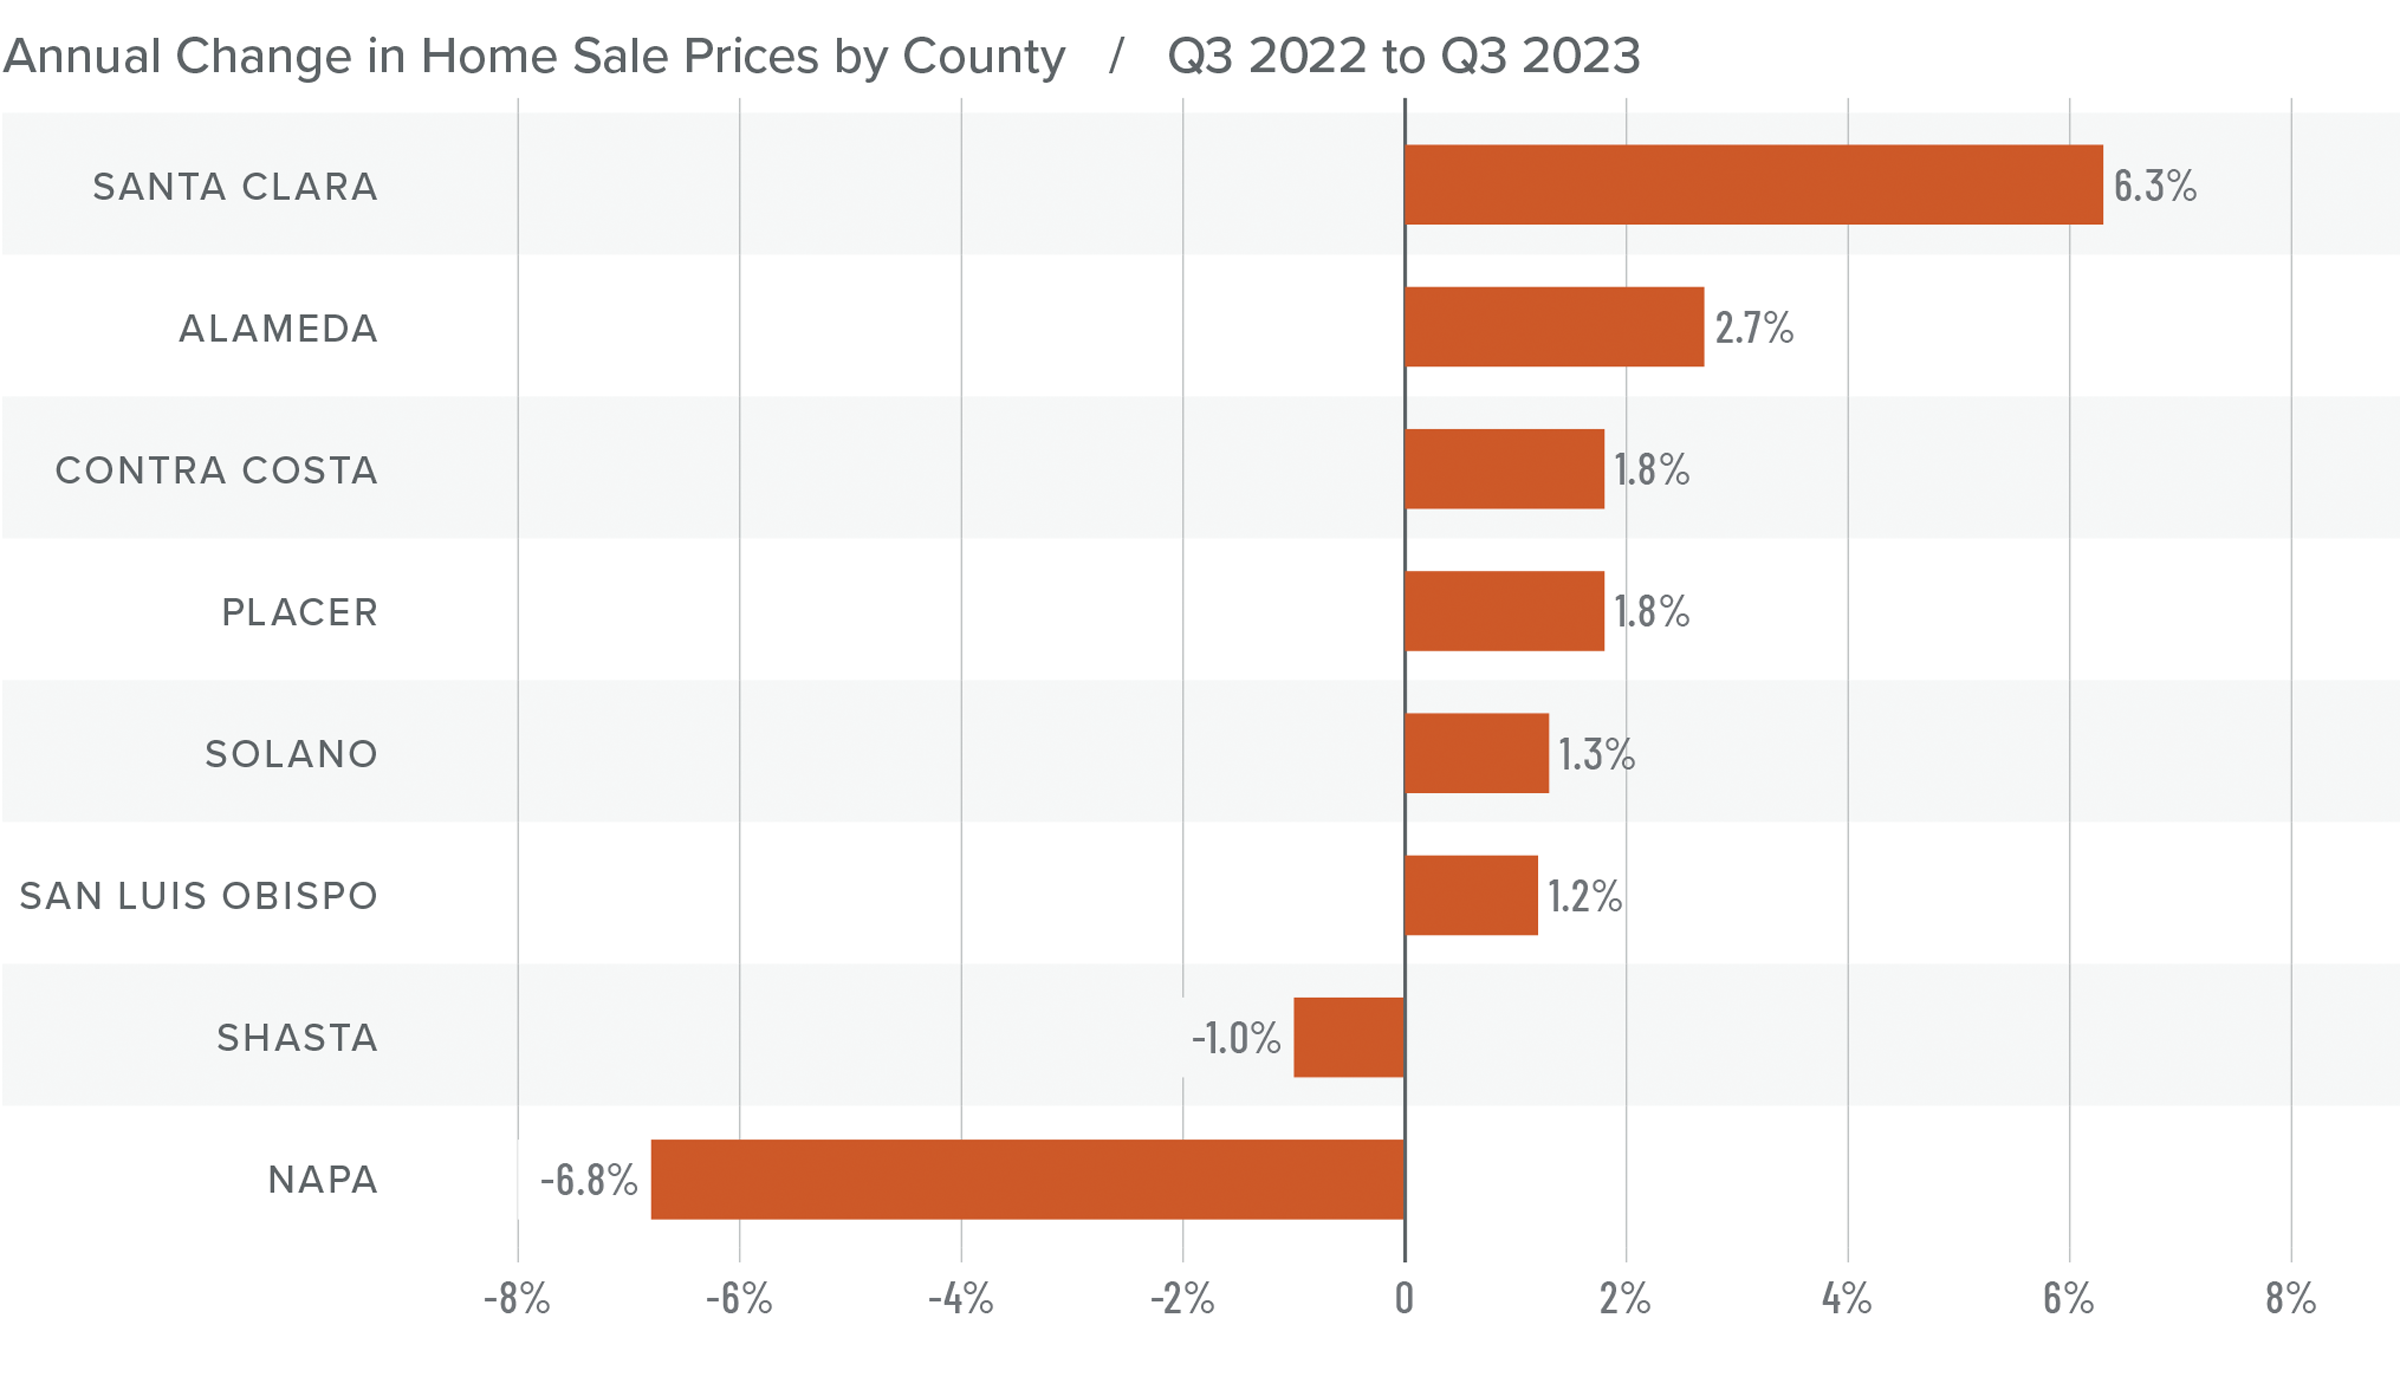
❱ Higher financing costs are impacting home sale prices, which dropped 1.2% from the second quarter of 2023 but were 3.9% higher than during the same period of 2022. The average sale price was $1.217 million.
❱ Median list prices in the region fell 3.8% from the second quarter, with double-digit declines in Placer and Napa counties. All counties except Santa Clara (which was flat) saw list prices fall quarter over quarter.
❱ Year over year, prices rose in all counties except Napa and Shasta. Relative to the second quarter, prices were higher in all market areas other than Contra Costa and San Luis Obispo counties.
❱ I believe that the worst of the price drops are behind us, but high mortgage rates are now having an impact.
Mortgage Rates
Mortgage rates continued trending higher in the third quarter of 2023 and are now at levels we have not seen since the fall of 2000. Mortgage rates are tied to the interest rate (yield) on 10-year treasuries, and they move in the opposite direction of the economy. Unfortunately for mortgage rates, the economy remains relatively buoyant, and though inflation is down significantly from its high, it is still elevated. These major factors and many minor ones are pushing Treasury yields higher, which is pushing mortgage rates up. Given the current position of the Federal Reserve, which intends to keep rates “higher for longer,” it is unlikely that home buyers will get much reprieve when it comes to borrowing costs any time soon.
With such a persistently positive economy, I have had to revise my forecast yet again. I now believe rates will hold at current levels before starting to trend down in the spring of next year.

Northern California Days on Market
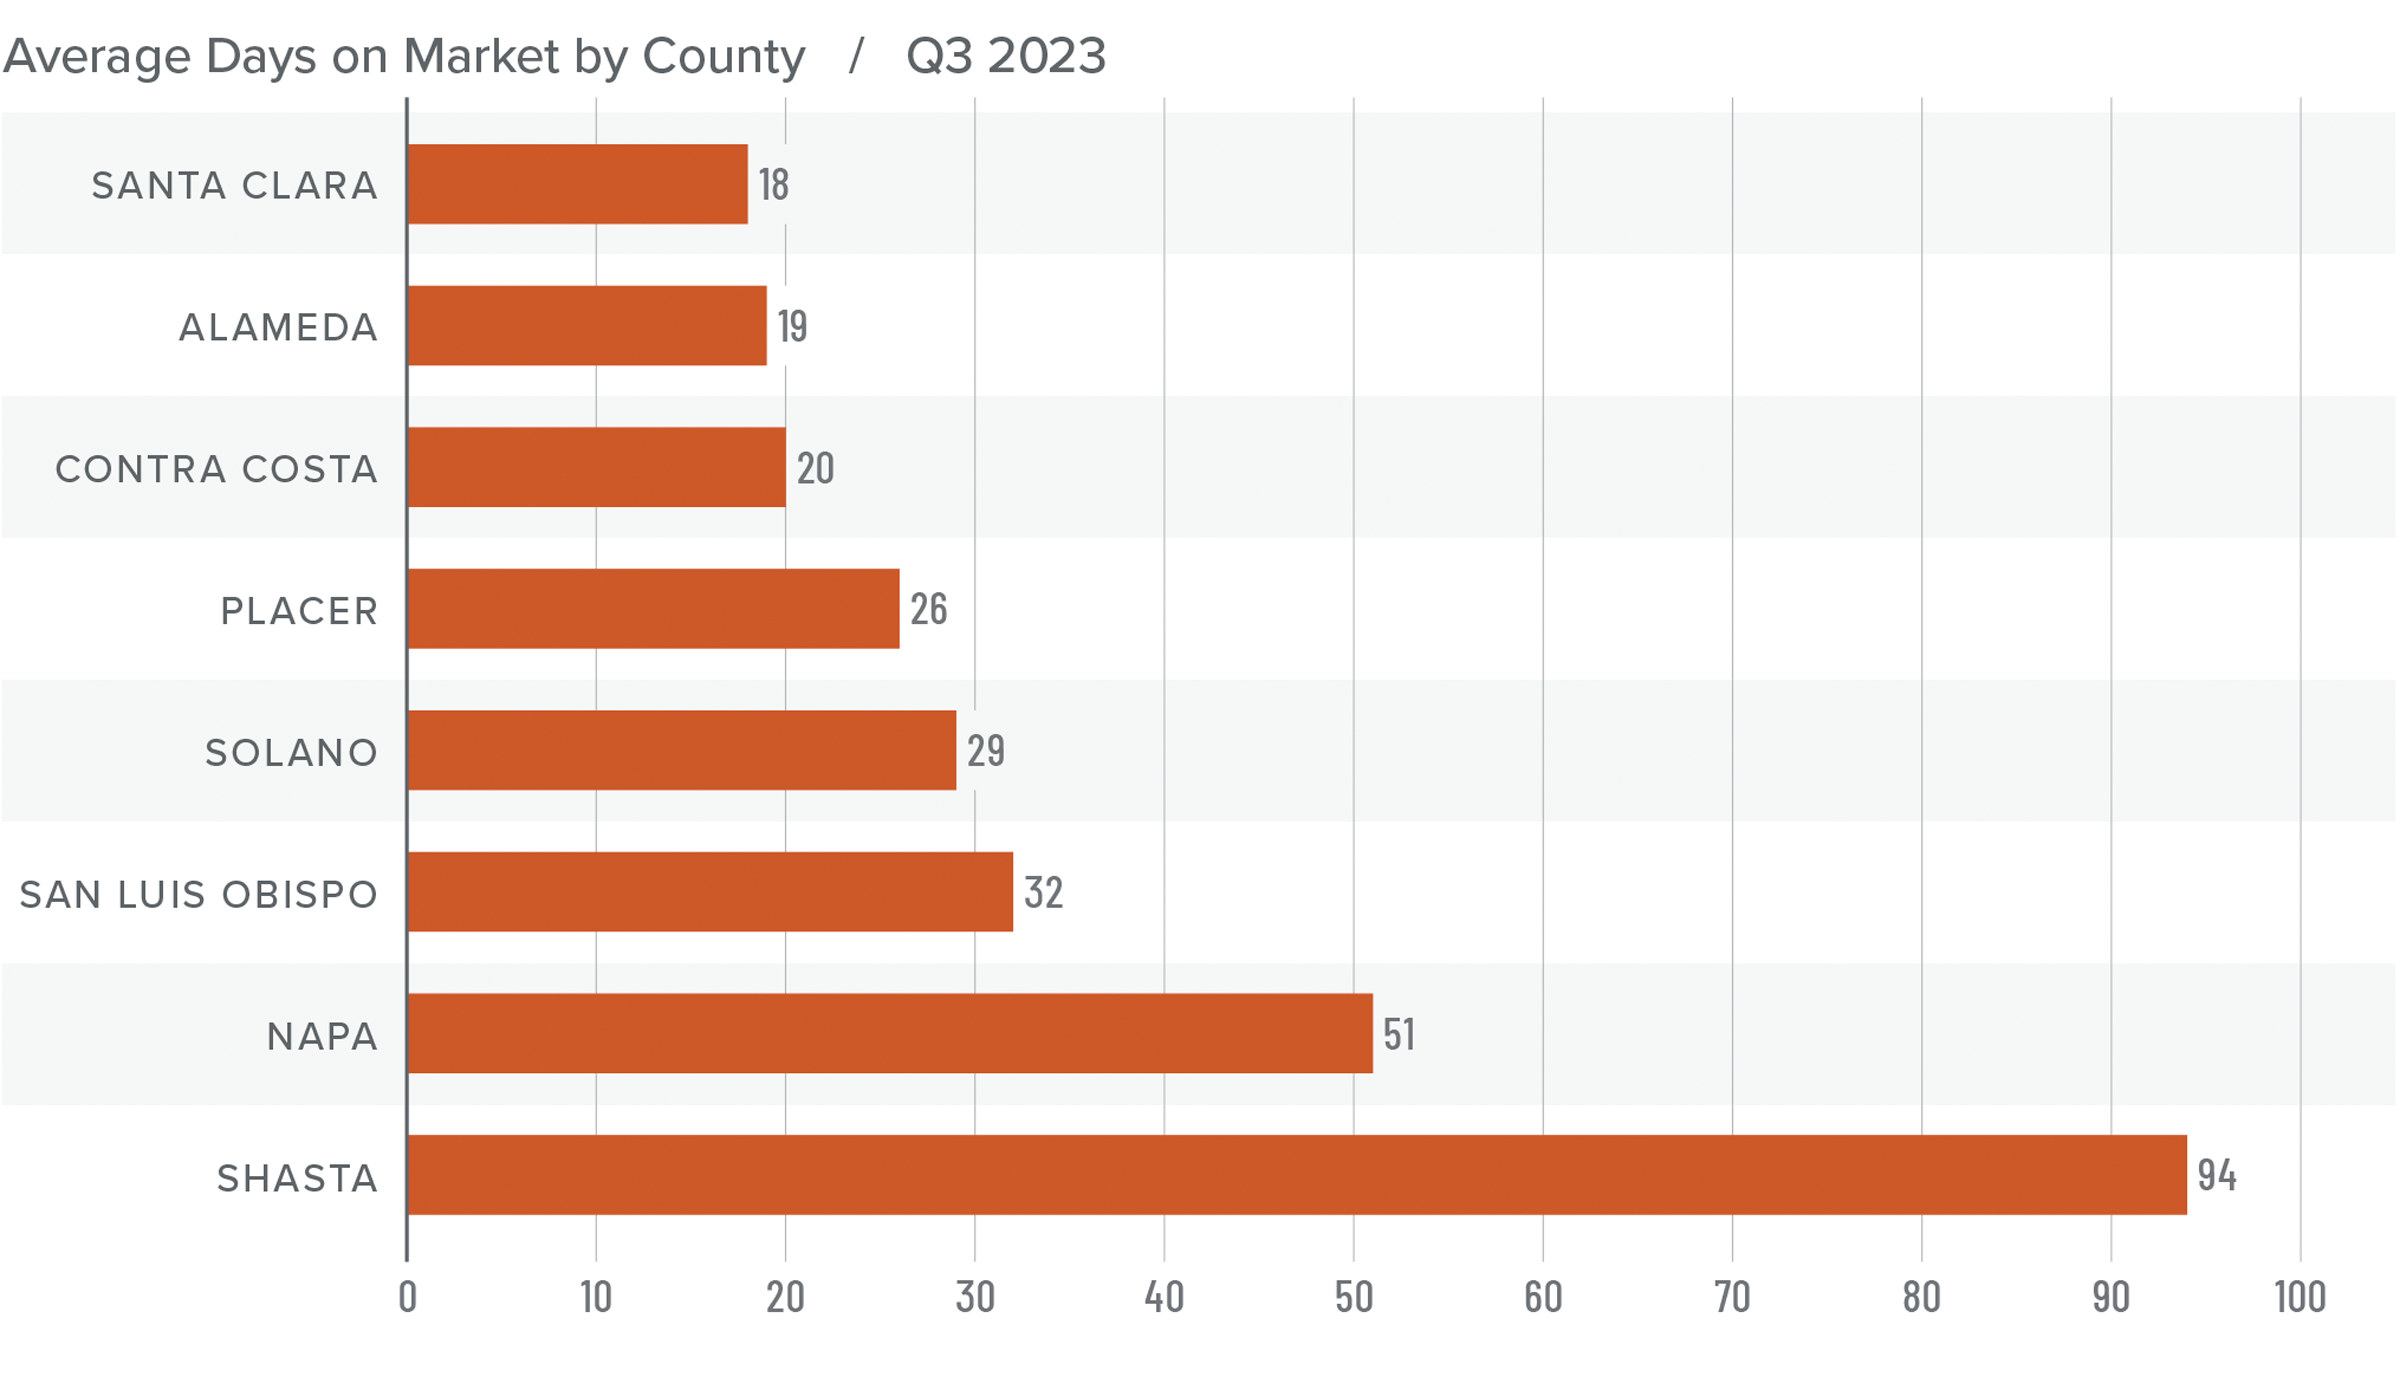
❱ The average time it took to sell a home in the Northern California counties in this report fell by one day compared to the third quarter of 2022.
❱ Year over year, the length of time it took to sell a home fell in five counties, but rose in Napa, Shasta, and San Luis Obispo counties. Compared to the second quarter of 2023, market time fell in Solano, Placer, and San Luis Obispo counties; was static in Alameda and Napa counties; and rose in Santa Clara and Shasta counties.
❱ In the third quarter, it took an average of 36 days to sell a home, which matched the rate in the second quarter of the year.
❱ Both year over year and quarter over quarter, homes sold the fastest in Santa Clara County and slowest in Shasta County.
Conclusions
This speedometer reflects the state of the region’s real estate market using housing inventory, price gains, home sales, interest rates, and larger economic factors.
With inventory levels rising in every county other than San Luis Obispo and Shasta, home buyers are generally seeing more choice in the region. Interestingly enough, this did not impact the length of time it took for homes to sell in the third quarter.
Home price growth has halted and, given that median list prices also fell from the second quarter of this year, sale prices aren’t expected to rise as we move through the final quarter of the year. This theory is also supported by the fact that mortgage rates have yet to peak, which will certainly act as a headwind across the market.
Given all the above, the needle stays in the balanced quadrant of the speedometer, but is tilted a little toward buyers given the modest decline of list prices and the increase in the number of homes for sale.
Q3 2023 Nevada Real Estate Market Update

The following analysis of select counties of the Nevada real estate market is provided by Windermere Real Estate. We hope that this information may assist you with making better-informed real estate decisions. For further information about the housing market in your area, please don’t hesitate to contact your Windermere Real Estate agent.
Regional Economic Overview
Though the pace of job growth in Clark County continues to cool, the market added 44,000 new jobs over the past 12 months, which represents a respectable growth rate of 4%.
The non-seasonally adjusted and seasonally adjusted unemployment rate in August was 6.1%. This was down .1% from August of 2022. Although the rate may be disconcerting given the national rate of 3.8%, it should be noted that the jobless rate rose more as a function of a growing labor force. The local labor force rose 2.7% while the national labor force only increased 1.9%.
My updated employment forecast for the Las Vegas metro area shows employment growth continuing to taper. Growth in 2023 will be up 3.4%, and my preliminary 2024 forecast suggests that job growth will slow to around 1.8%.
Nevada Home Sales
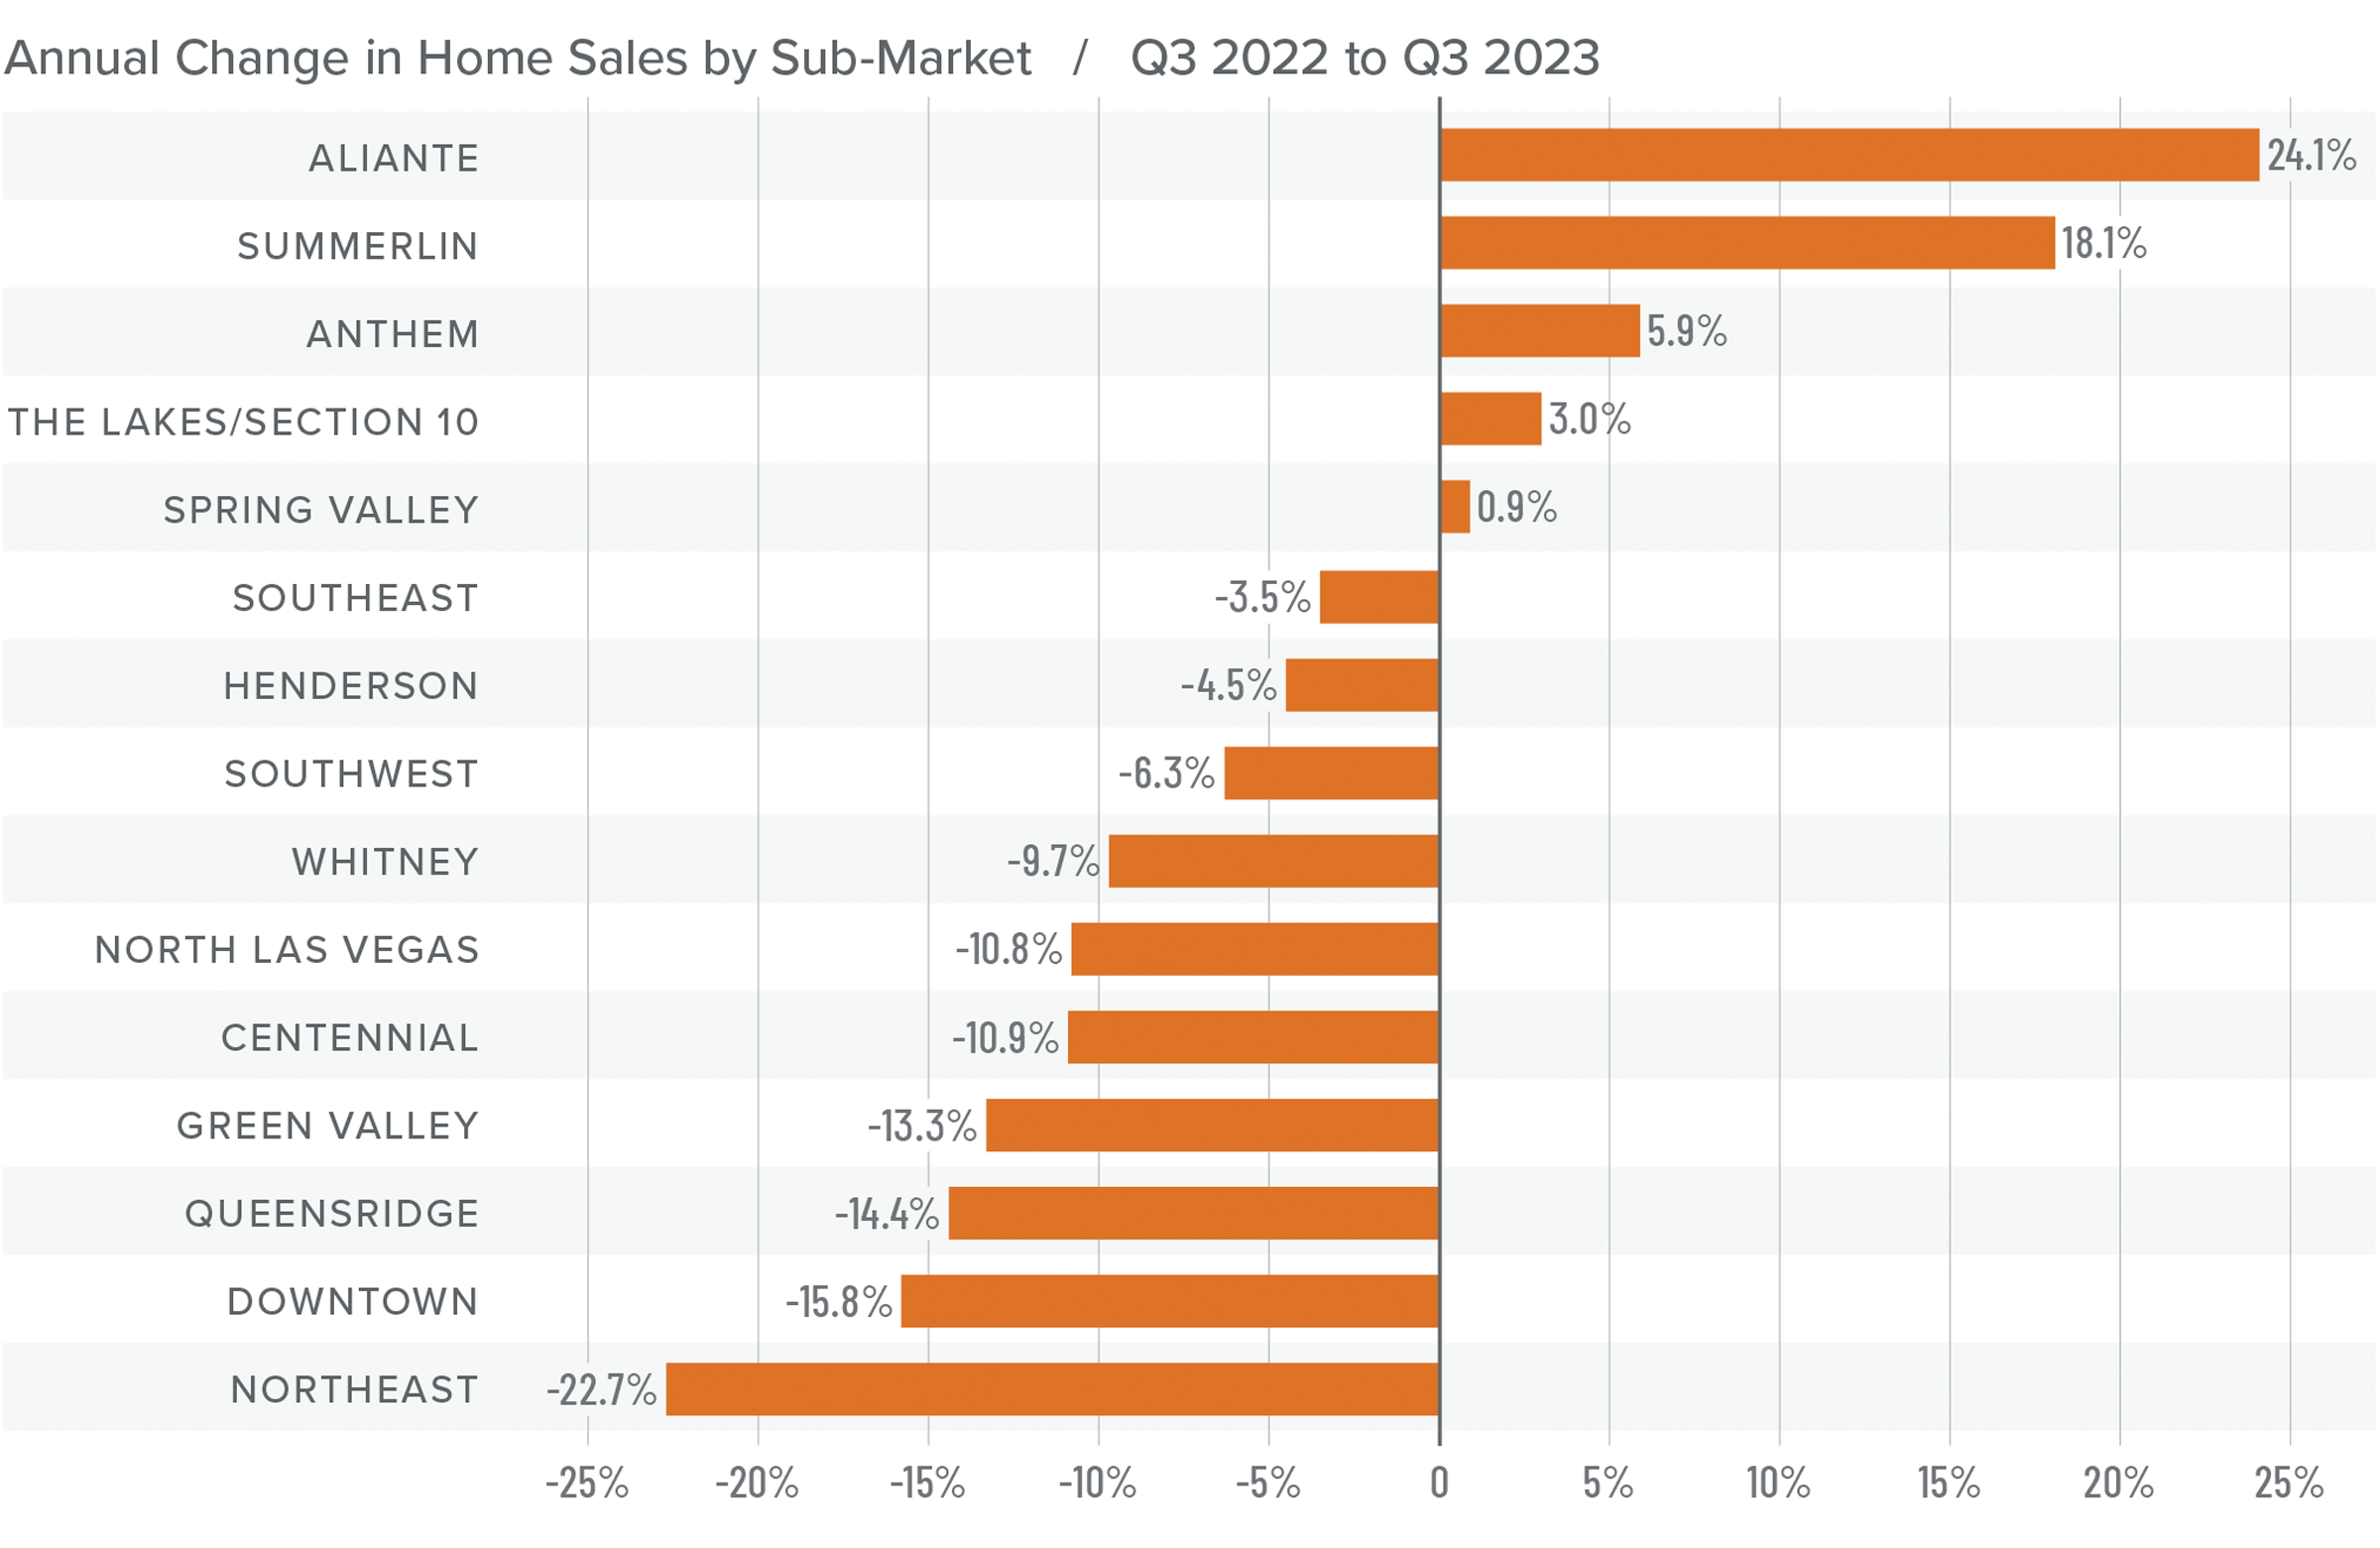
❱ A total of 6,011 homes sold in the third quarter, which was a drop of 6% compared to the same period in 2022. Sales were down 10.8% from the second quarter of 2023.
❱ Compared to the third quarter of 2022, sales fell in a majority of the markets covered by this report. Compared to the second quarter of this year, sales fell in all markets other than the Spring Valley and Aliante neighborhoods, where sales rose 3.6% and 20%, respectively.
❱ Listing activity was flat versus the second quarter of the year, but the number of homes for sale was down more than 54% year over year.
❱ Pending sales, which are an indicator of future closings, fell 13.1% compared to the second quarter, suggesting that sales activity may not grow in the upcoming quarter.
Nevada Home Prices
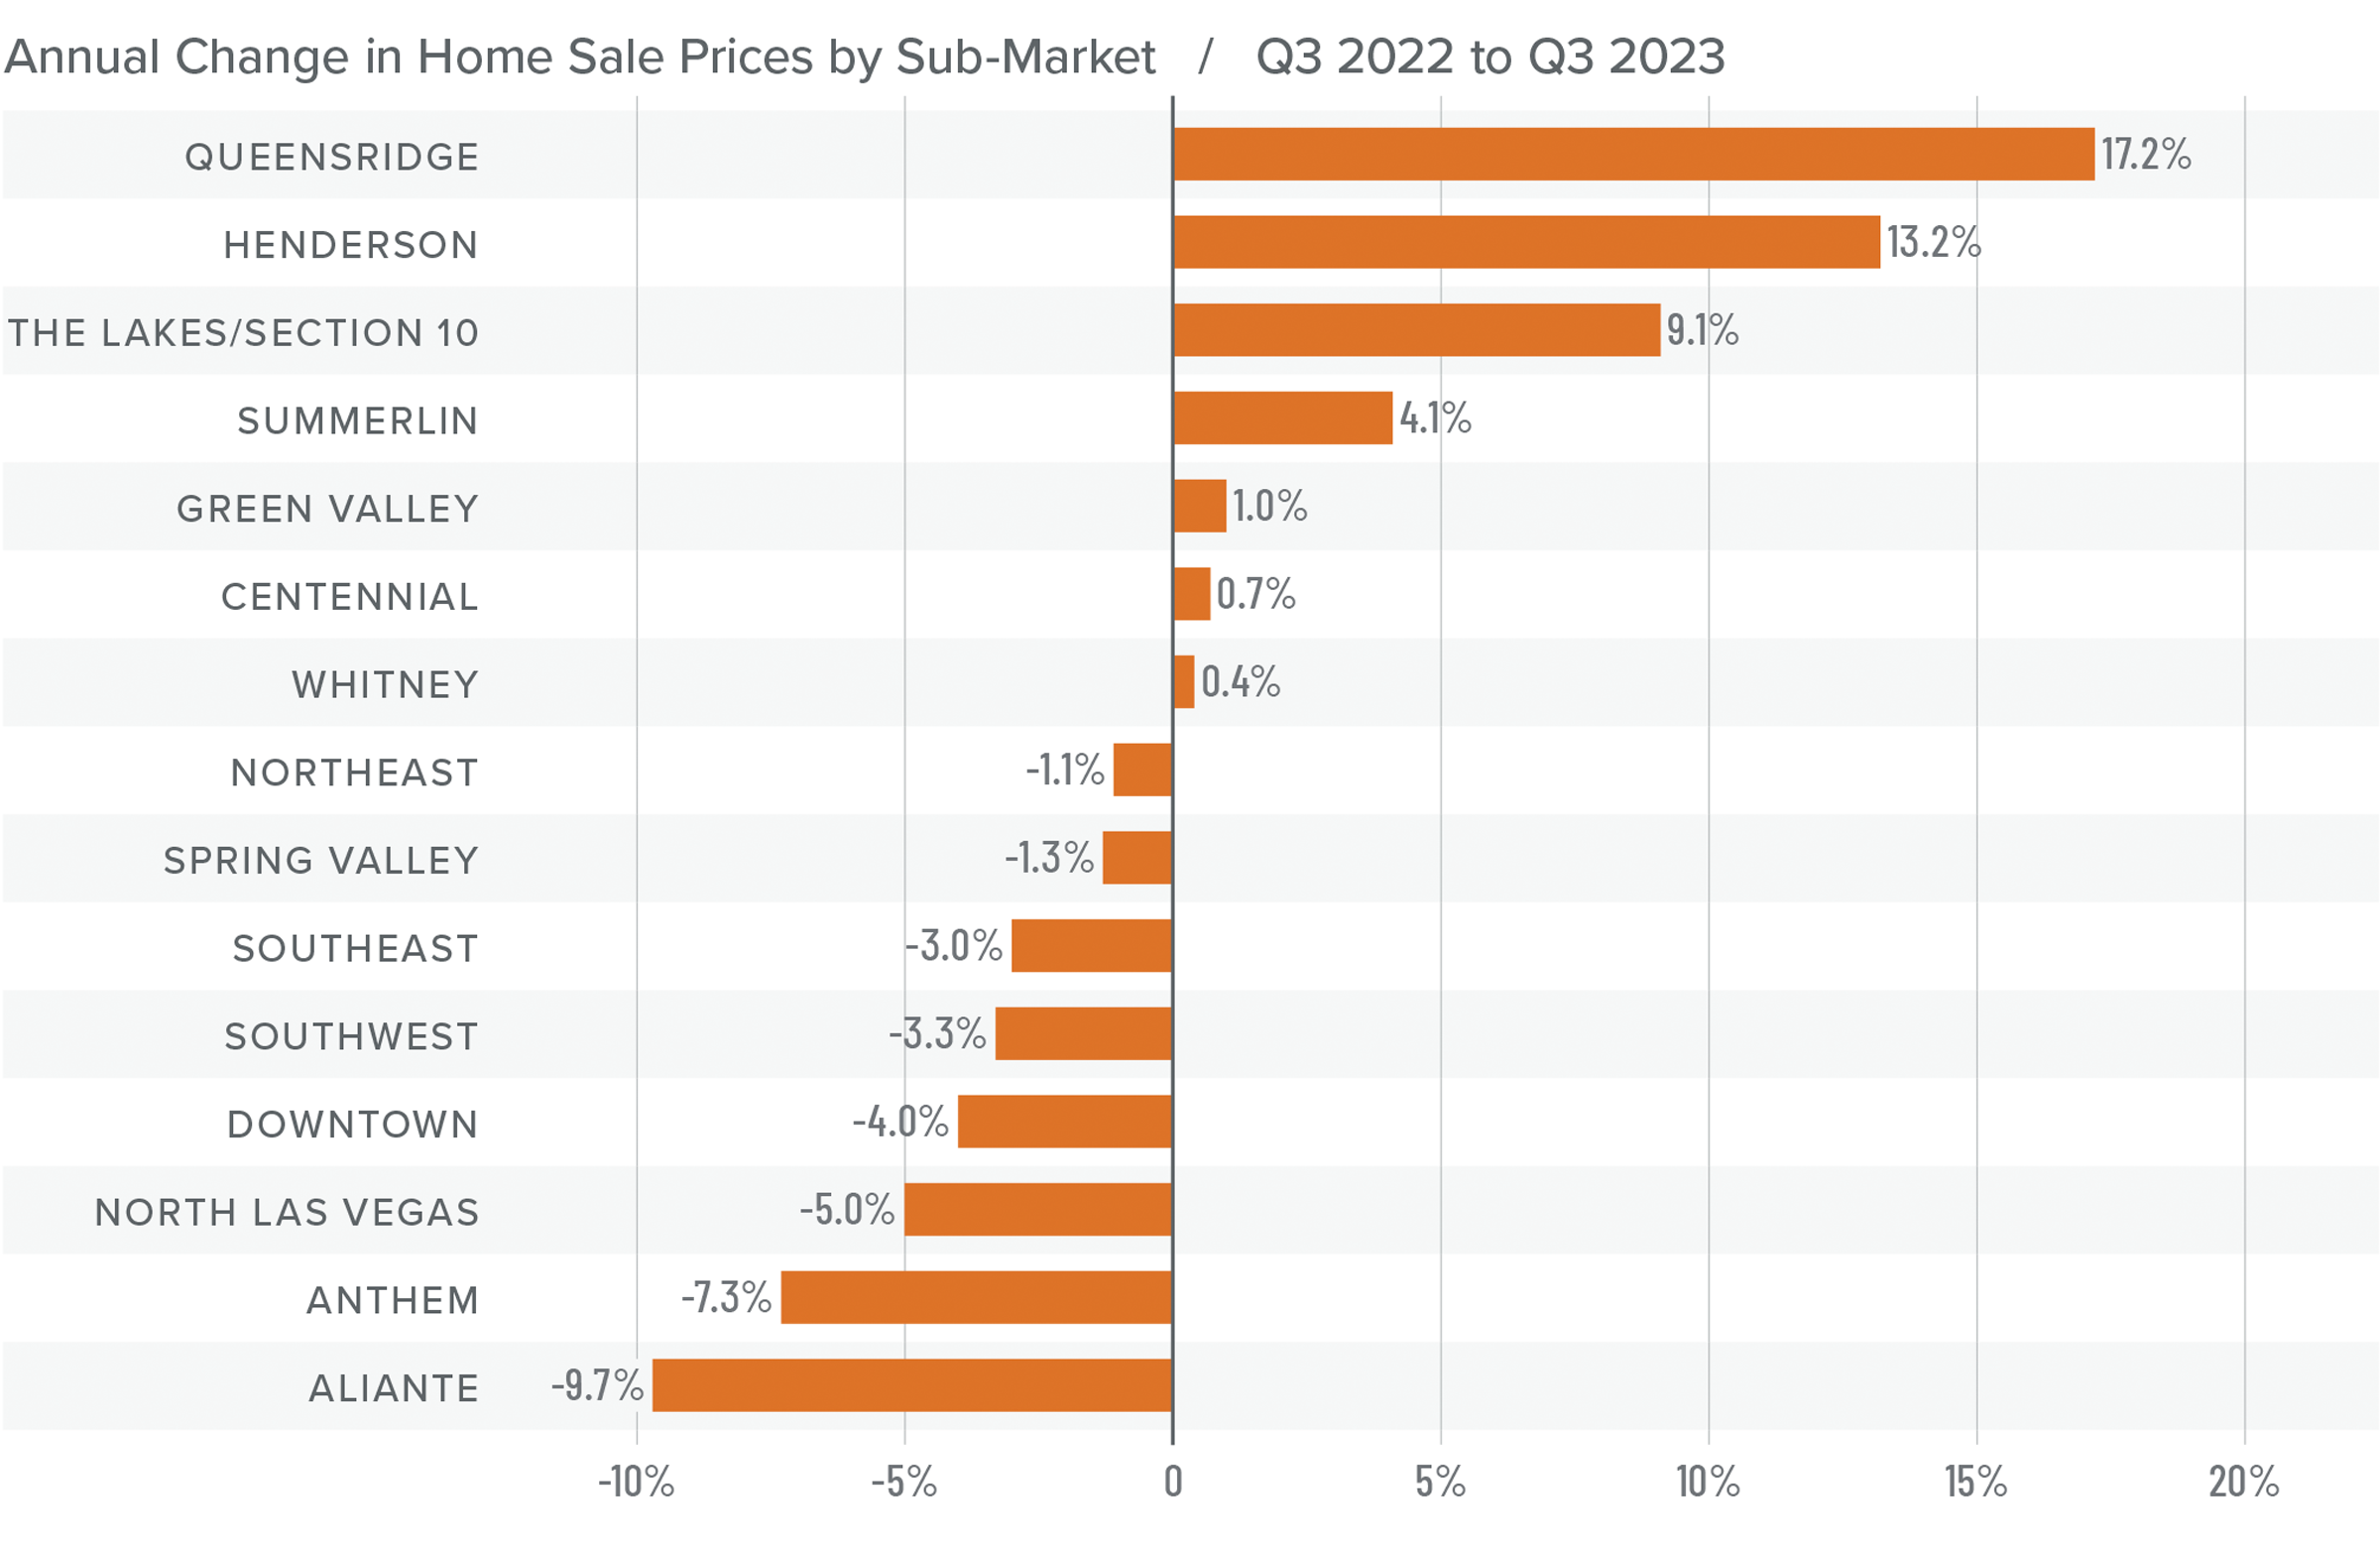
❱ Home prices fell .3% year over year but were .6% higher than in the second quarter of 2023. The average home sale price in the area was $478,355.
❱ Compared to the second quarter, more than half of the neighborhoods saw a drop in median list prices, which are a leading indicator of the housing market. However, increases in the remaining neighborhoods made aggregate list prices essentially flat.
❱ Year over year, prices fell in eight areas but rose in seven, with significant increases in the Queensridge and Henderson neighborhoods. Compared to the second quarter of this year, prices were up in every market other than Downtown, Aliante, Southeast Las Vegas, and Spring Valley.
❱ Lower list prices and flat price growth may suggest that the market is starting to react to higher mortgage rates. I don’t expect sale prices to move much for the balance of this year, but limited inventory should continue to support current values.
Mortgage Rates
Mortgage rates continued trending higher in the third quarter of 2023 and are now at levels we have not seen since the fall of 2000. Mortgage rates are tied to the interest rate (yield) on 10-year treasuries, and they move in the opposite direction of the economy. Unfortunately for mortgage rates, the economy remains relatively buoyant, and though inflation is down significantly from its high, it is still elevated. These major factors and many minor ones are pushing Treasury yields higher, which is pushing mortgage rates up. Given the current position of the Federal Reserve, which intends to keep rates “higher for longer,” it is unlikely that home buyers will get much reprieve when it comes to borrowing costs any time soon.
With such a persistently positive economy, I have had to revise my forecast yet again. I now believe rates will hold at current levels before starting to trend down in the spring of next year.
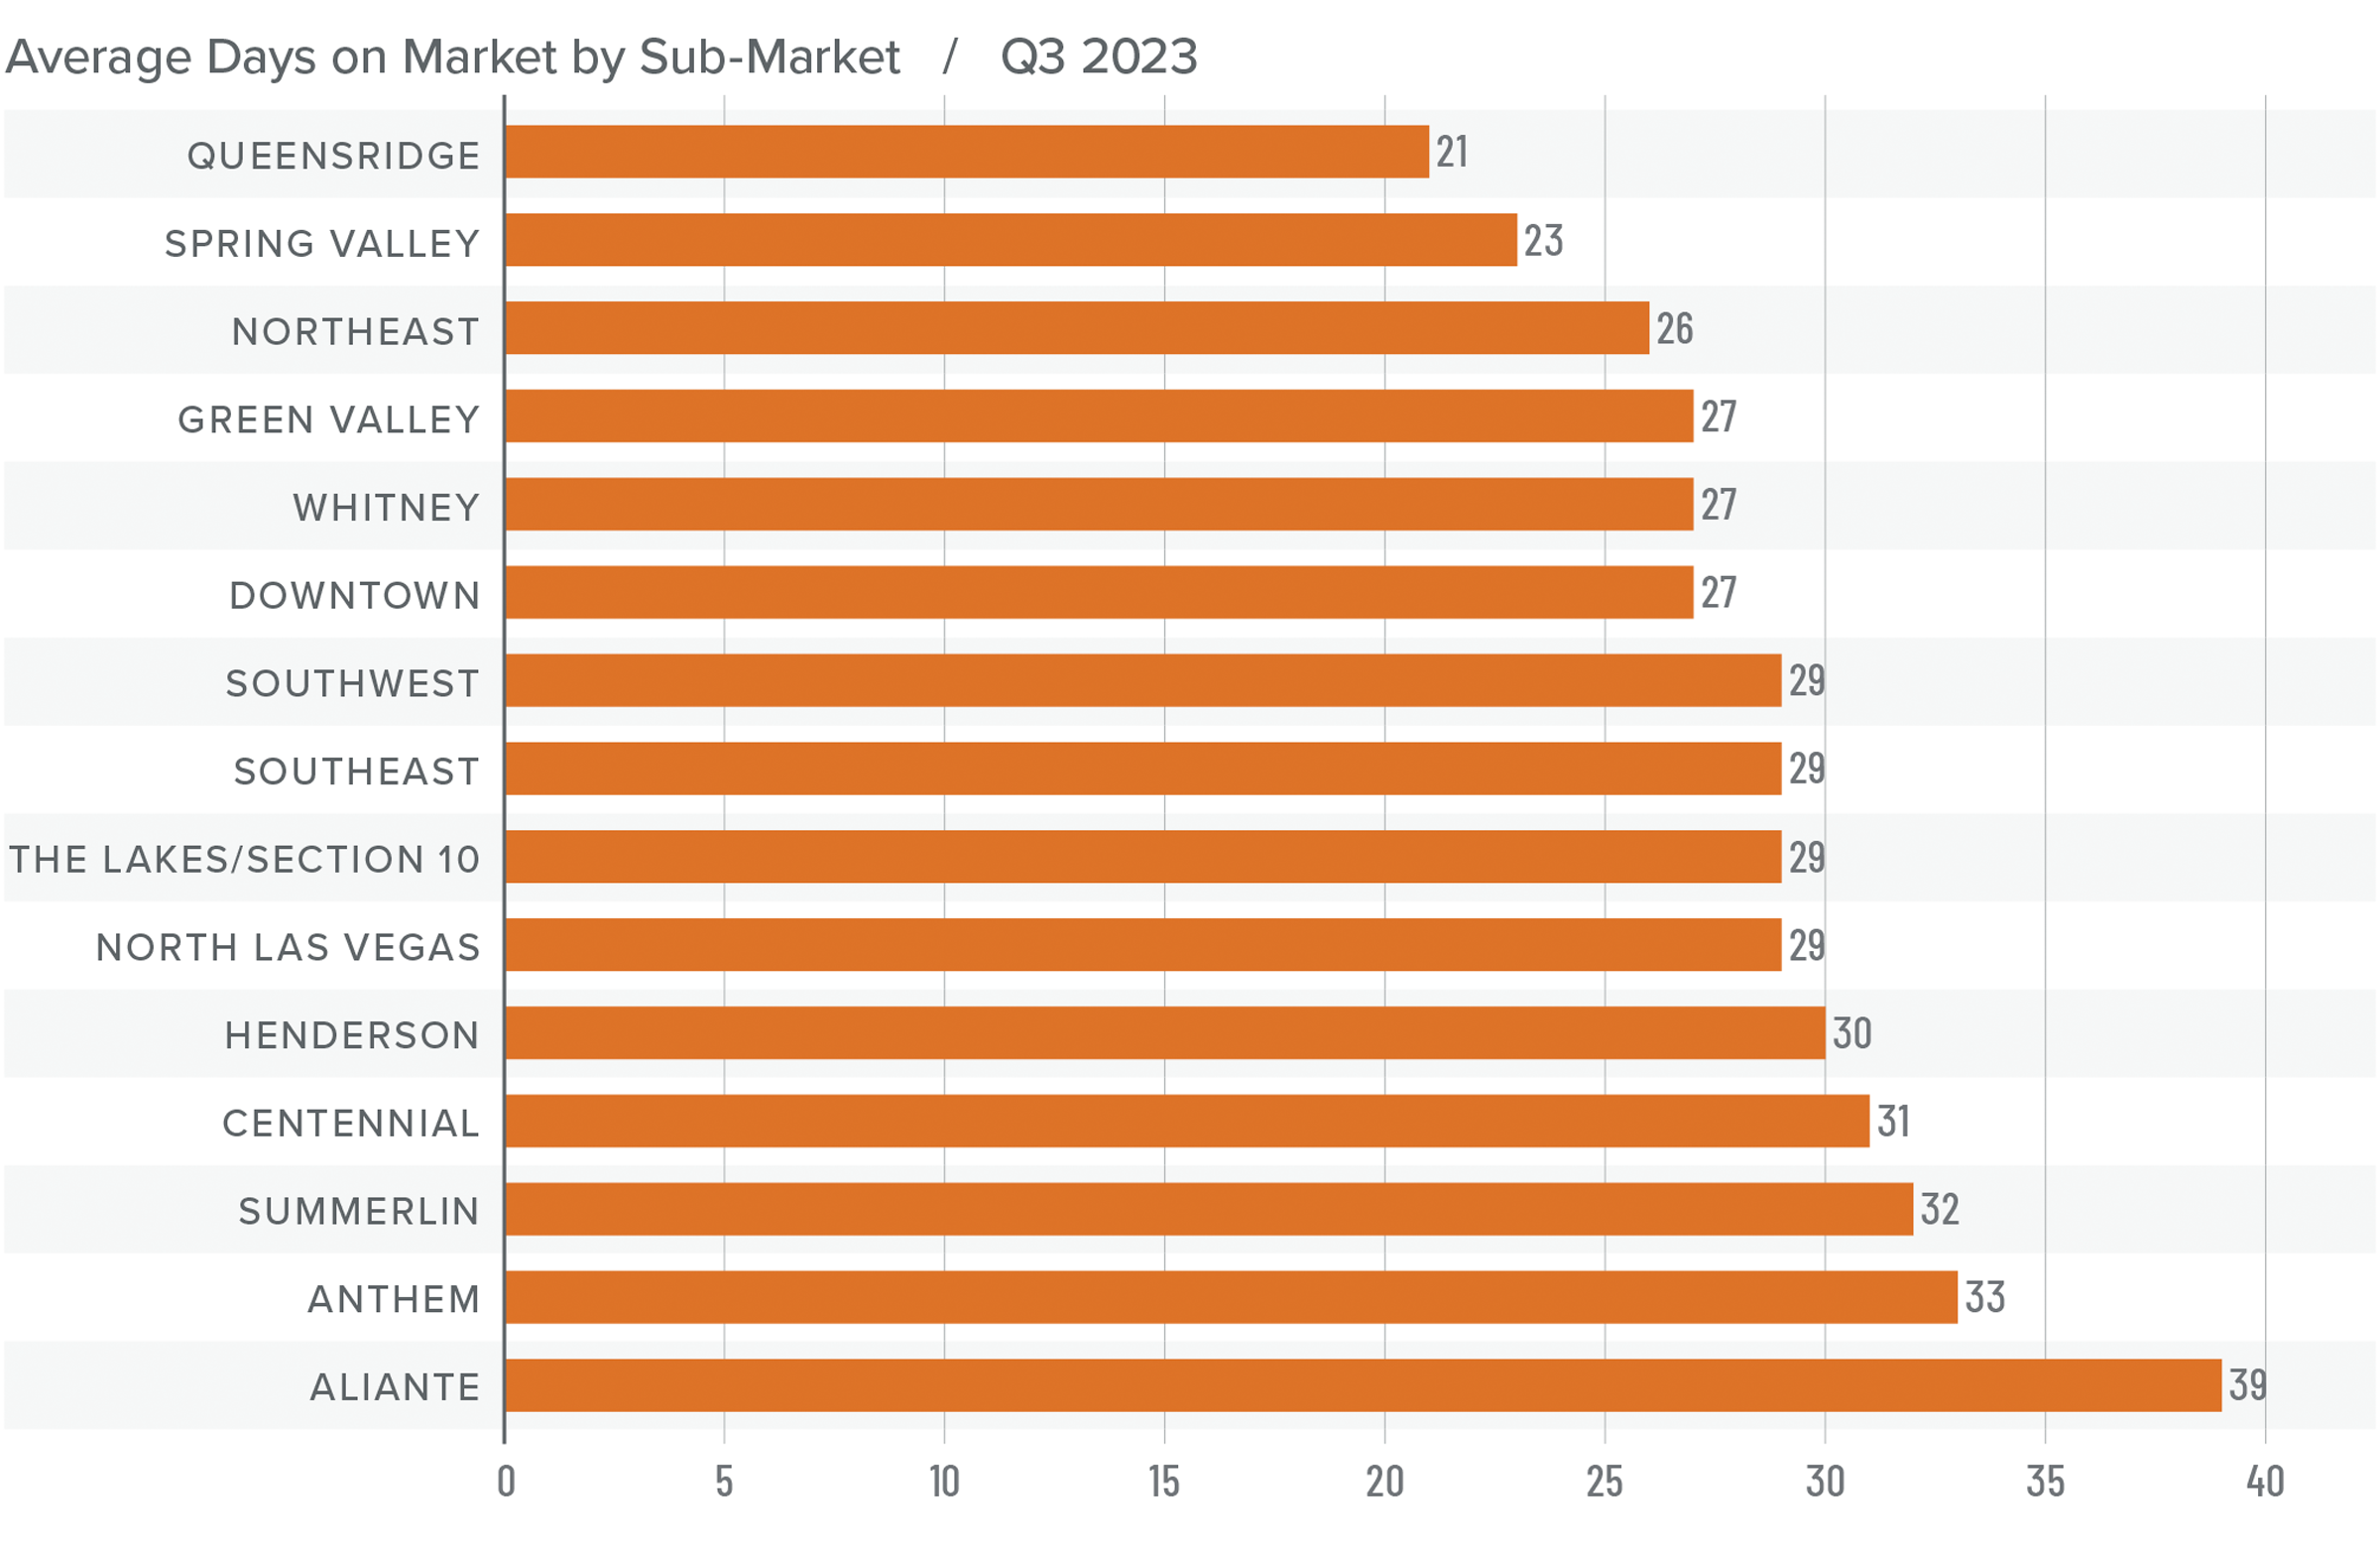
Nevada Days on Market
❱ The average time it took to sell a home in the region rose four days from the third quarter of 2022.
❱ It took an average of 29 days to sell a home in the third quarter, which was 13 fewer days than it took in the second quarter of 2023.
❱ Days on market rose in all neighborhoods except Queensridge and Spring Valley compared to the same period in 2022. However, average market time fell in every neighborhood compared to the second quarter of this year.
❱ Low inventory levels combined with buyers who were likely rushing to lock in mortgage rates that were still in the 6% range at the start of the quarter clearly created competitive market conditions.
Conclusions
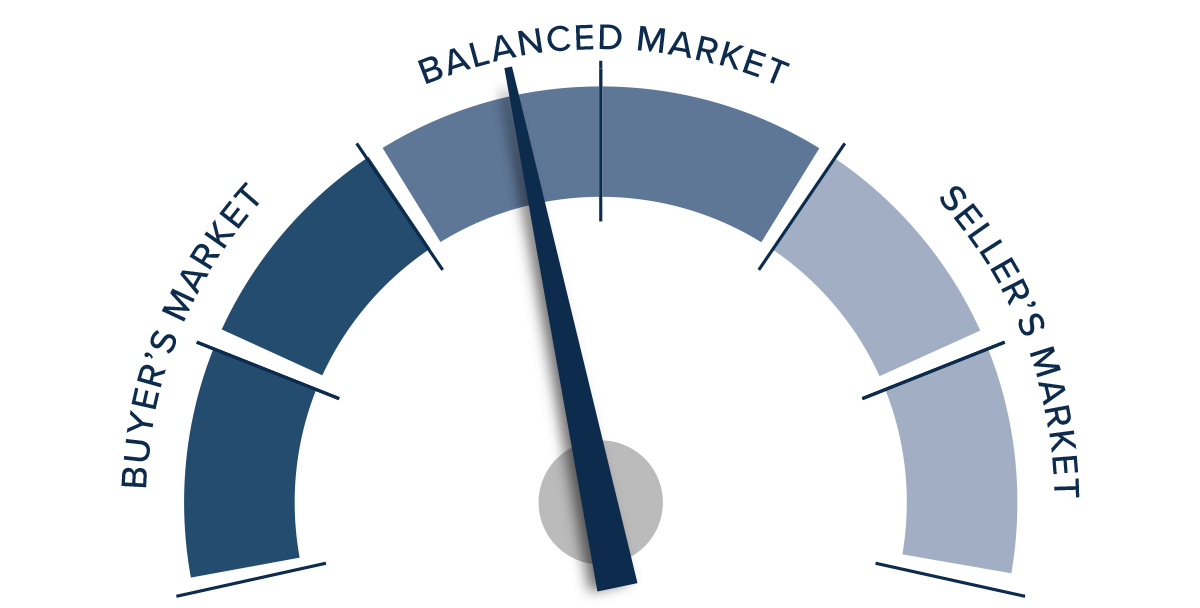
This speedometer reflects the state of the region’s real estate market using housing inventory, price gains, home sales, interest rates, and larger economic factors.
With pending and closed sales lower than earlier in the year and list prices not rising, one might infer that the market is starting to shift in favor of home buyers, but it’s uncertain this is the case.
In the second quarter market update it was suggested that the market was essentially in balance, albeit very slightly tilted toward sellers. Today, there is still a balance between buyers and sellers: limited inventory favors sellers, but lack of price growth favors home buyers (even if they are faced with significantly higher mortgage rates).

As such, the needle stays in the balanced quadrant, but it’s moved from very modestly favoring sellers to a more neutral position.
Q3 2023 Utah Real Estate Market Update

The following analysis of select counties of the Utah real estate market is provided by Windermere Real Estate. We hope that this information may assist you with making better-informed real estate decisions. For further information about the housing market in your area, please don’t hesitate to contact your Windermere Real Estate agent.
Regional Economic Overview
After picking up in the second quarter of this year, year-over-year employment growth has pulled back again. Utah added 39,000 jobs over the past 12 months, which represents an annual growth rate of 2.3%. This is the lowest pace of job gains since the pandemic started. Job growth was led by the Salt Lake City metro area, where employment rose 2.7%. This was followed by the Ogden and Provo metro areas, where employment rose 2.4% and 1.7%, respectively.
Utah’s unemployment rate in August was 2.5%, which is up .1% year over year. At the county level, the lowest jobless rate was in Morgan County (2.5%) and the highest was in Weber County, where 3.1% of the workforce were without jobs. In aggregate, the unemployment rate within the counties contained in this report was 3%.
Utah Home Sales
❱ In the third quarter of 2023, 6,675 homes sold in the areas covered by this report. This was down 9.5% compared to the third quarter of 2022 and was 5.7% lower than in the second quarter of this year.
❱ Although total sales volumes have fallen, they rose in Wasatch, Summit, and Morgan counties compared the third quarter of 2022. These same three counties also saw sales grow between the second and third quarters of this year.
❱ As sales volumes fell, listing activity rose 28.7% compared to the second quarter of 2023. Clearly, more choice in the market was not enough to tempt buyers who were also faced with significantly higher financing costs.
❱ Pending sales fell 8.9% from the second quarter, suggesting that closings in the fourth quarter may also be lackluster.

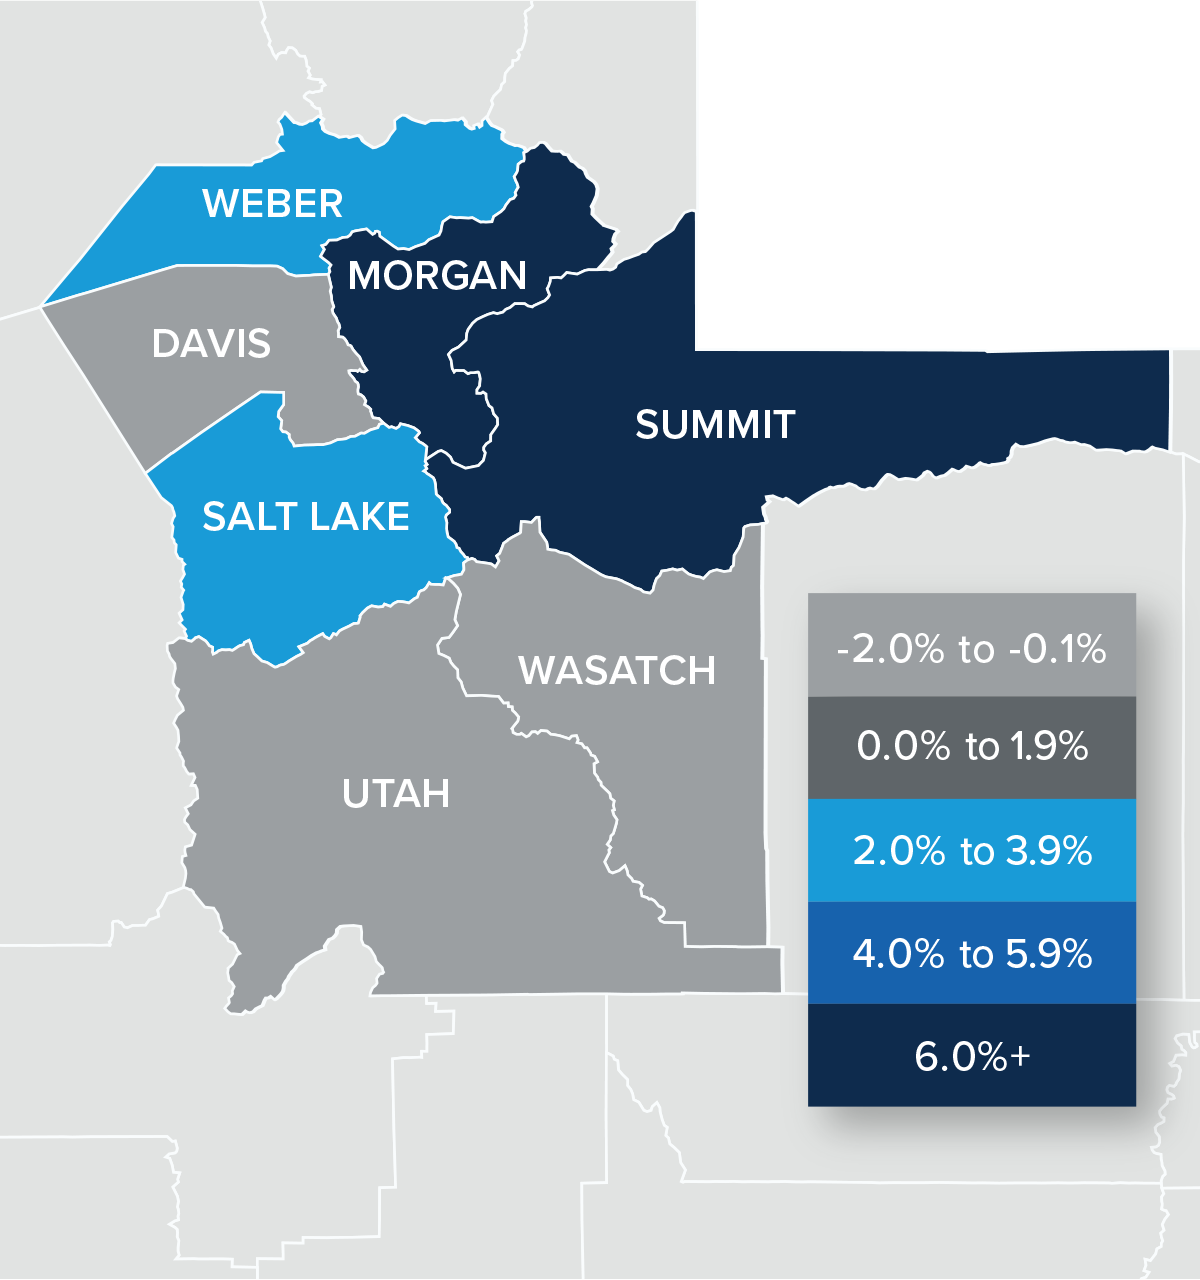
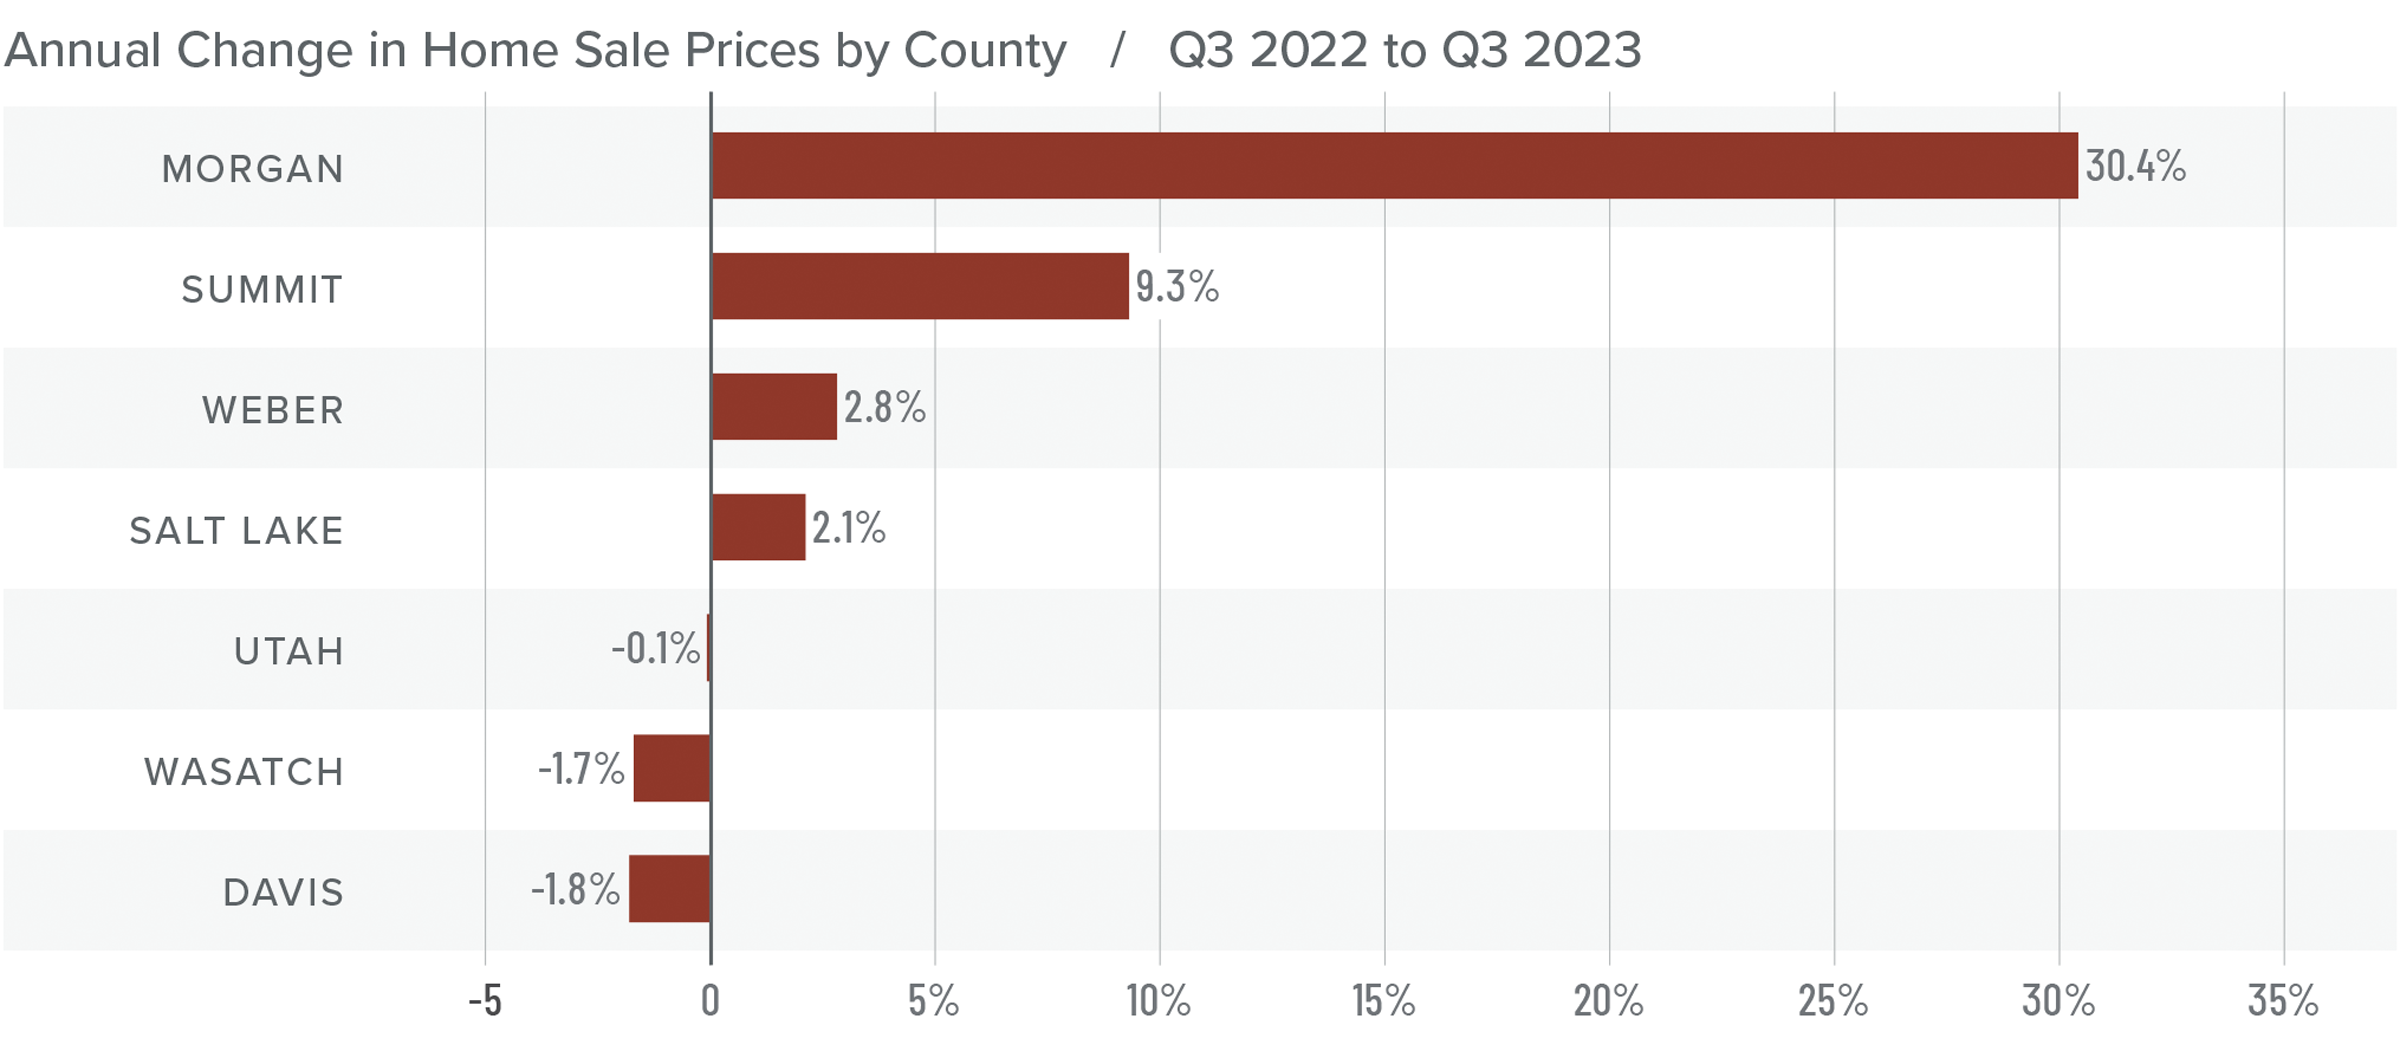
Utah Home Prices
❱ The average sale price grew 4% from the same time in 2022 to $651,913. Prices were also 3.8% higher than in the second quarter of 2023.
❱ Regionally, median list prices in the third quarter were flat compared to the second quarter of the year. However, asking prices were higher in Wasatch, Summit, and Morgan counties.
❱ Year over year, prices rose in four counties but fell in three. With just 28 sales in the quarter, Morgan County had a significant price increase, but it’s such a small market that sizeable price swings are not unusual. Compared to the second quarter of 2023, prices rose in all counties except Davis and Summit, where prices fell 1.7% and 13.8%, respectively.
❱ Price growth has been slowing, which is to be expected given the significant rise in mortgage rates. I don’t expect to see much in the way of price growth for the balance of the year due to both higher financing costs and more choice in the market.
Mortgage Rates
Mortgage rates continued trending higher in the third quarter of 2023 and are now at levels we have not seen since the fall of 2000. Mortgage rates are tied to the interest rate (yield) on 10-year treasuries, and they move in the opposite direction of the economy. Unfortunately for mortgage rates, the economy remains relatively buoyant, and though inflation is down significantly from its high, it is still elevated. These major factors and many minor ones are pushing Treasury yields higher, which is pushing mortgage rates up. Given the current position of the Federal Reserve, which intends to keep rates “higher for longer,” it is unlikely that home buyers will get much reprieve when it comes to borrowing costs any time soon.
With such a persistently positive economy, I have had to revise my forecast yet again. I now believe rates will hold at current levels before starting to trend down in the spring of next year.

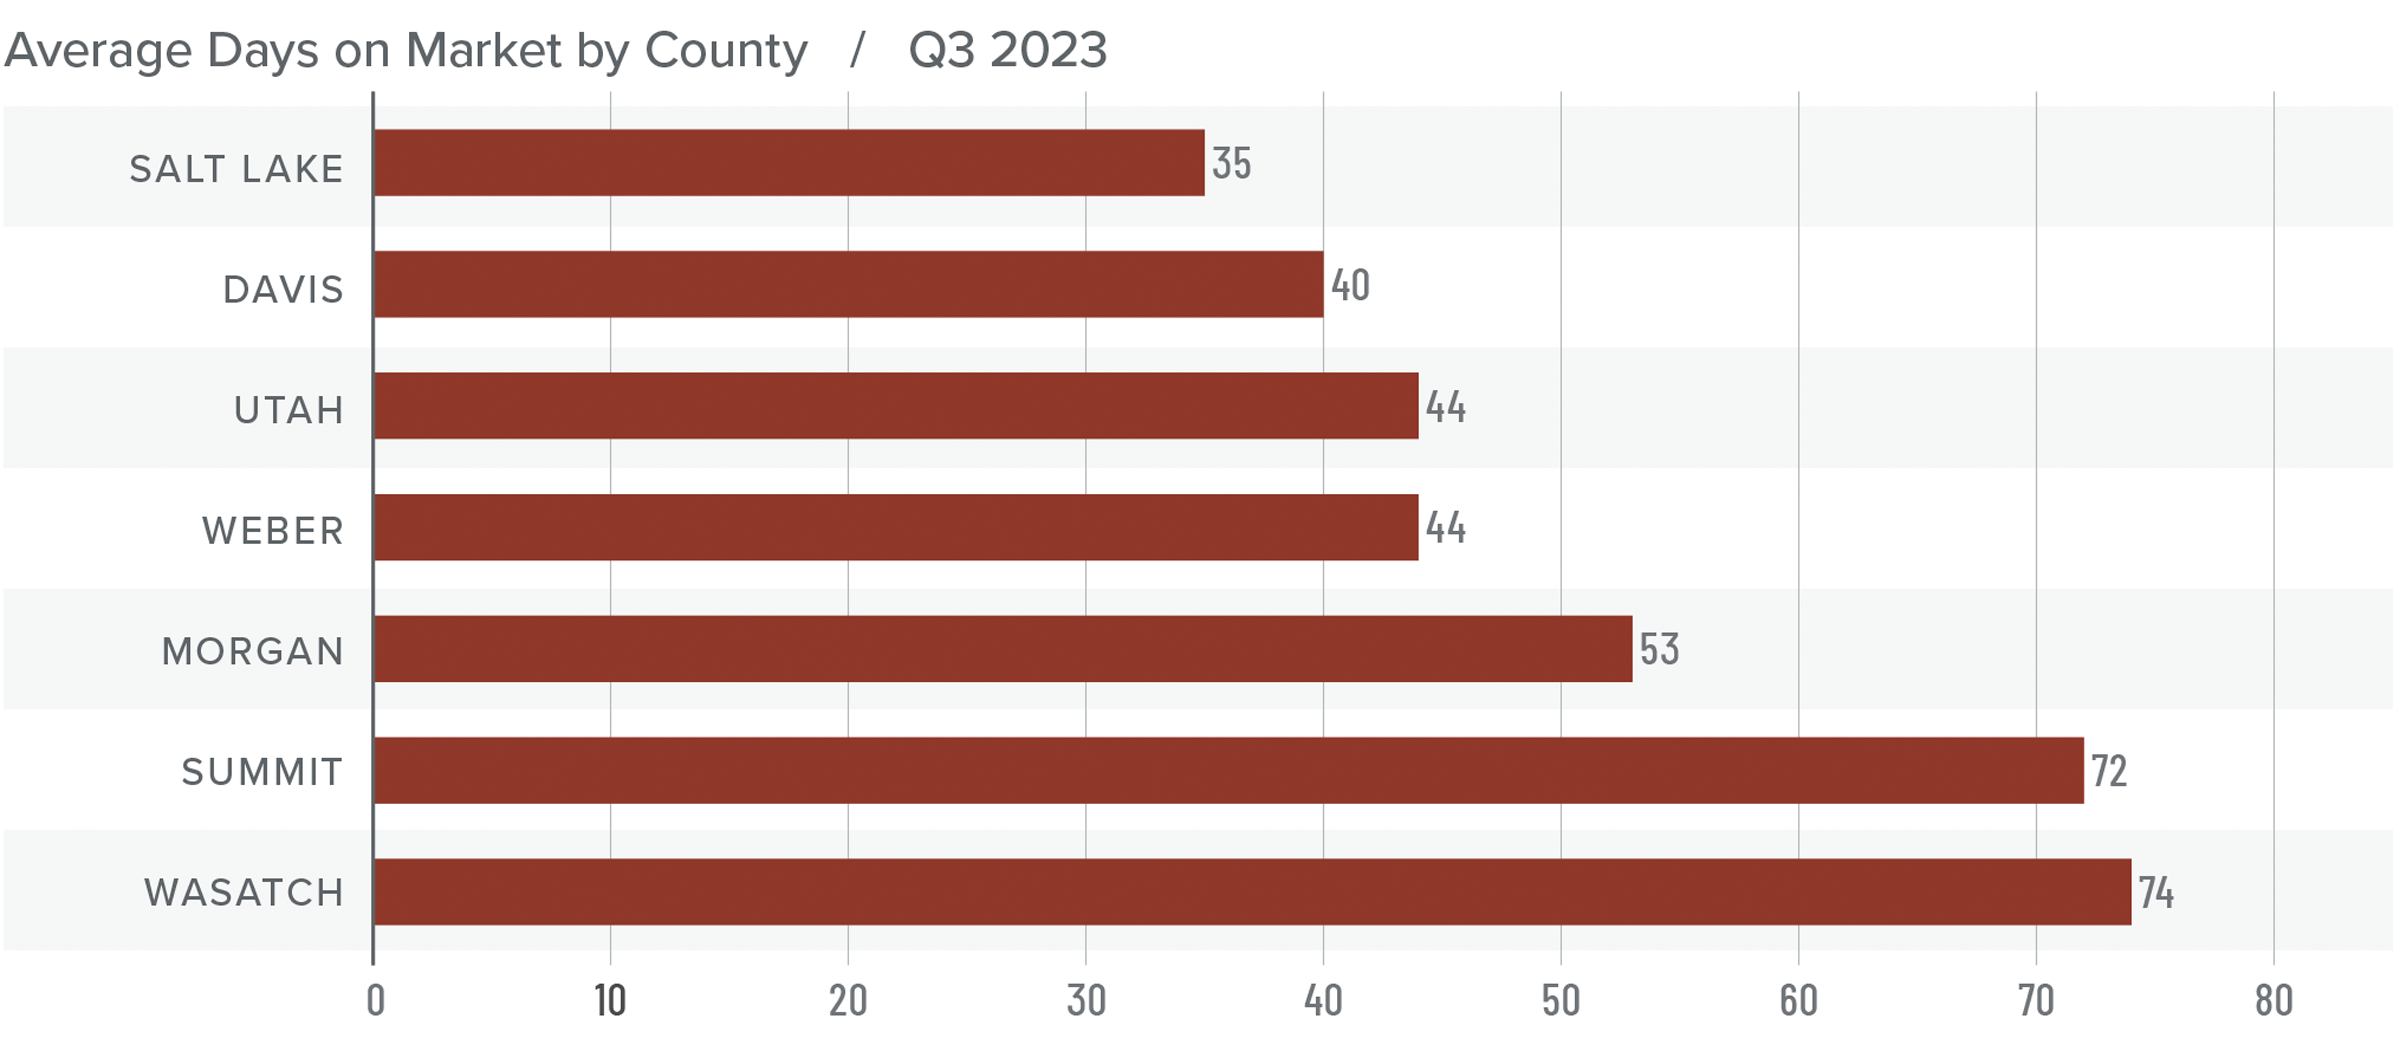
Utah Days on Market
❱ The average time it took to sell a home in the counties covered by this report rose 17 days compared to the same period in 2022.
❱ Homes sold fastest in Salt Lake County; Wasatch County was the slowest. All areas saw market time rise compared to the third quarter of 2022, but all counties except Wasatch saw market time fall compared to the second quarter of this year.
❱ During the third quarter, it took an average of 52 days to sell a home. Market time fell three days compared to the second quarter of 2023.
❱ Even when faced with more inventory and higher financing costs, it was impressive to see the length of time it took to sell a home in the region fall, albeit modestly, from the second quarter.
Conclusions
This speedometer reflects the state of the region’s real estate market using housing inventory, price gains, home sales, interest rates, and larger economic factors.
The region saw average market time fall even though the number of available homes rose, which should favor home sellers. That said, closed and pending sales fell, and list price growth was flat.
This suggests that the market is lacking direction, which is to be expected given that mortgage rates are at their highest level in over 20 years. Current buyers are likely weighing whether interest rates will come down and, if they do, how long they’ll have to wait to refinance out of a loan with a rate well above seven percent.
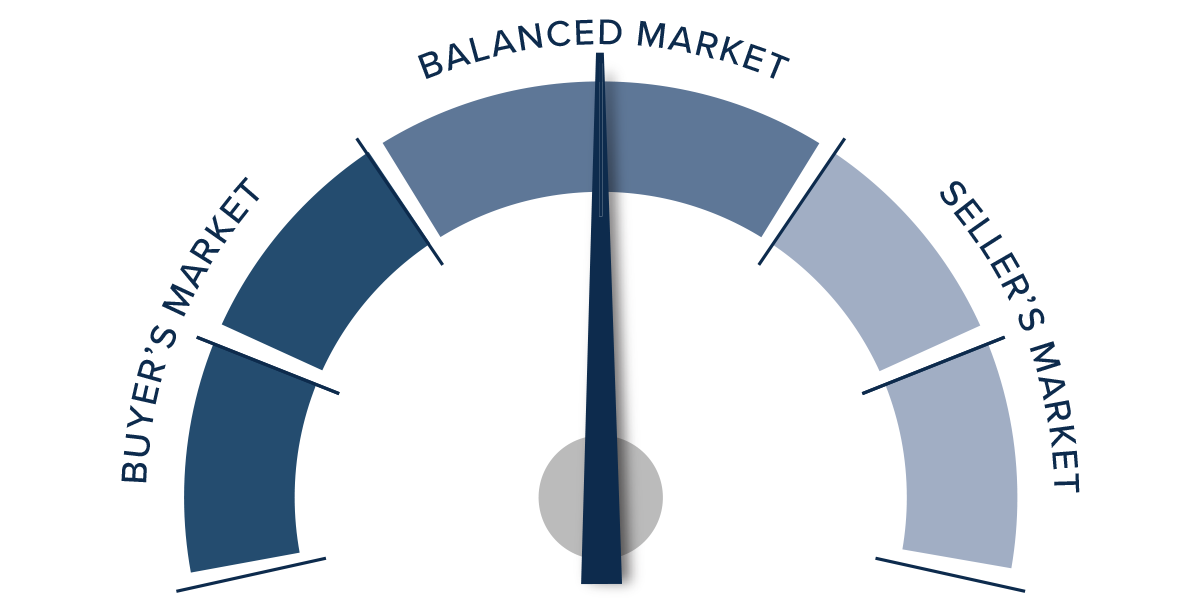
Inventory growth and mortgage rates aside, the market has seen a very significant runup in prices since the start of the pandemic, so it wouldn’t surprise me if both prices and sales remain fairly static for the balance of the year.
As such, the needle moves more toward the middle, with neither buyers nor sellers really having the upper hand.
Q3 2023 Montana Real Estate Market Update

The following analysis of select counties of the Montana real estate market is provided by Windermere Real Estate. We hope that this information may assist you with making better-informed real estate decisions. For further information about the housing market in your area, please don’t hesitate to contact your Windermere Real Estate agent.
Regional Economic Overview
The pace of job growth in Montana continues to taper. The state added only 6,000 jobs, which represents an annual growth rate of 1.2%. This is the slowest pace of growth in the state since pandemic influences started to come into play.
Regional variations continued: the Billings metro area lost 600 jobs, Great Falls employment was flat, and the Missoula metro area saw employment rise 1,100 jobs.
The state unemployment rate in August was 2.5%, which was down from 2.7% in the same period of 2022. All metro areas in this report showed unemployment rates of 2.5%.
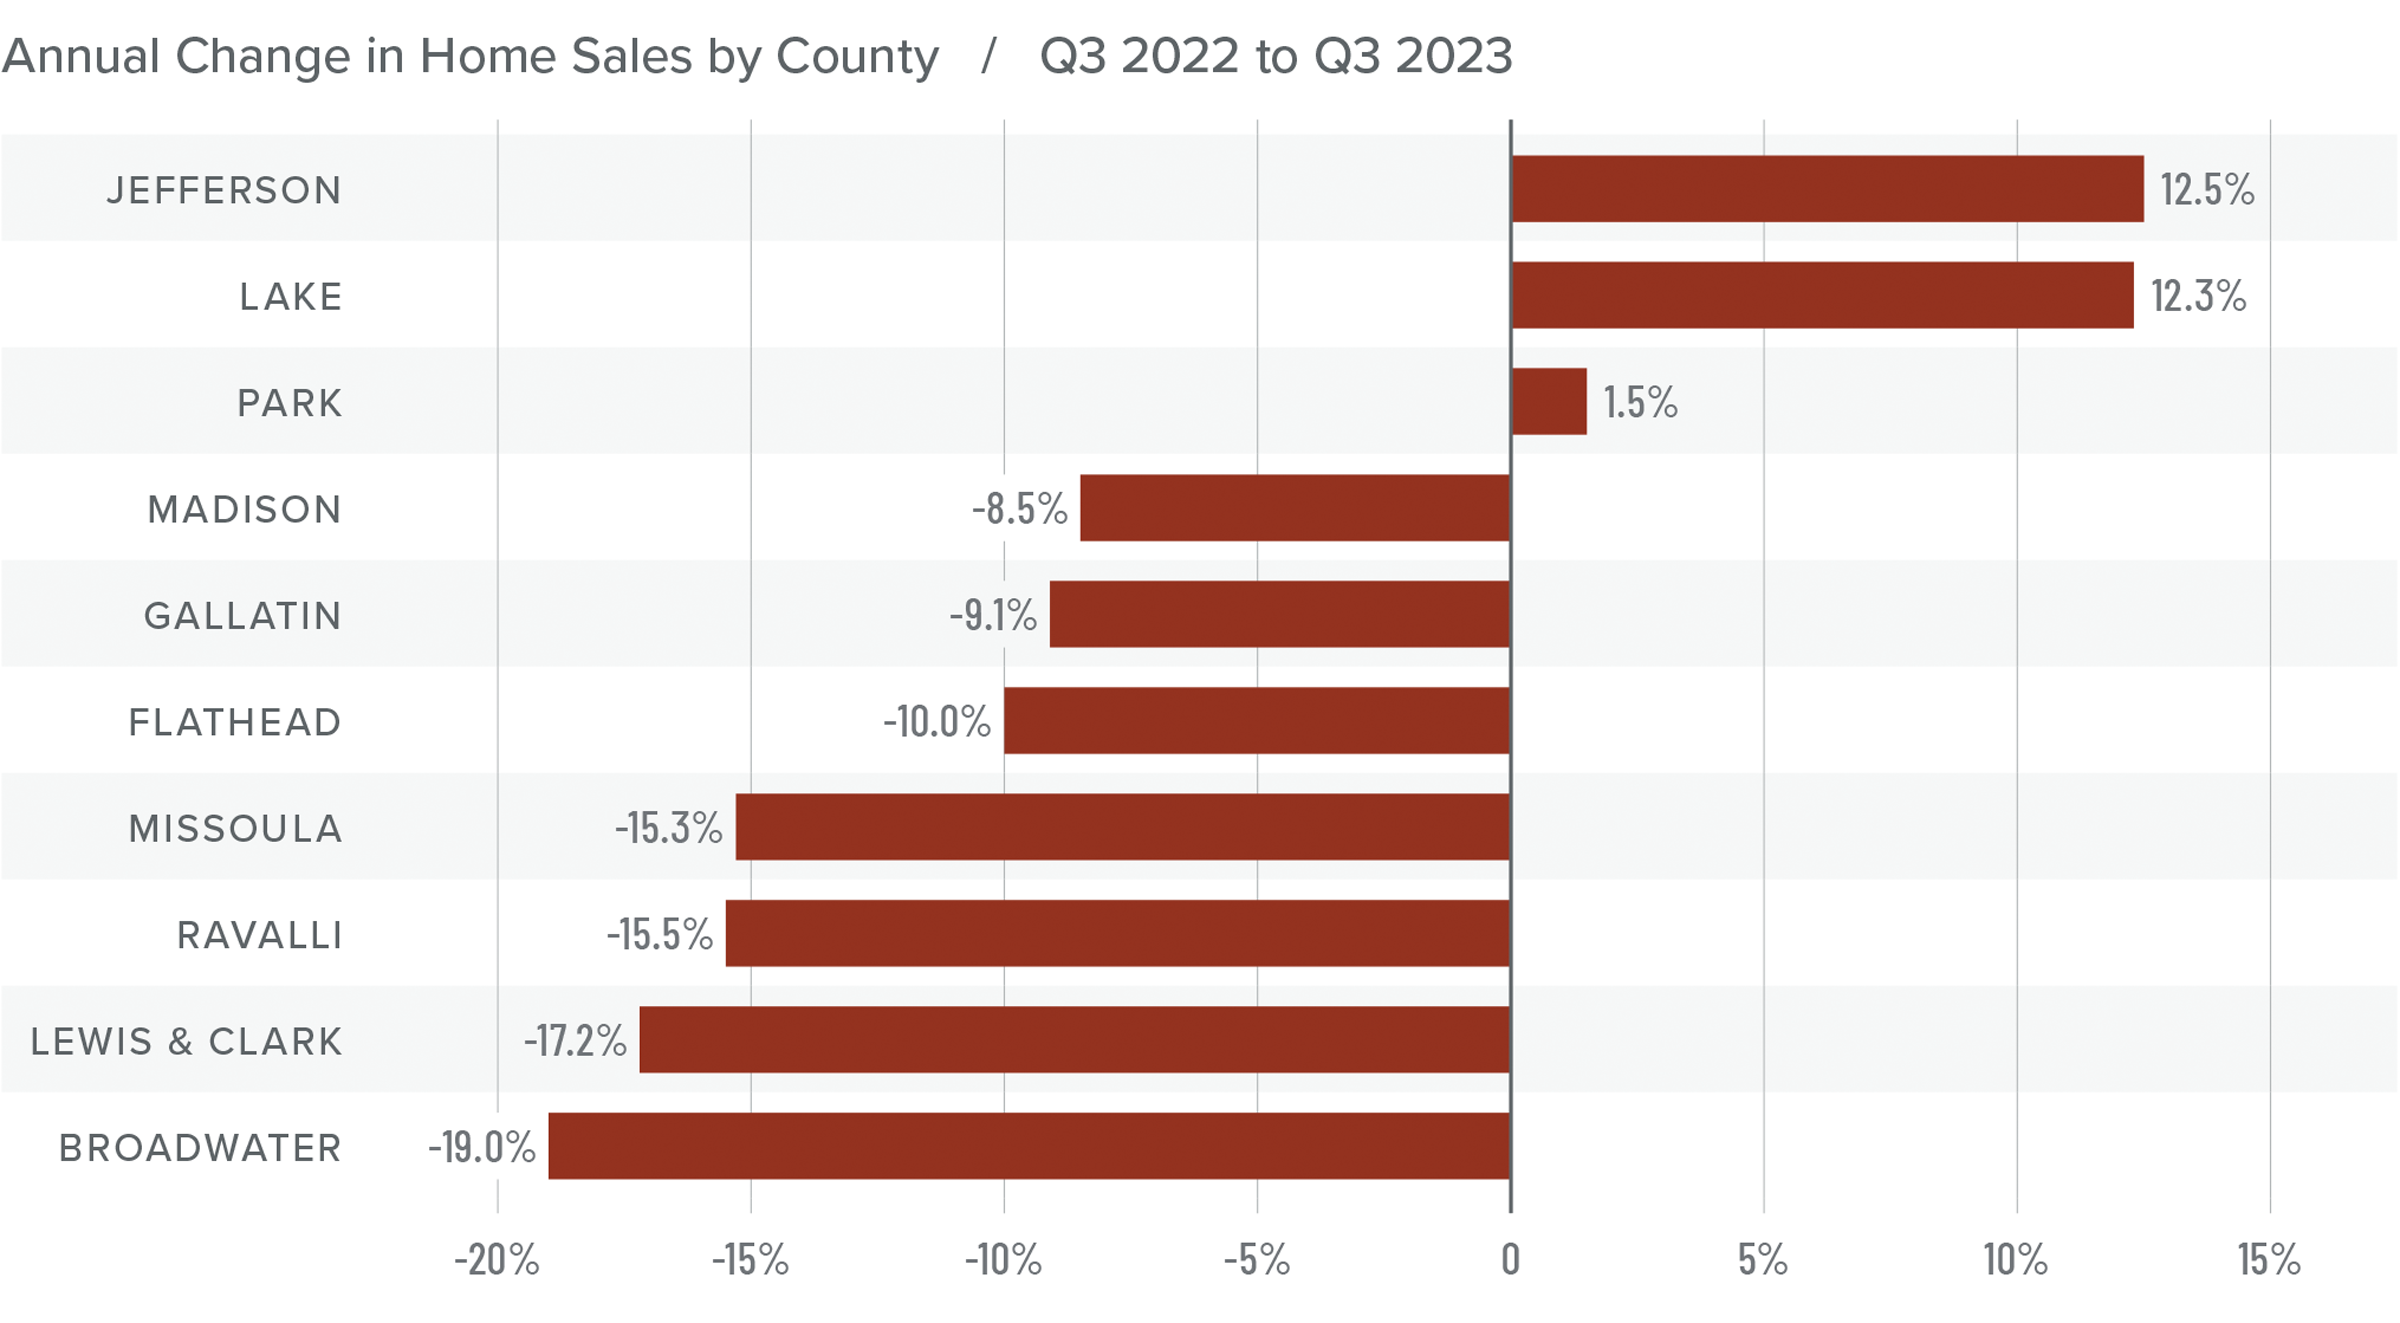
Montana Home Sales
❱ In the third quarter of 2023, 1,959 homes sold in the counties covered by this report. This was a 10.8% decline from the third quarter of 2022 but 7% higher than in the second quarter of 2023.
❱ Listing activity was 9.6% higher than during the same period of 2022 and 30.2% higher than in the second quarter of this year.
❱ Year over year, sales fell in all but three markets. Compared to the second quarter of this year, sales were up in every county other than Broadwater and Ravalli, where sales were down 37% and 7.4%, respectively.
❱ Pending sales fell 24.2% quarter over quarter, suggesting that closings in the final quarter of the year may be down.
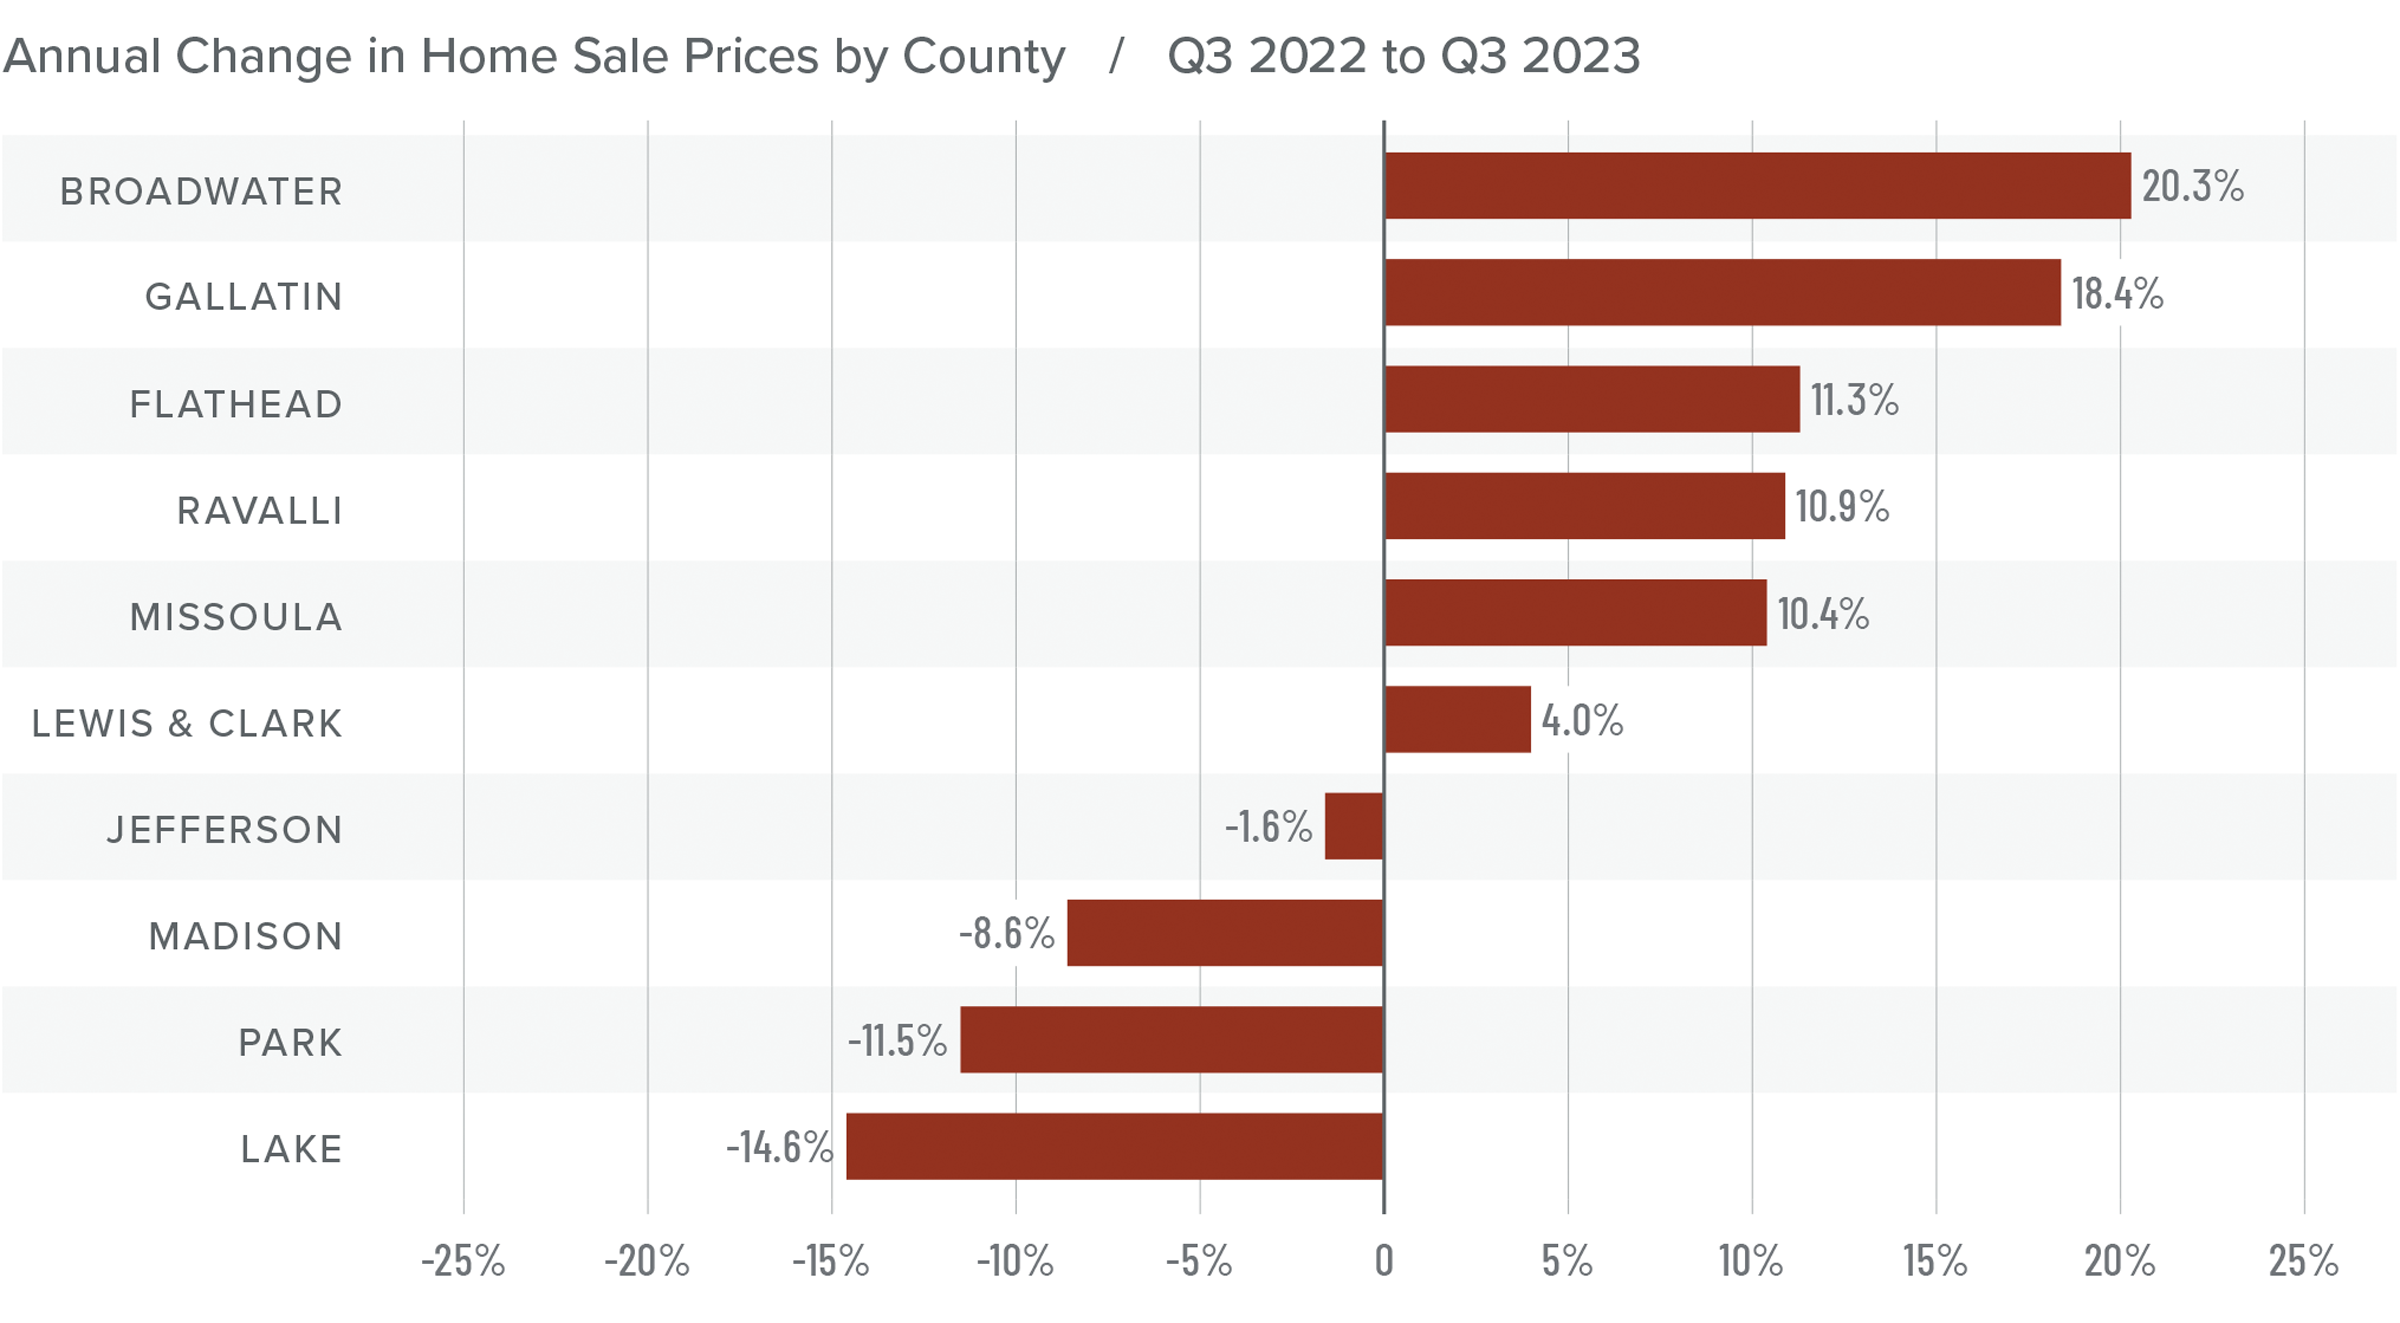
Montana Home Prices
❱ Home prices were up 9.6% year over year. The average sale price was $758,641, which was 12% higher than in the second quarter of 2023.
❱ The growth in home prices is a little surprising given rising financing costs, more choice in the market, and the fact that list prices were higher in most markets than in the second quarter of 2023.
❱ Year over year, prices rose in six counties and fell in four. Compared to the second quarter of this year, prices rose in every county other than Lake and Park.
❱ So far, higher mortgage rates have not been much of a deterrent, at least not yet. I expected price growth to start tapering by now, but it appears I was a little premature. That said, I stand by my belief that high mortgage rates will begin to impact price growth as we move toward the end of the year.

Mortgage Rates
Mortgage rates continued trending higher in the third quarter of 2023 and are now at levels we have not seen since the fall of 2000. Mortgage rates are tied to the interest rate (yield) on 10-year treasuries, and they move in the opposite direction of the economy. Unfortunately for mortgage rates, the economy remains relatively buoyant, and though inflation is down significantly from its high, it is still elevated. These major factors and many minor ones are pushing Treasury yields higher, which is pushing mortgage rates up. Given the current position of the Federal Reserve, which intends to keep rates “higher for longer,” it is unlikely that home buyers will get much reprieve when it comes to borrowing costs any time soon.
With such a persistently positive economy, I have had to revise my forecast yet again. I now believe rates will hold at current levels before starting to trend down in the spring of next year.
Montana Days on Market
❱ The average time it took to sell a home rose six days compared to the same period in 2022. Time on market fell 11 days compared to the second quarter of 2023.
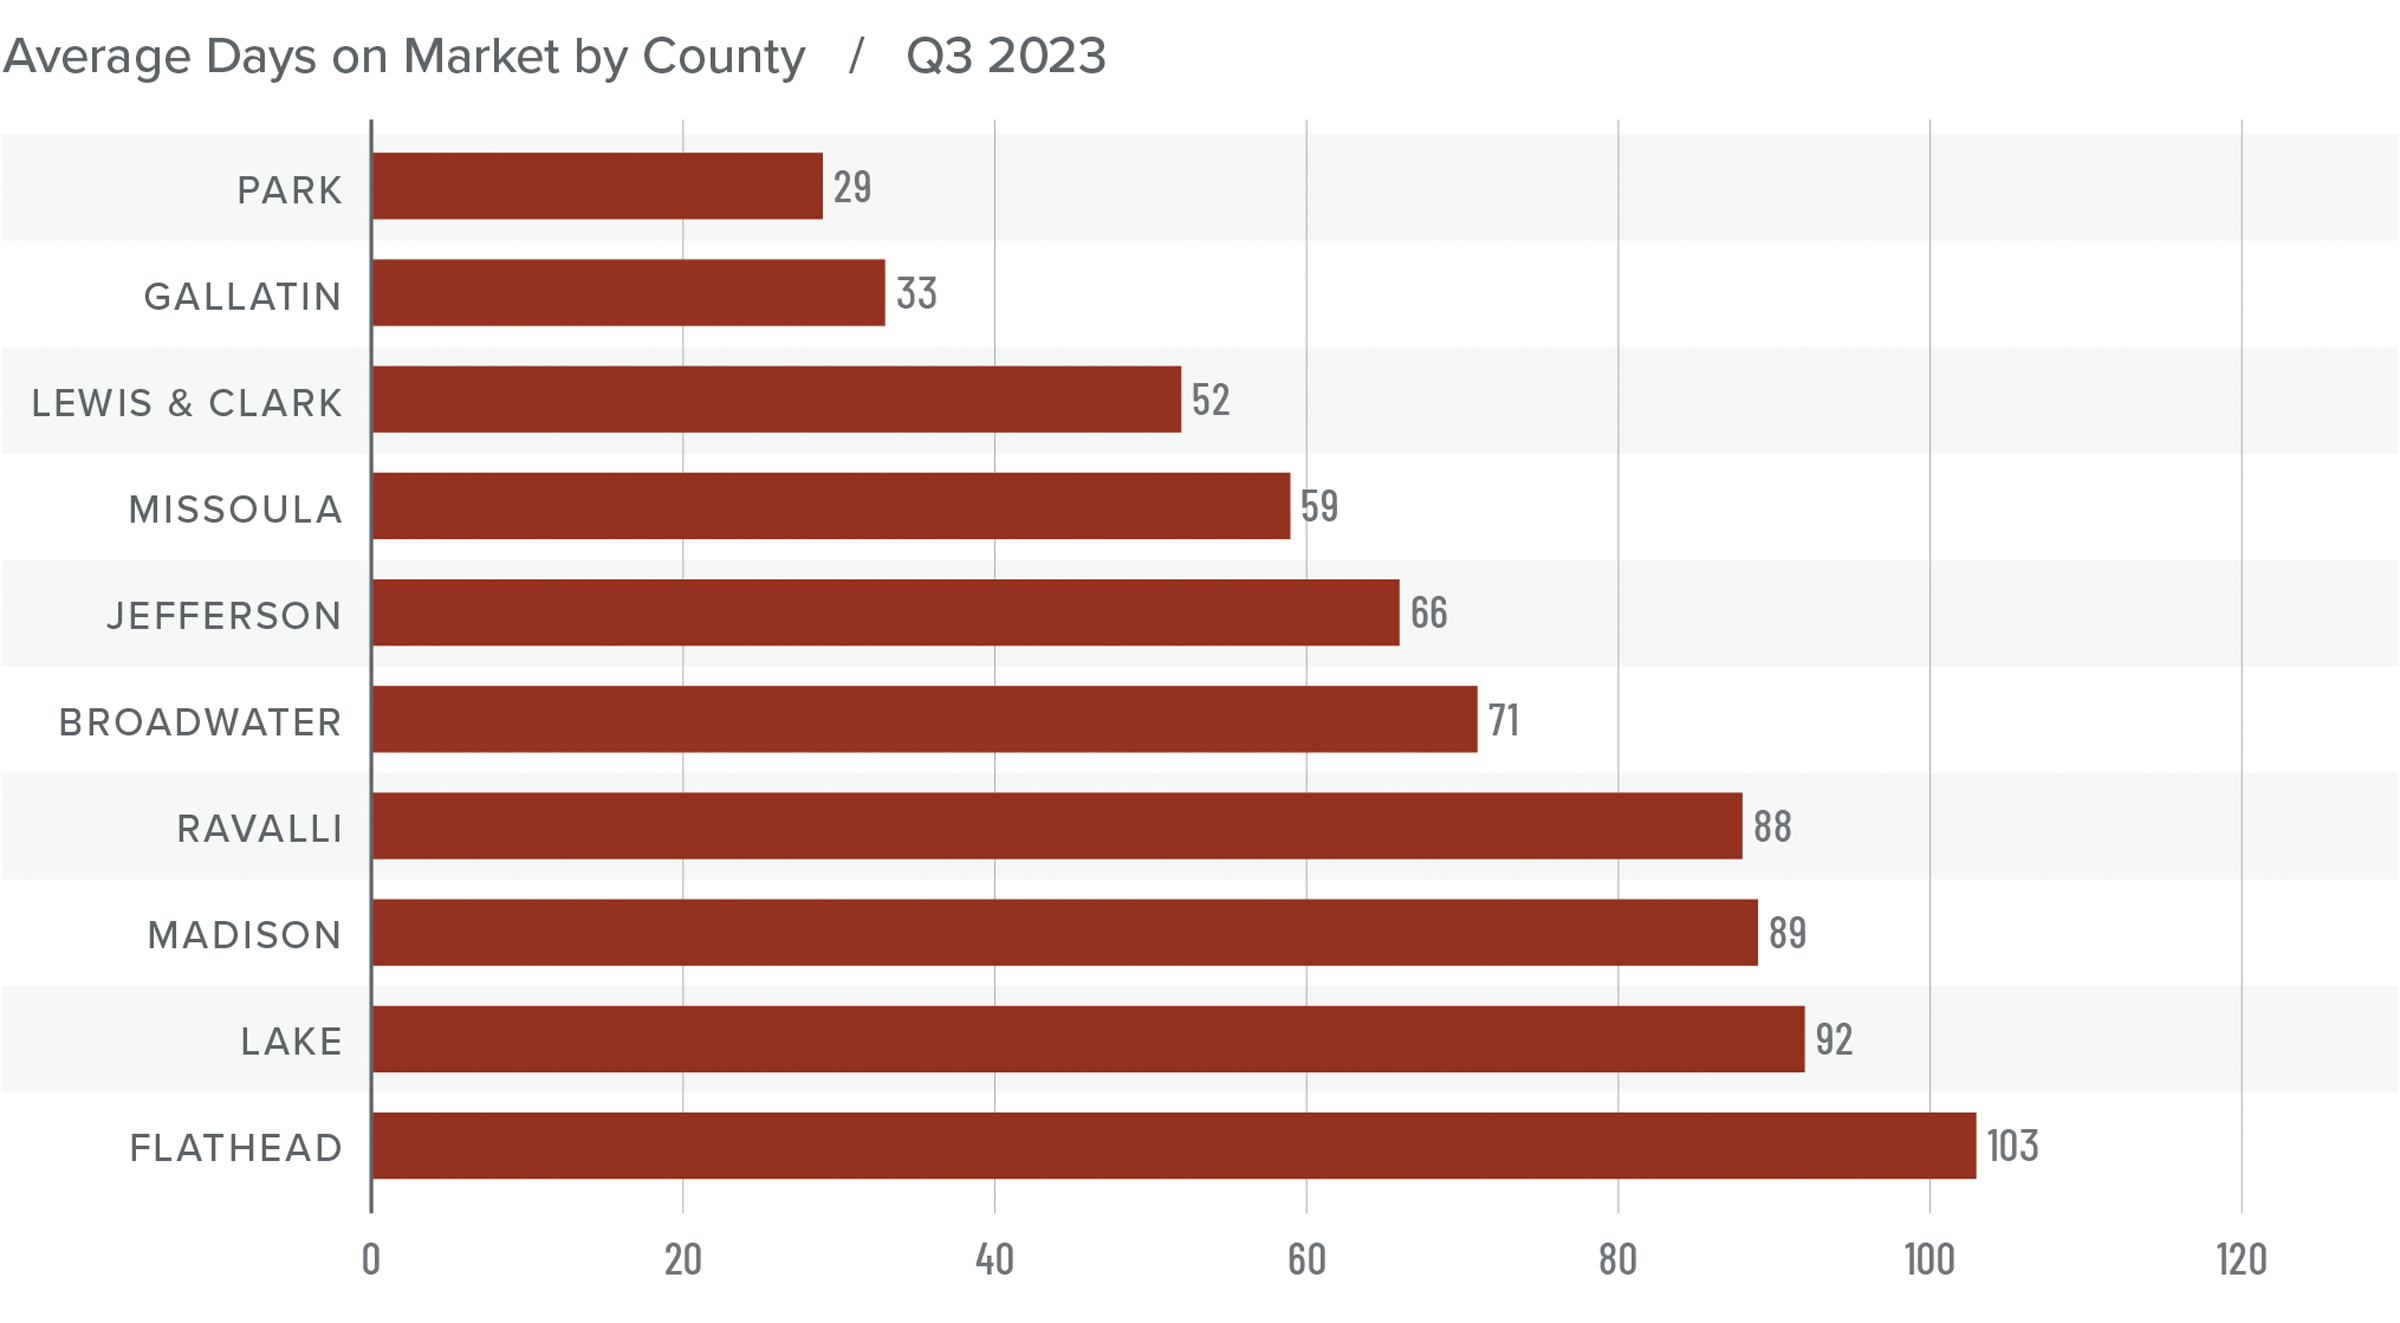
❱ Homes sold fastest in Park County while homes in Flathead County took the longest time to sell. Compared to the third quarter of 2022, market time fell in Missoula, Lewis and Clark, Broadwater, Jefferson, and Park counties but rose in the rest of the region.
❱ During the third quarter, it took an average of 68 days to sell a home in the markets covered by this report.
❱ Compared to the second quarter of this year, average market time rose in only three counties (Lake, Lewis and Clark, and Madison), was flat in Ravalli, and fell everywhere else.
Conclusions
This speedometer reflects the state of the region’s real estate market using housing inventory, price gains, home sales, interest rates, and larger economic factors.
As mentioned earlier, it doesn’t appear that rising mortgage rates have had the same negative effect in Montana that has been felt across most of the country. In the third quarter, home sales and sale/ list prices rose while market time fell, which are all factors that favor sellers. However, rising inventory and falling pending sales would suggest that the market may be ready to shift toward buyers.
Although the market is expected to slow, it’s too early to suggest that it will favor buyers any time soon. Given all these factors, the needle stays in the balanced quadrant but moved slightly in favor of home sellers.
Q3 2023 Idaho Real Estate Market Update

The following analysis of select counties of the Idaho real estate market is provided by Windermere Real Estate. We hope that this information may assist you with making better-informed real estate decisions. For further information about the housing market in your area, please don’t hesitate to contact your Windermere Real Estate agent.
Regional Economic Overview
The annual pace of employment growth in the state continues to slow. However, the addition of 22,400 new jobs since the third quarter of 2022 represents an impressive 2.7% growth rate and is well above the national rate of 2.1%. While I expect the pace of job growth to continue to cool, jobs will still be added for the balance of the year. My current forecast calls for statewide employment to increase 2.5% in 2023 and 1.3% in 2024.
With the exception of Lewiston, where employment levels were static, all of Idaho’s metro areas had solid year-over-year nonfarm job gains. Idaho Falls saw the greatest increase at 4.2%, followed by Pocatello (+3.3%), Coeur d’Alene (+3%), Boise (+2.7%), and Twin Falls (2.6%).
The state unemployment rate was a healthy 3%, which was marginally above 2.8% in the third quarter of 2022. Regionally, the lowest jobless rate was in Idaho Falls at 2.7%. Boise’s unemployment rate was 3.5%. The highest rate was in Coeur d’Alene, where 4.5% of the workforce was actively looking for work.
Idaho Home Sales
❱ In the third quarter of 2023, 4,945 homes sold, which was a drop of 6.2% from the third quarter of 2022 and 2.7% lower than in the second quarter of this year.
❱ Listing activity was up 11.3% from the second quarter of the year, which appears to have resulted in rising sales in most market areas.
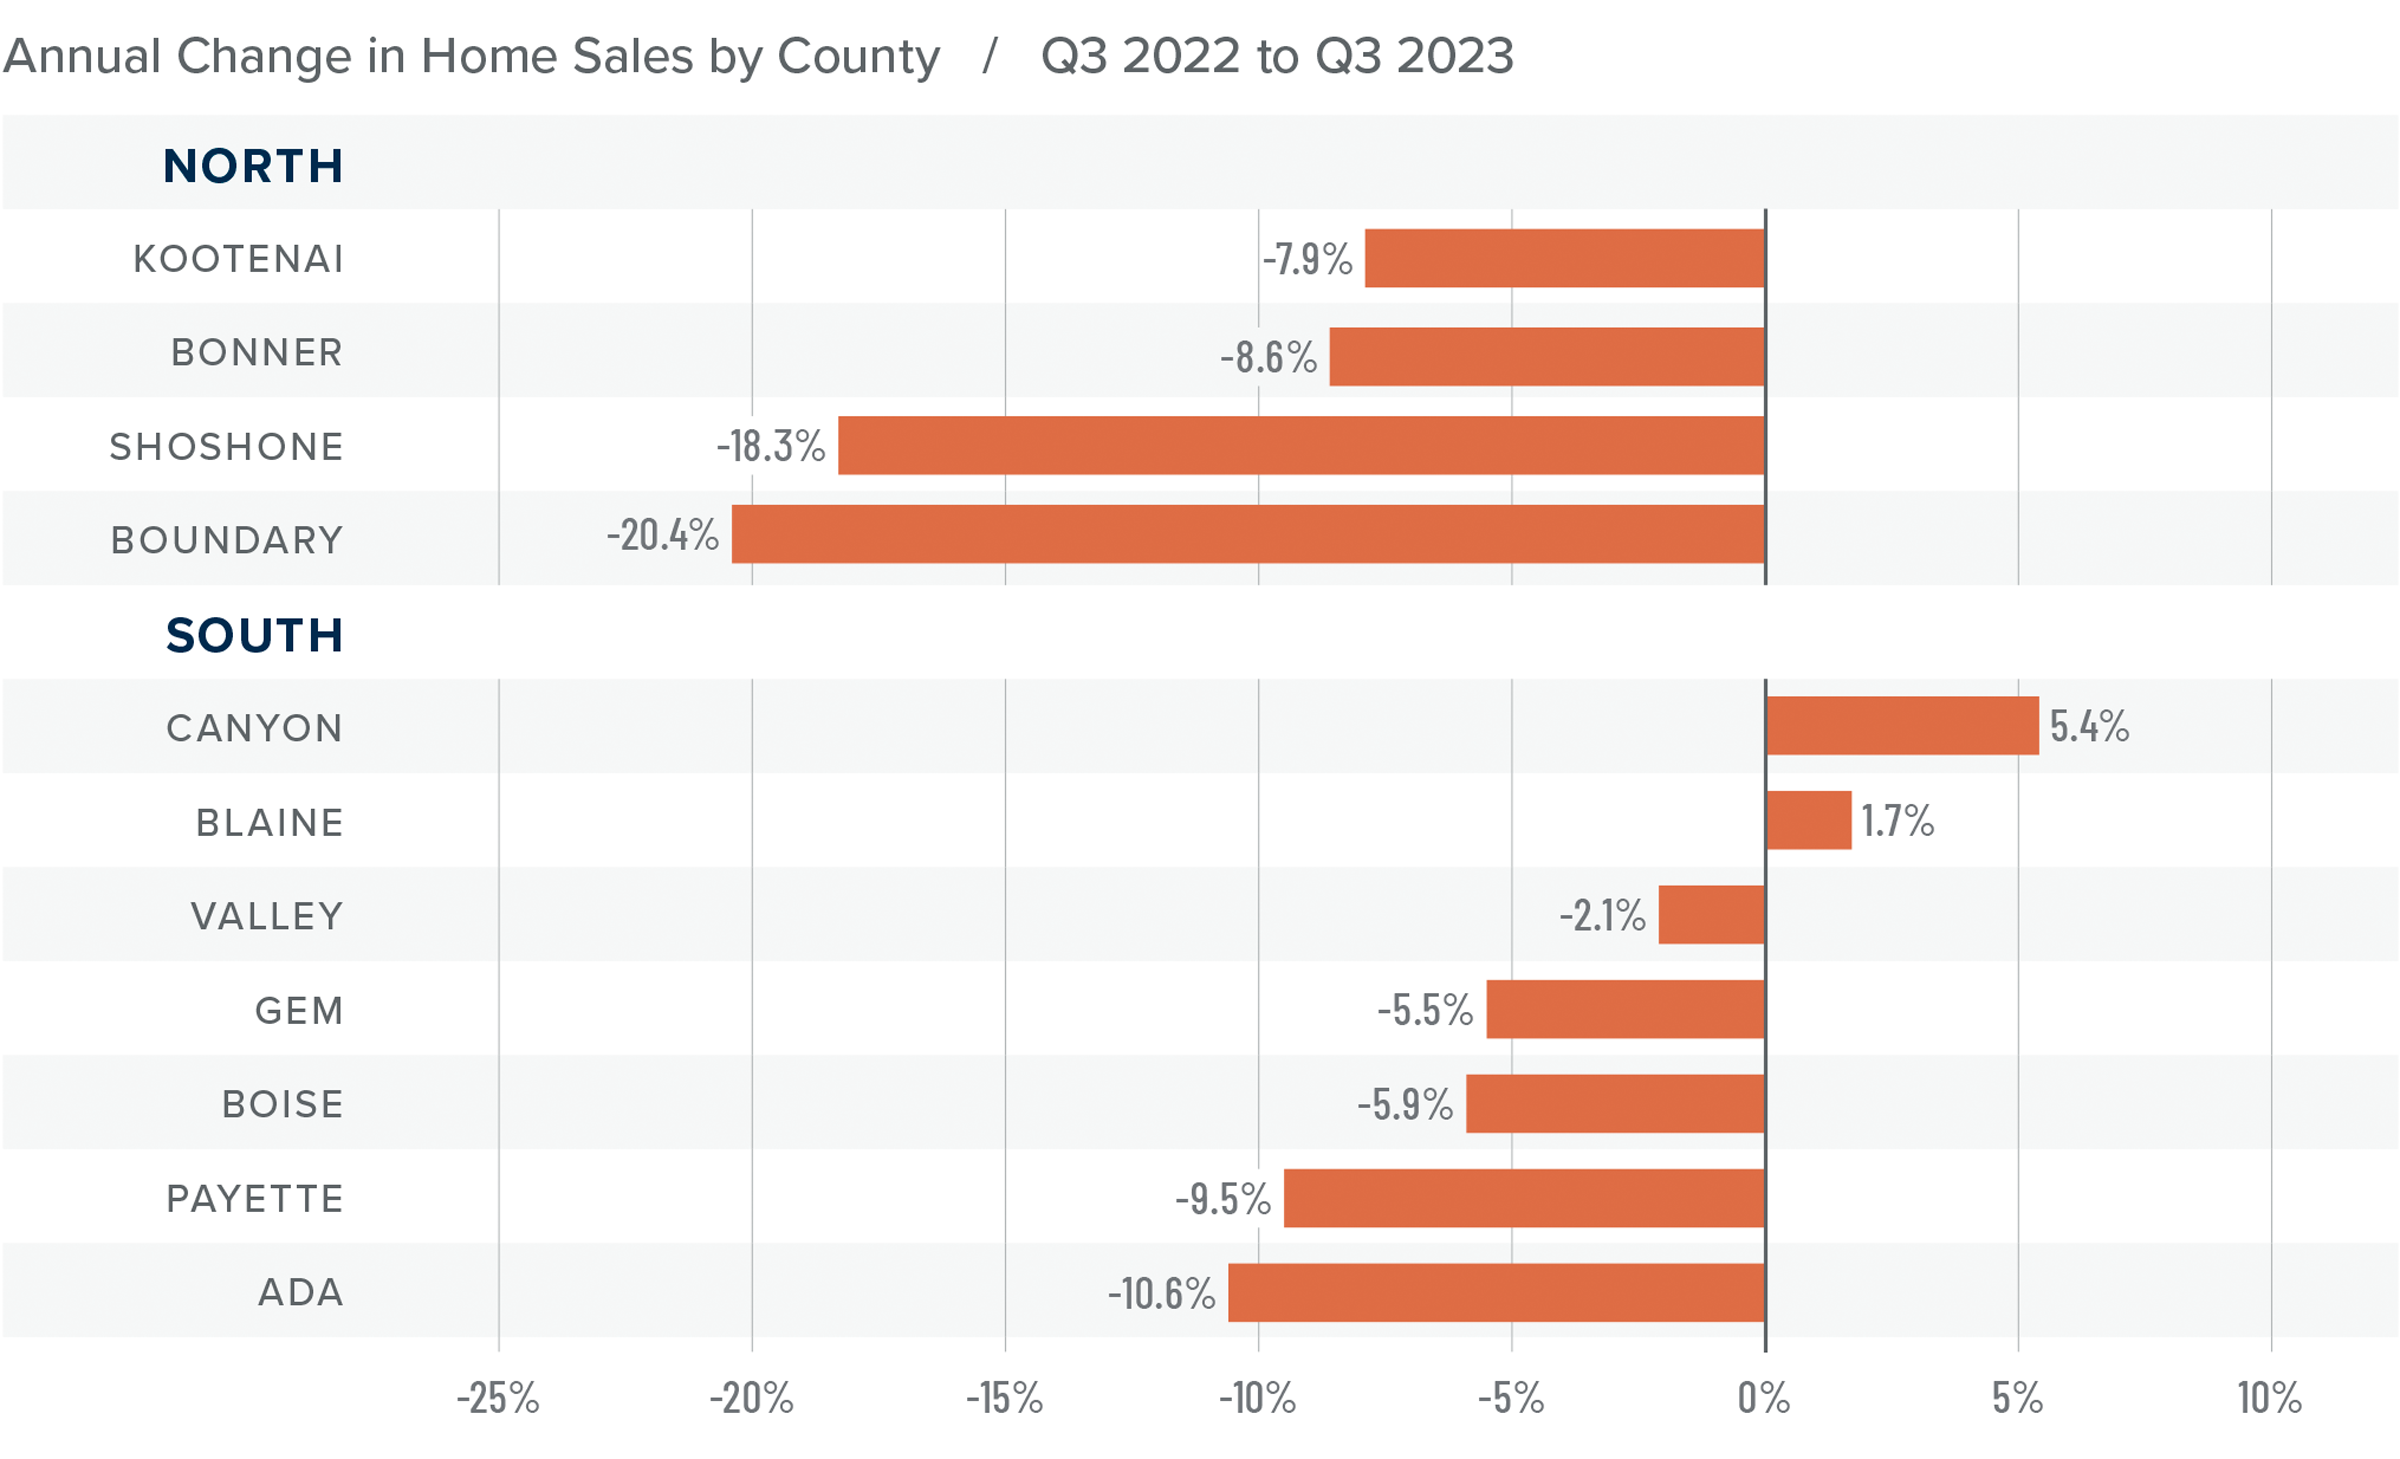
❱ Relative to the same quarter in 2022, sales fell in all the northern counties covered by this report and in every county other than Canyon and Blaine in the Southern Idaho markets. However, compared to the second quarter of this year, sales rose in all markets other than Boundary County in Northern Idaho and Canyon, Gem, and Ada counties in the southern part of the state.
❱ Pending sales in the third quarter were lower than in the second quarter of 2023, suggesting that sales may slow in the final quarter of the year.
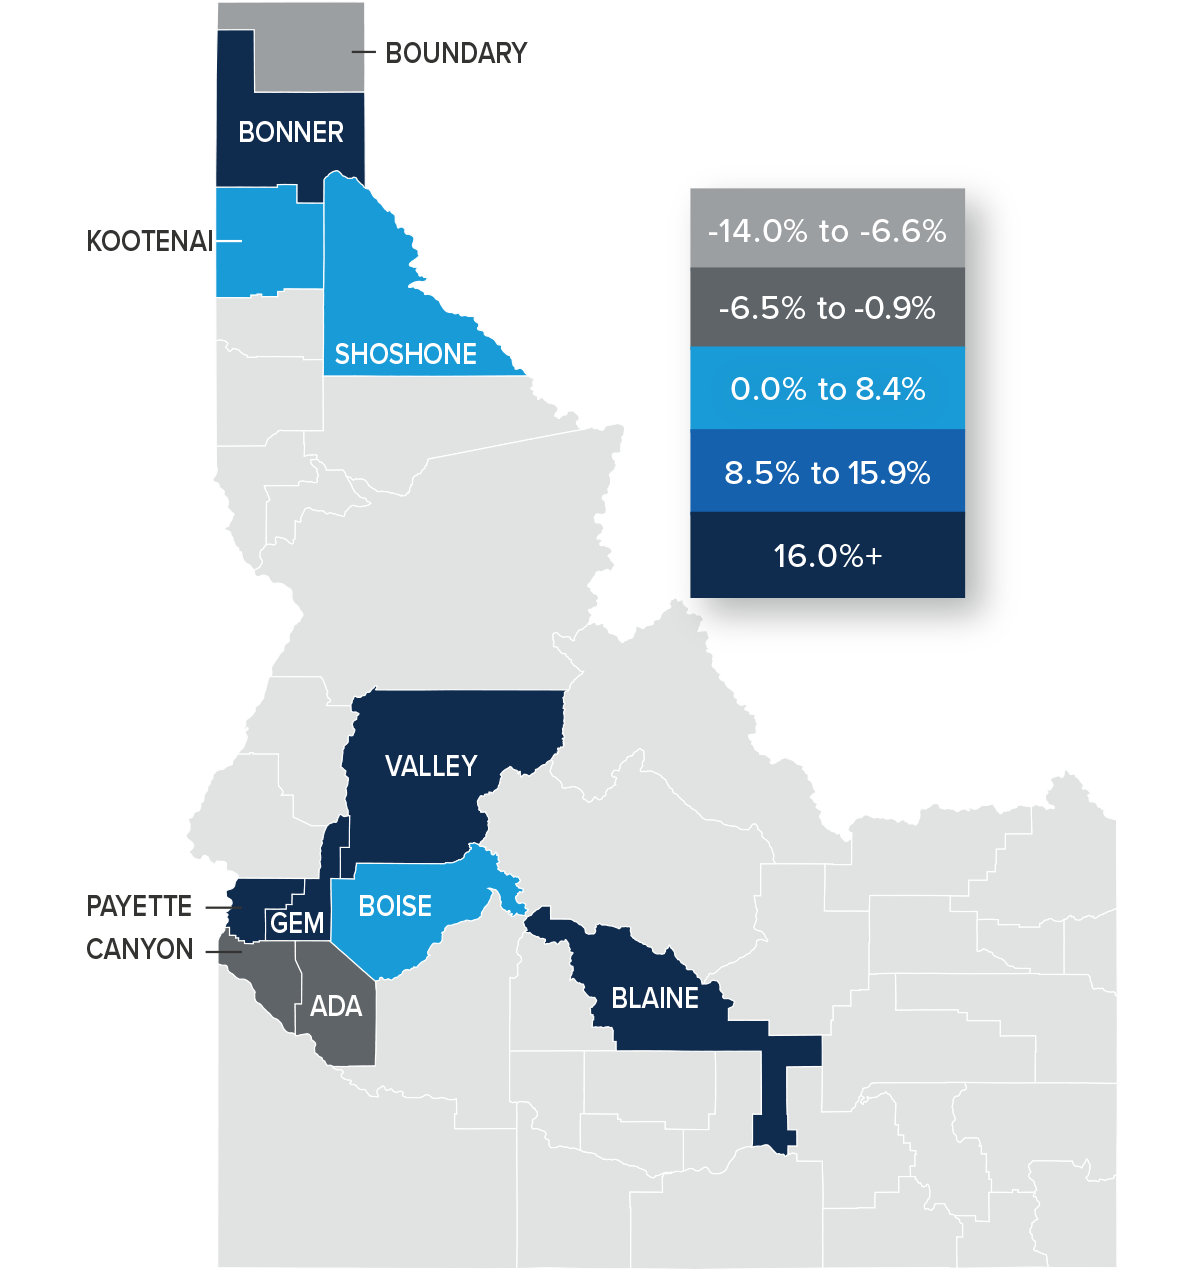
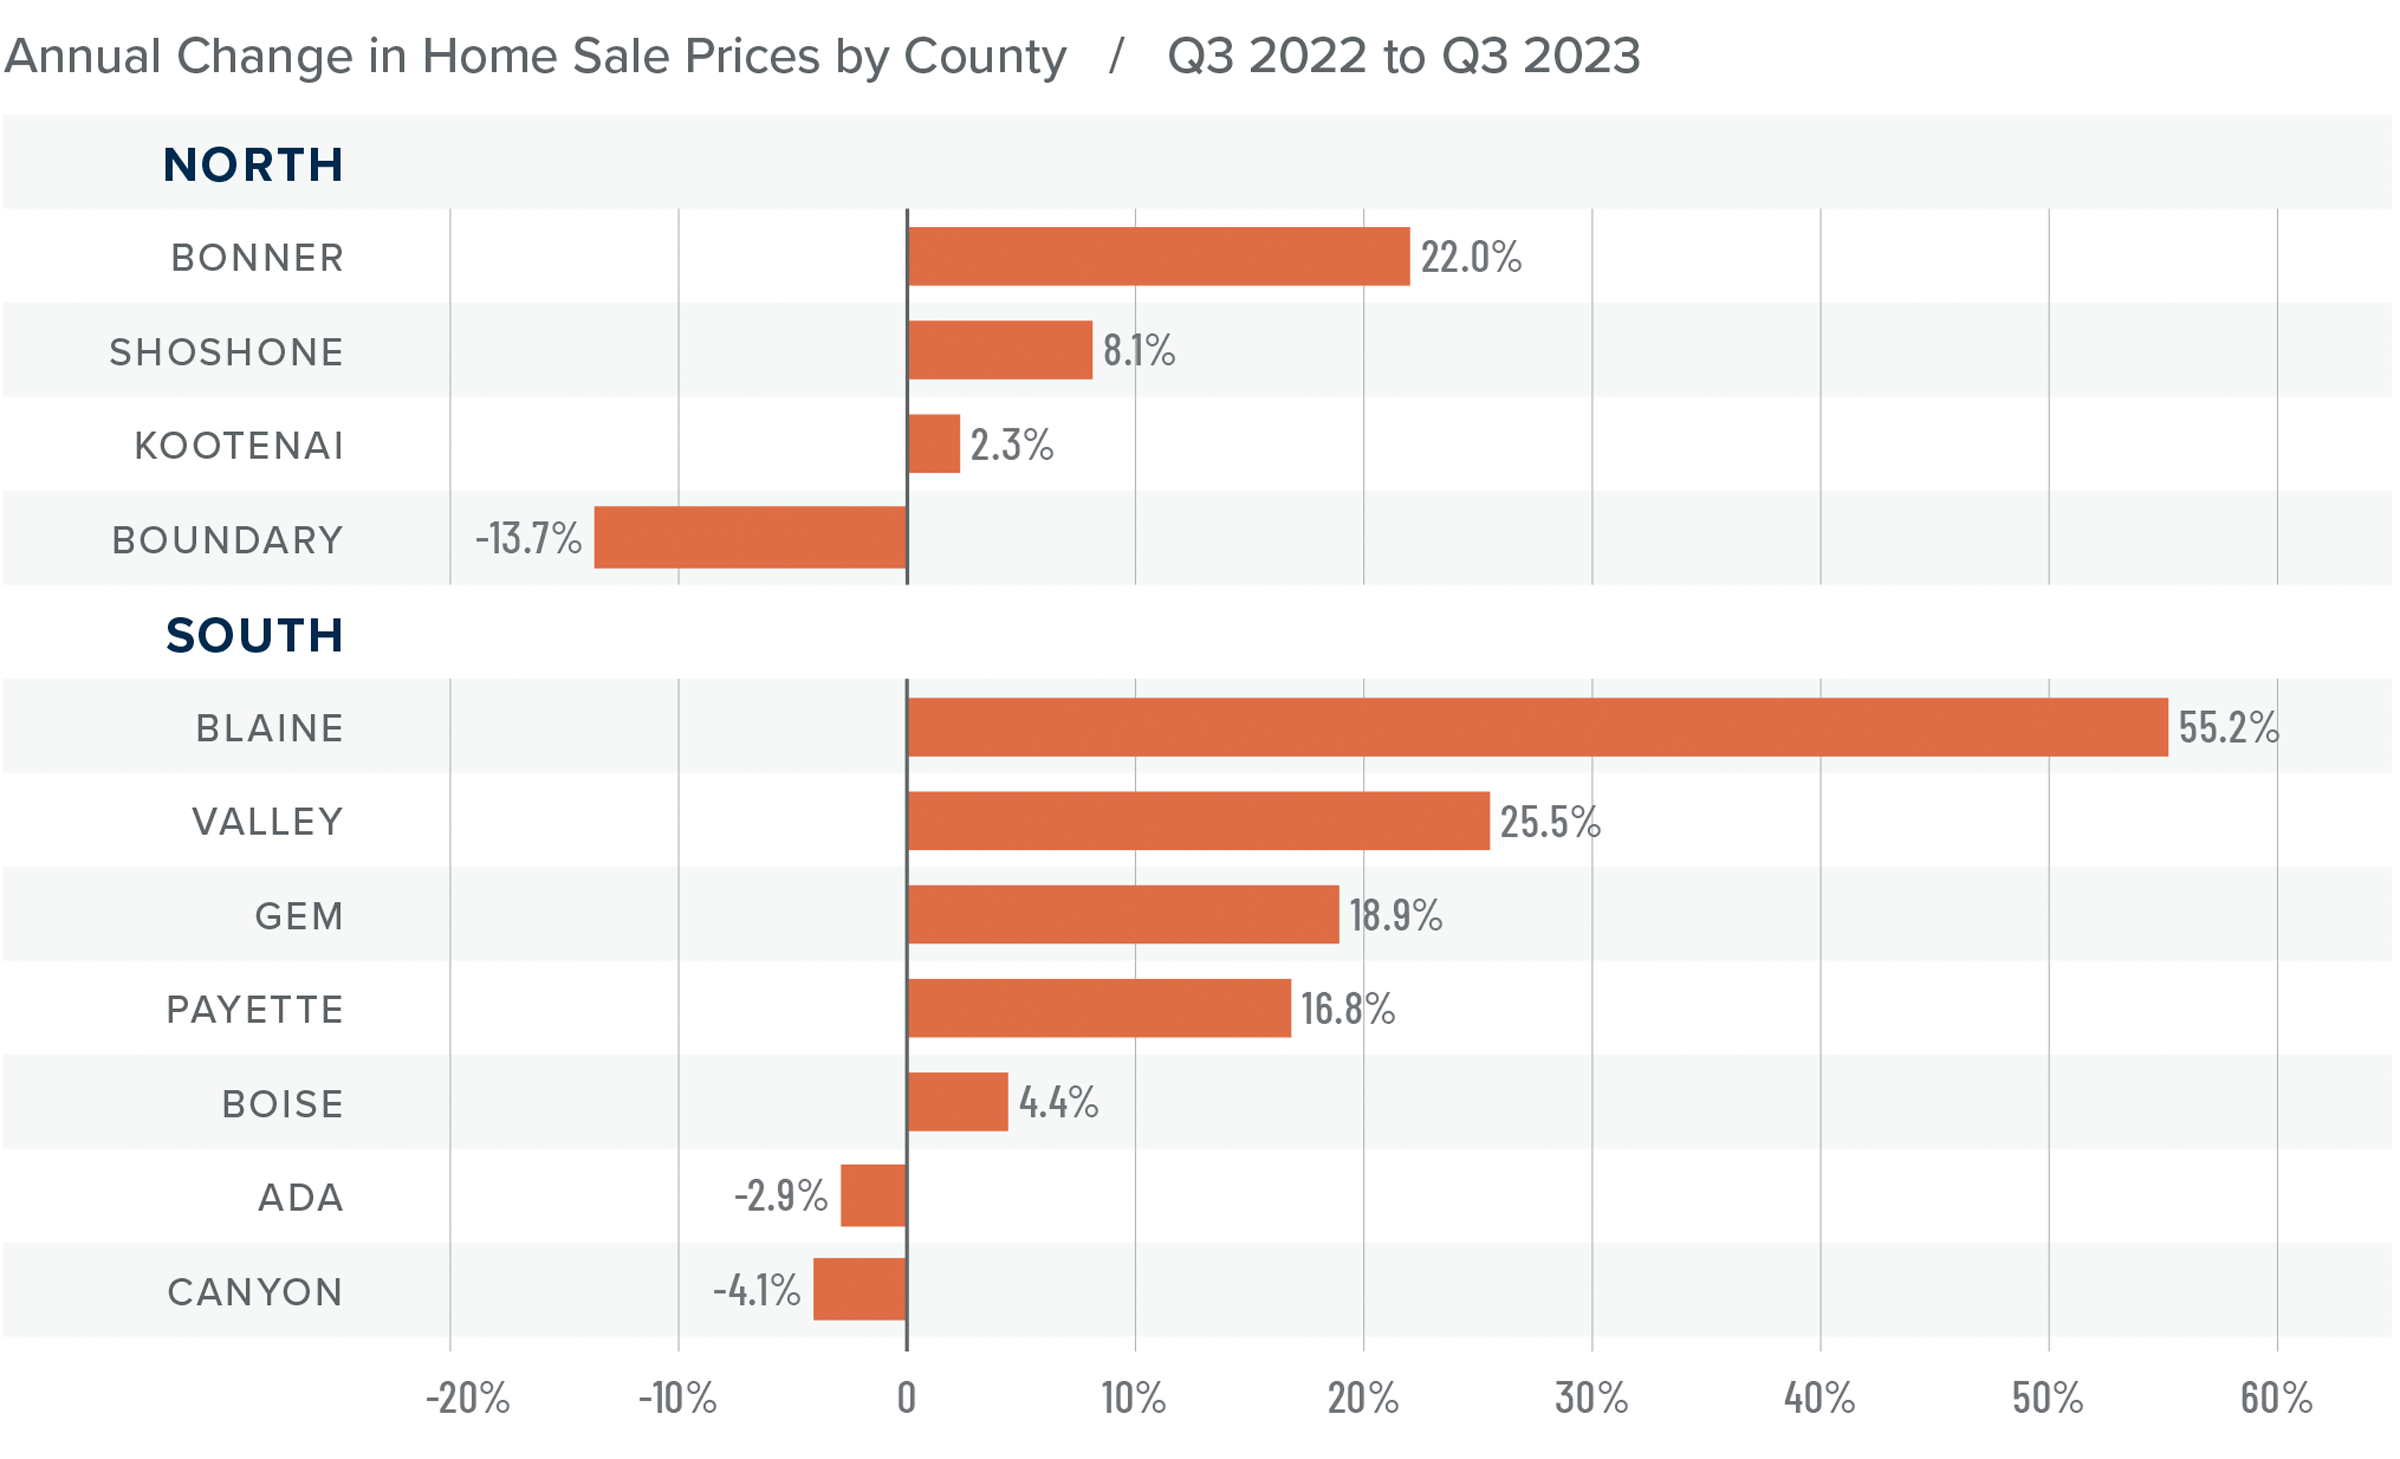
Idaho Home Prices
❱ The average home price in the region rose 2.7% year over year to $636,148. Sale prices were 5.1% higher than in the second quarter of 2023.
❱ Compared to the second quarter of 2023, prices rose an average of 5.9% in the northern market areas covered by this report. Sale prices were up 4.2% in the southern part of the state.
❱ Only one county in the northern market areas and two in the southern markets saw prices fall year over year. Compared to the second quarter, prices rose in all markets other than Shoshone and Boundary counties in the northern market area.
❱ Median list prices were up 9.5% from the second quarter. However, in the southern part of the state, every county except Payette and Blaine counties saw list prices fall. Only Boundary County in the northern markets saw list prices fall. This may suggest that sellers are starting to adjust their expectations given significant increases in financing costs.
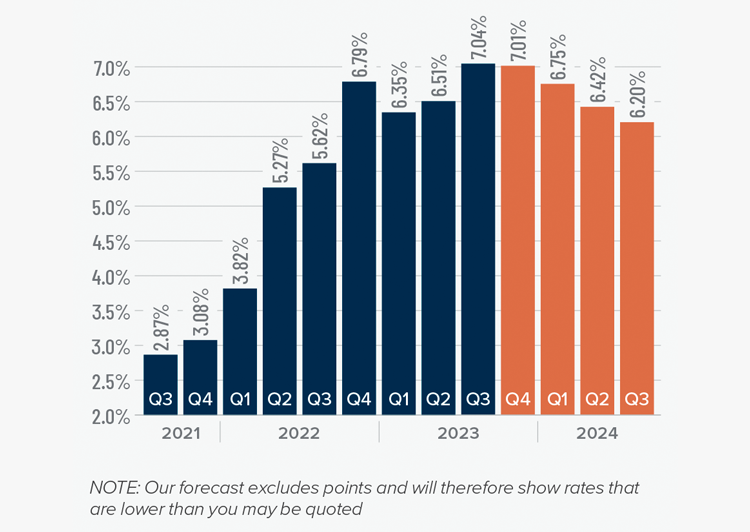
Mortgage Rates
Mortgage rates continued trending higher in the third quarter of 2023 and are now at levels we have not seen since the fall of 2000. Mortgage rates are tied to the interest rate (yield) on 10-year treasuries, and they move in the opposite direction of the economy. Unfortunately for mortgage rates, the economy remains relatively buoyant, and though inflation is down significantly from its high, it is still elevated. These major factors and many minor ones are pushing Treasury yields higher, which is pushing mortgage rates up. Given the current position of the Federal Reserve, which intends to keep rates “higher for longer,” it is unlikely that home buyers will get much reprieve when it comes to borrowing costs any time soon.
With such a persistently positive economy, I have had to revise my forecast yet again. I now believe rates will hold at current levels before starting to trend down in the spring of next year.
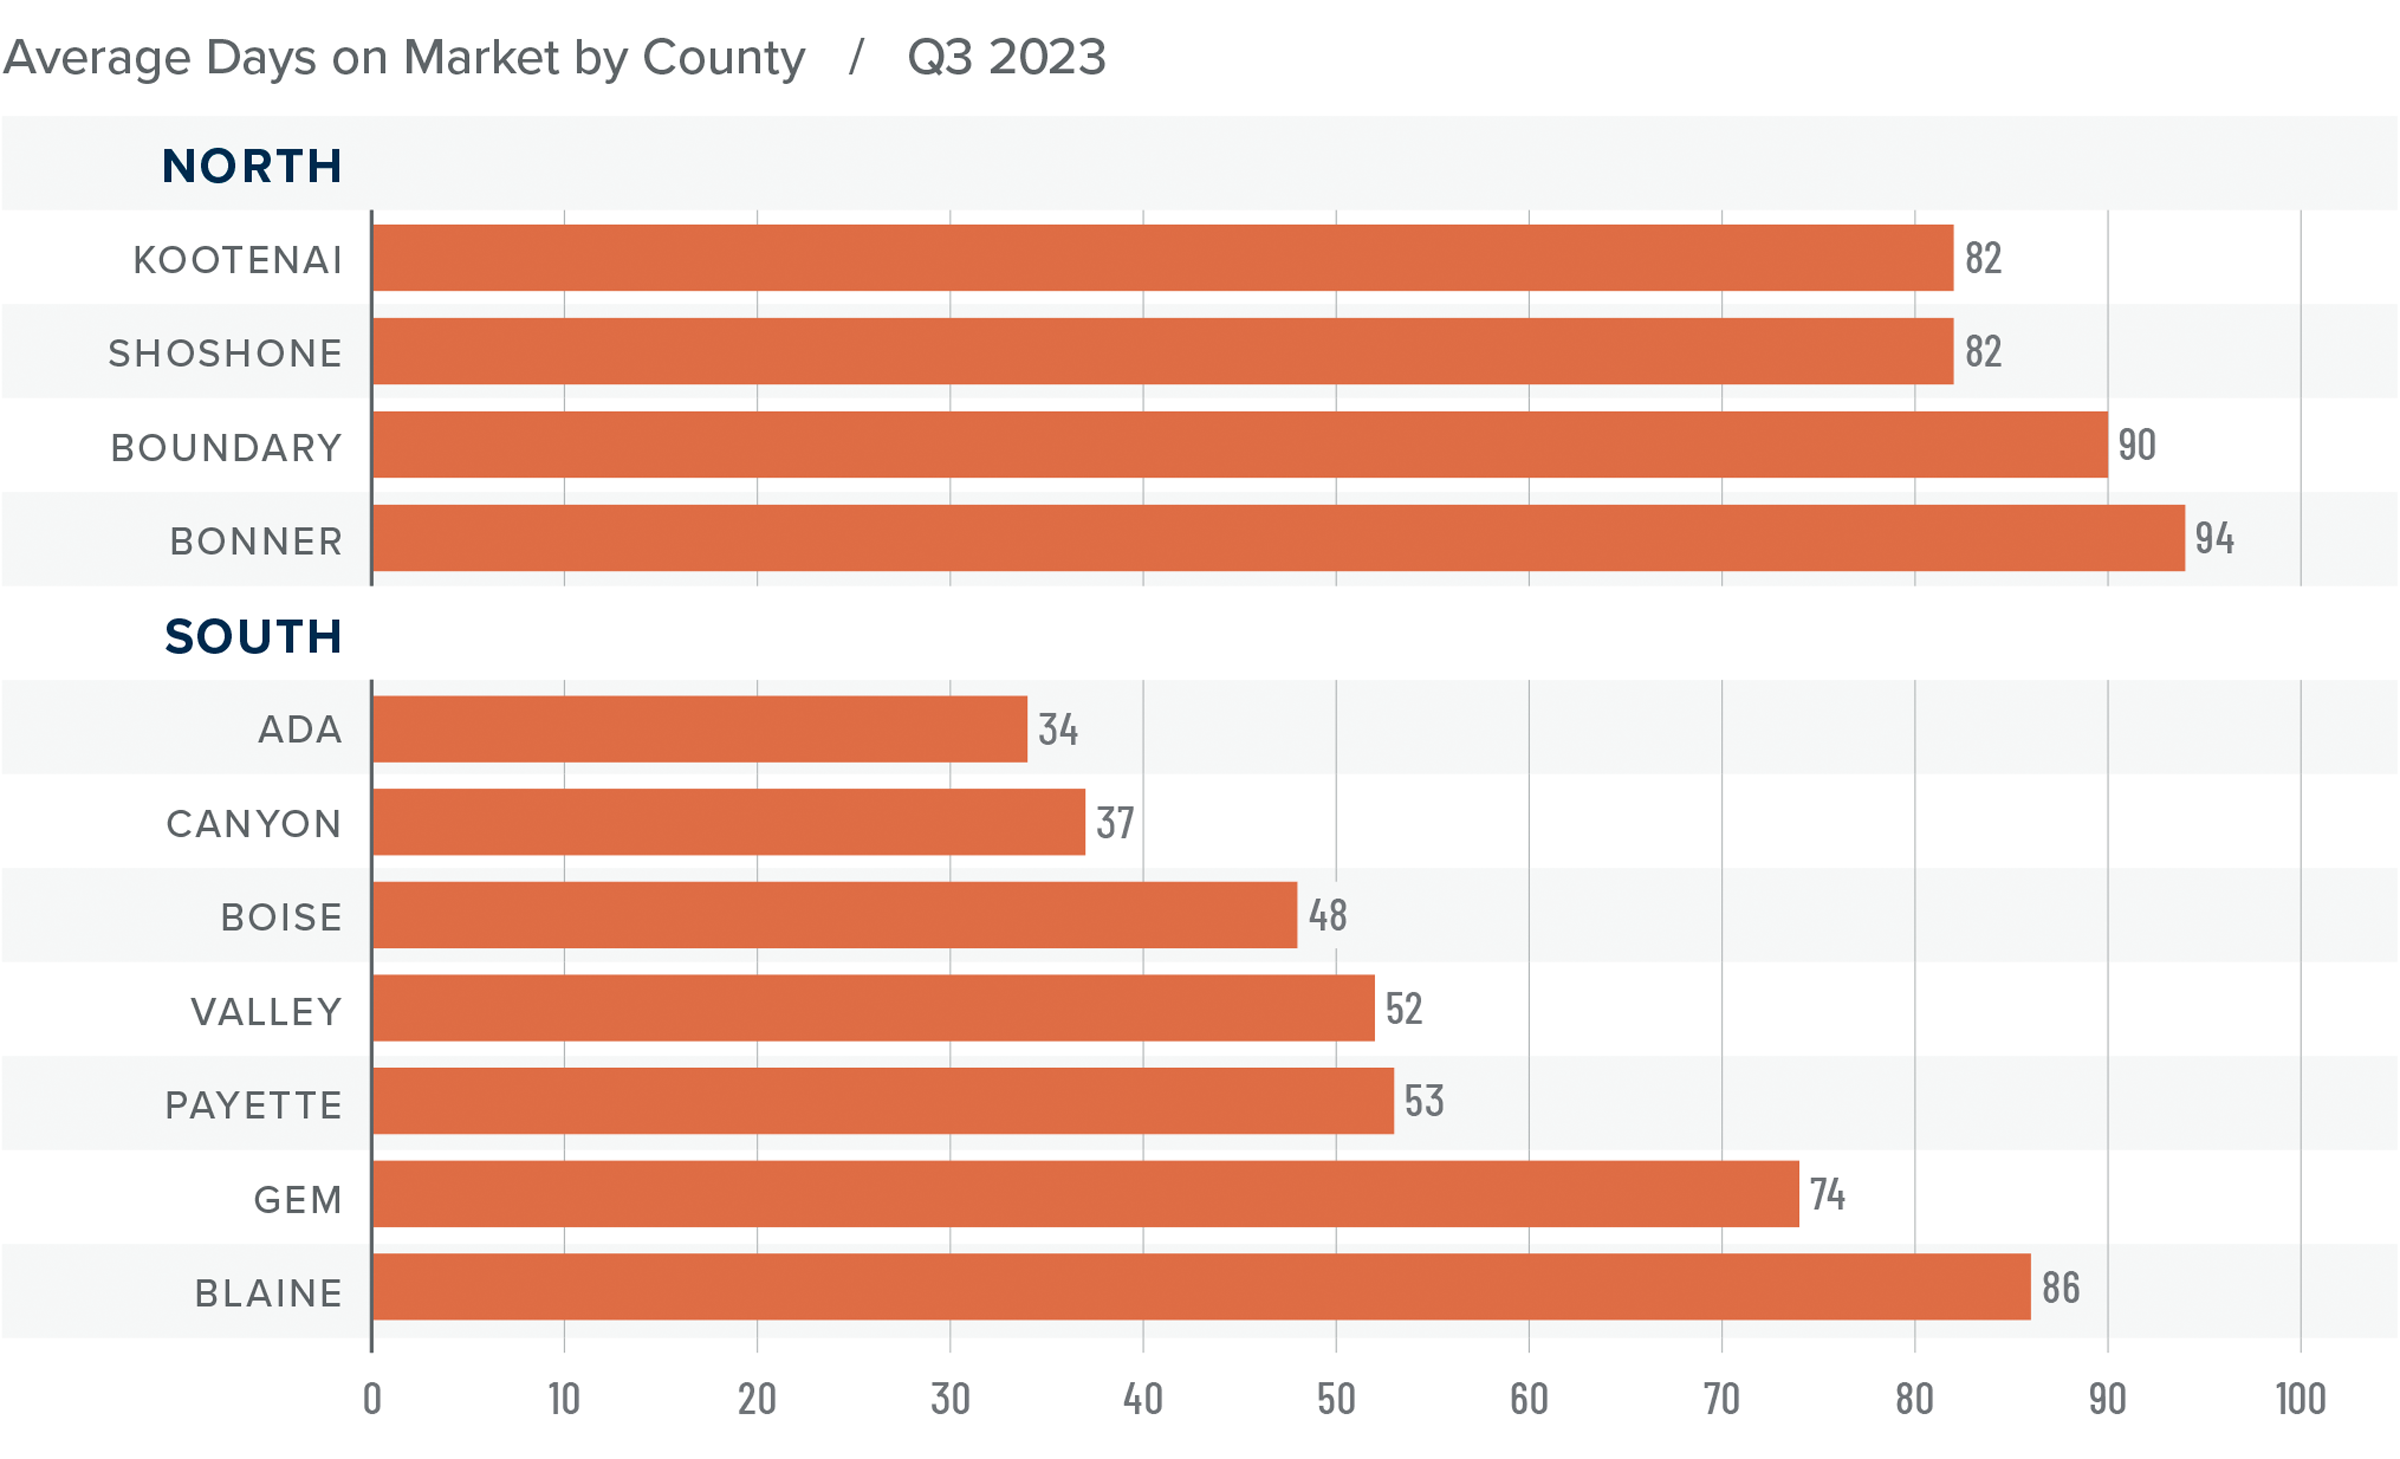
Idaho Days on Market
❱ The average time it took to sell a home in the region rose 16 days compared to the third quarter of 2022. It took an average of nine fewer days for a home to sell than in the second quarter of this year.
❱ In both Northern and Southern Idaho, days on market rose in all counties compared to the same period of 2022. Compared to the second quarter of this year, market time rose in every county in the northern part of the state. In the southern areas, market time fell in all counties except Payette and Gem.
❱ It took an average of 87 days to sell a home in Northern Idaho and 55 days in the southern counties covered by this report.
❱ Homes sold the fastest in Ada County in the southern part of the state. In Northern Idaho, Shoshone and Kootenai counties had the shortest market time.
Conclusions
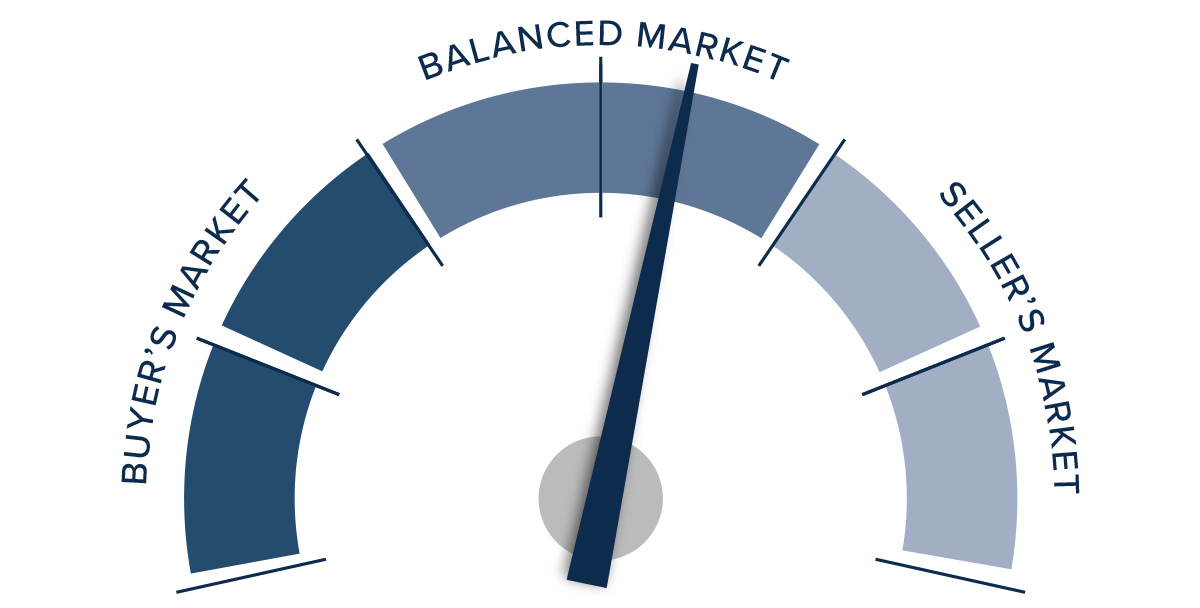
This speedometer reflects the state of the region’s real estate market using housing inventory, price gains, home sales, interest rates, and larger economic factors.
There appears to be a disconnect in the market right now. Pending and closed sales are down while listings are higher, which should favor home buyers. However, list and sale prices are higher, which typically favors sellers.
Given the rapid increases in home prices over the past two years, significantly higher mortgage rates will start impacting the market at some point. The question is when.
All things considered, the market favors neither buyers or sellers. As such, the needle stays in the balanced quadrant, with neither side having the upper hand.
Q3 2023 Central Washington Real Estate Market Update

The following analysis of select counties of the Central Washington real estate market is provided by Windermere Real Estate. We hope that this information may assist you with making better-informed real estate decisions. For further information about the housing market in your area, please don’t hesitate to contact your Windermere Real Estate agent.
Regional Economic Overview
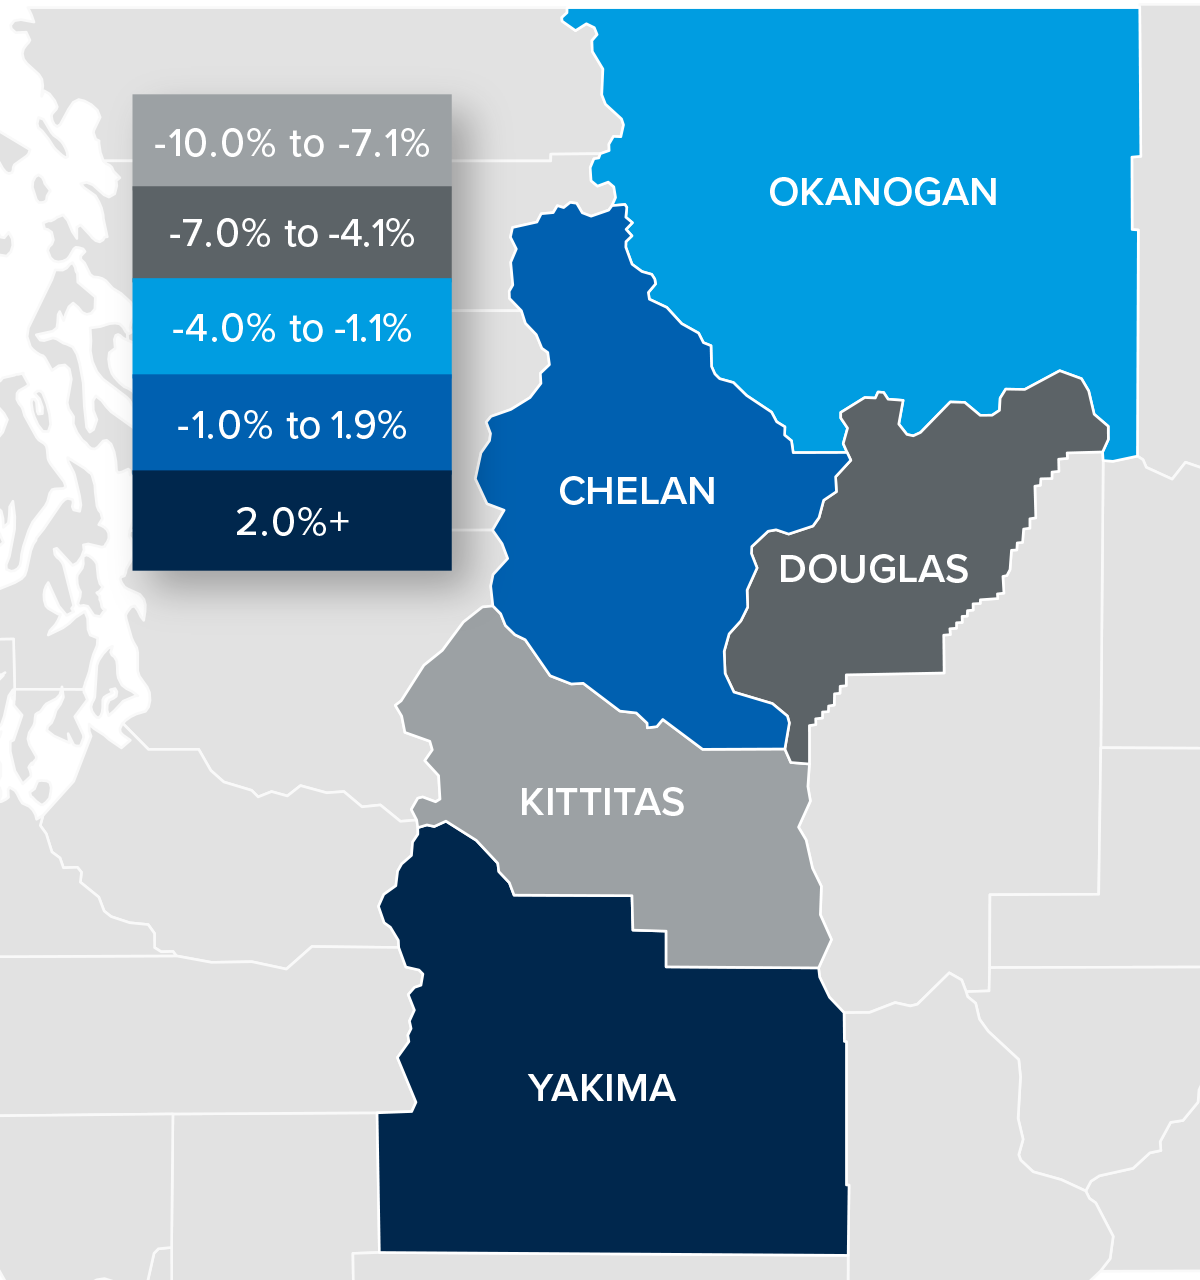
Central Washington job growth ground to a halt, adding only 762 jobs since the third quarter of 2022, which represents a growth rate of .4%. Although Yakima and Douglas counties added jobs (1,900 and 159, respectively), this was offset by employment levels falling in the other three counties.
The seasonally adjusted unemployment rate in Central Washington was 4.9% in the third quarter, matching the level during the same period of 2022. The lowest unemployment rate was in Chelan County at 3.9%. The region’s highest jobless rate was in Kittitas County, where 5.5% of the labor force was without work.
Central Washington Home Sales
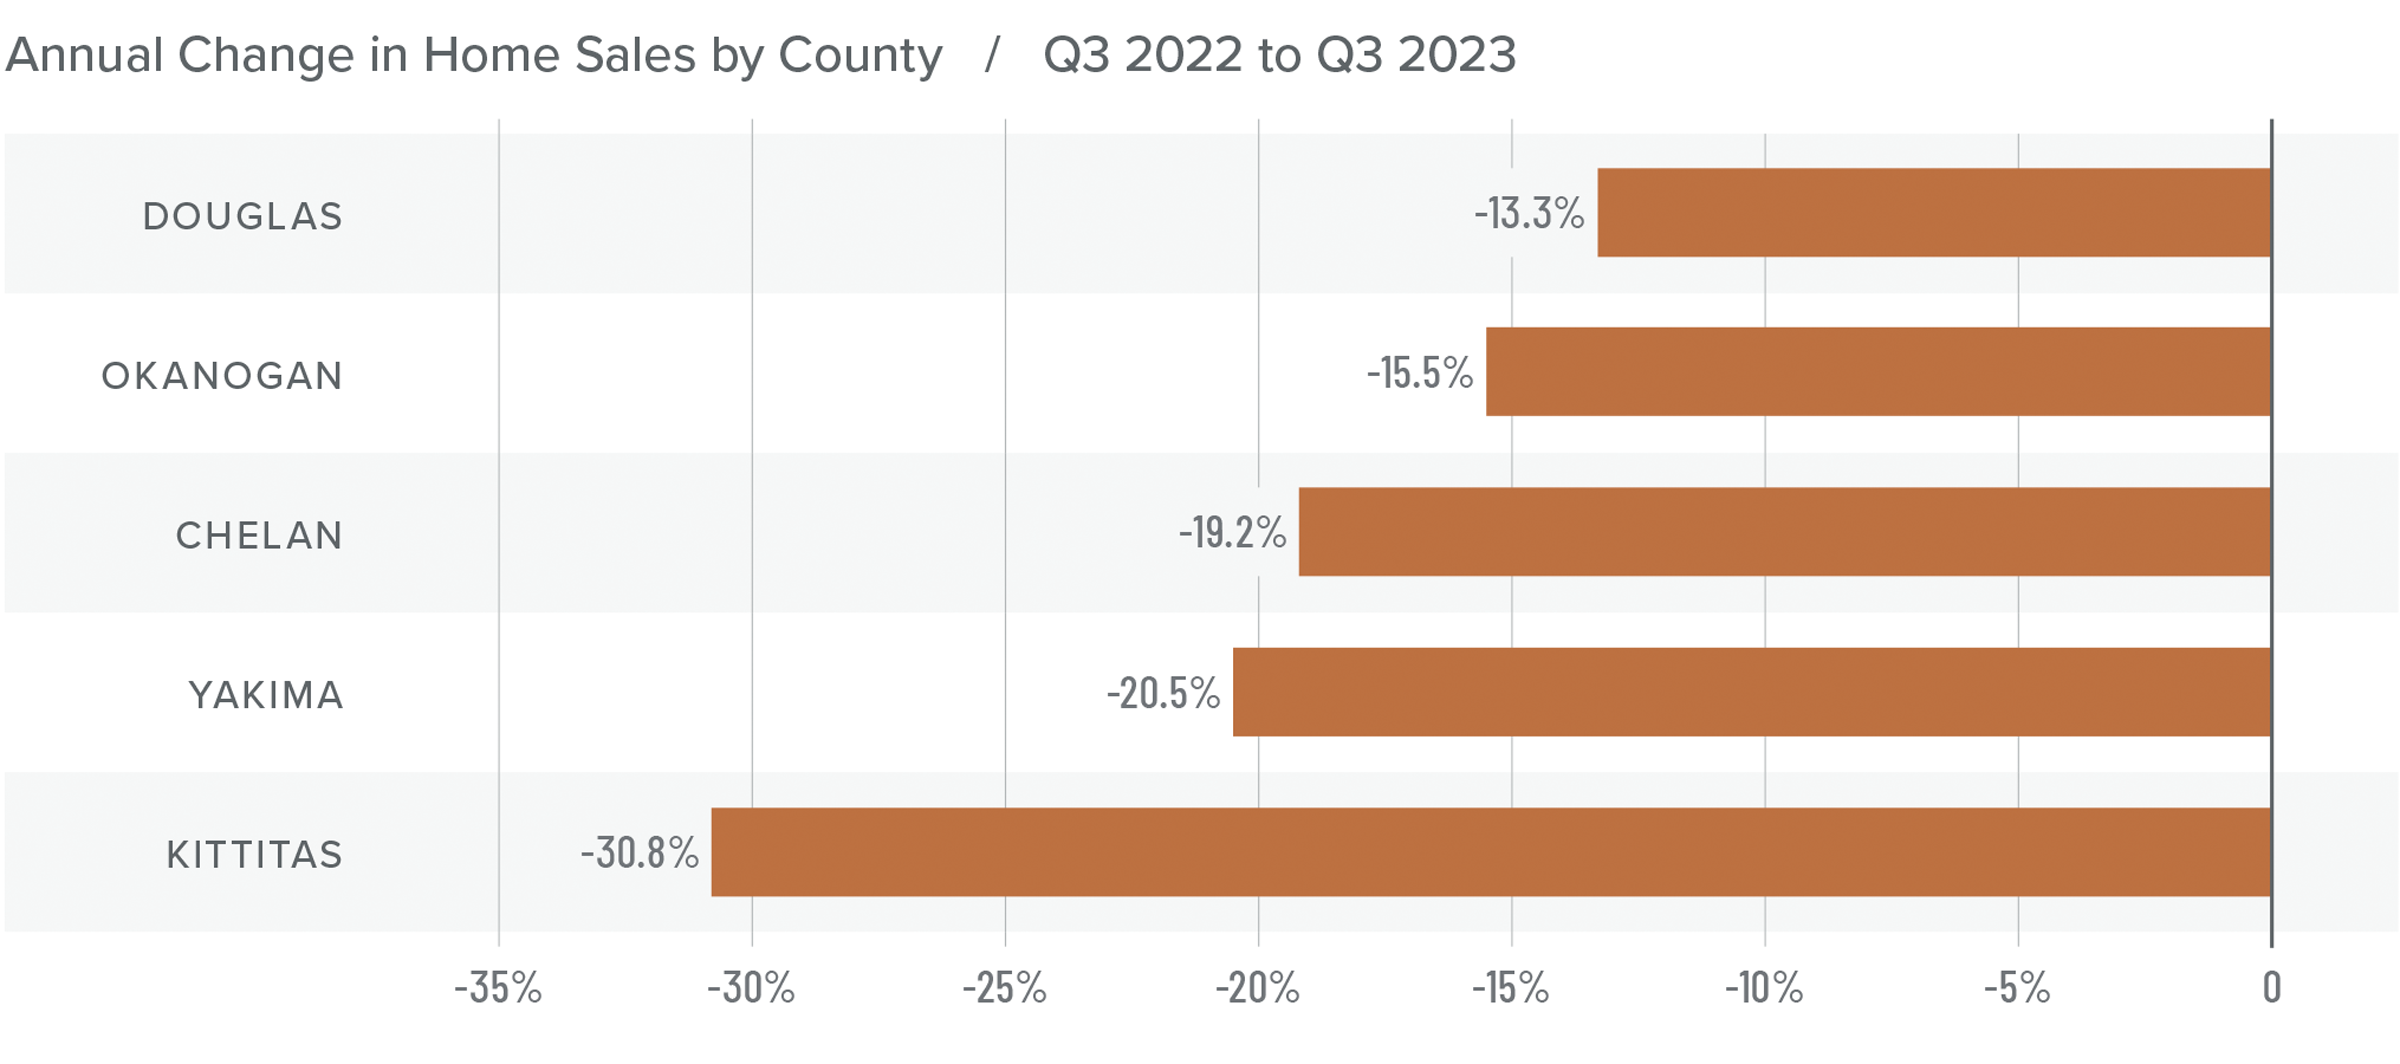
❱ There were 1,131 home sales in Central Washington in the third quarter of 2023, representing a decline of 20.9% from the same quarter in 2022. Sales were 11.1% higher than in the second quarter of this year.
❱ Year over year, sales fell significantly across the board. However, there were solid increases in all counties compared to the second quarter of this year.
❱ Pending sales, an indicator of future closings, were flat compared to the previous quarter, suggesting that market momentum may take a pause in the final quarter of 2023.
❱ Inventory levels were down 17.7% from the second quarter. The market remains remarkably tight, and I do not anticipate any improvement through the end of the year.
Central Washington Home Prices
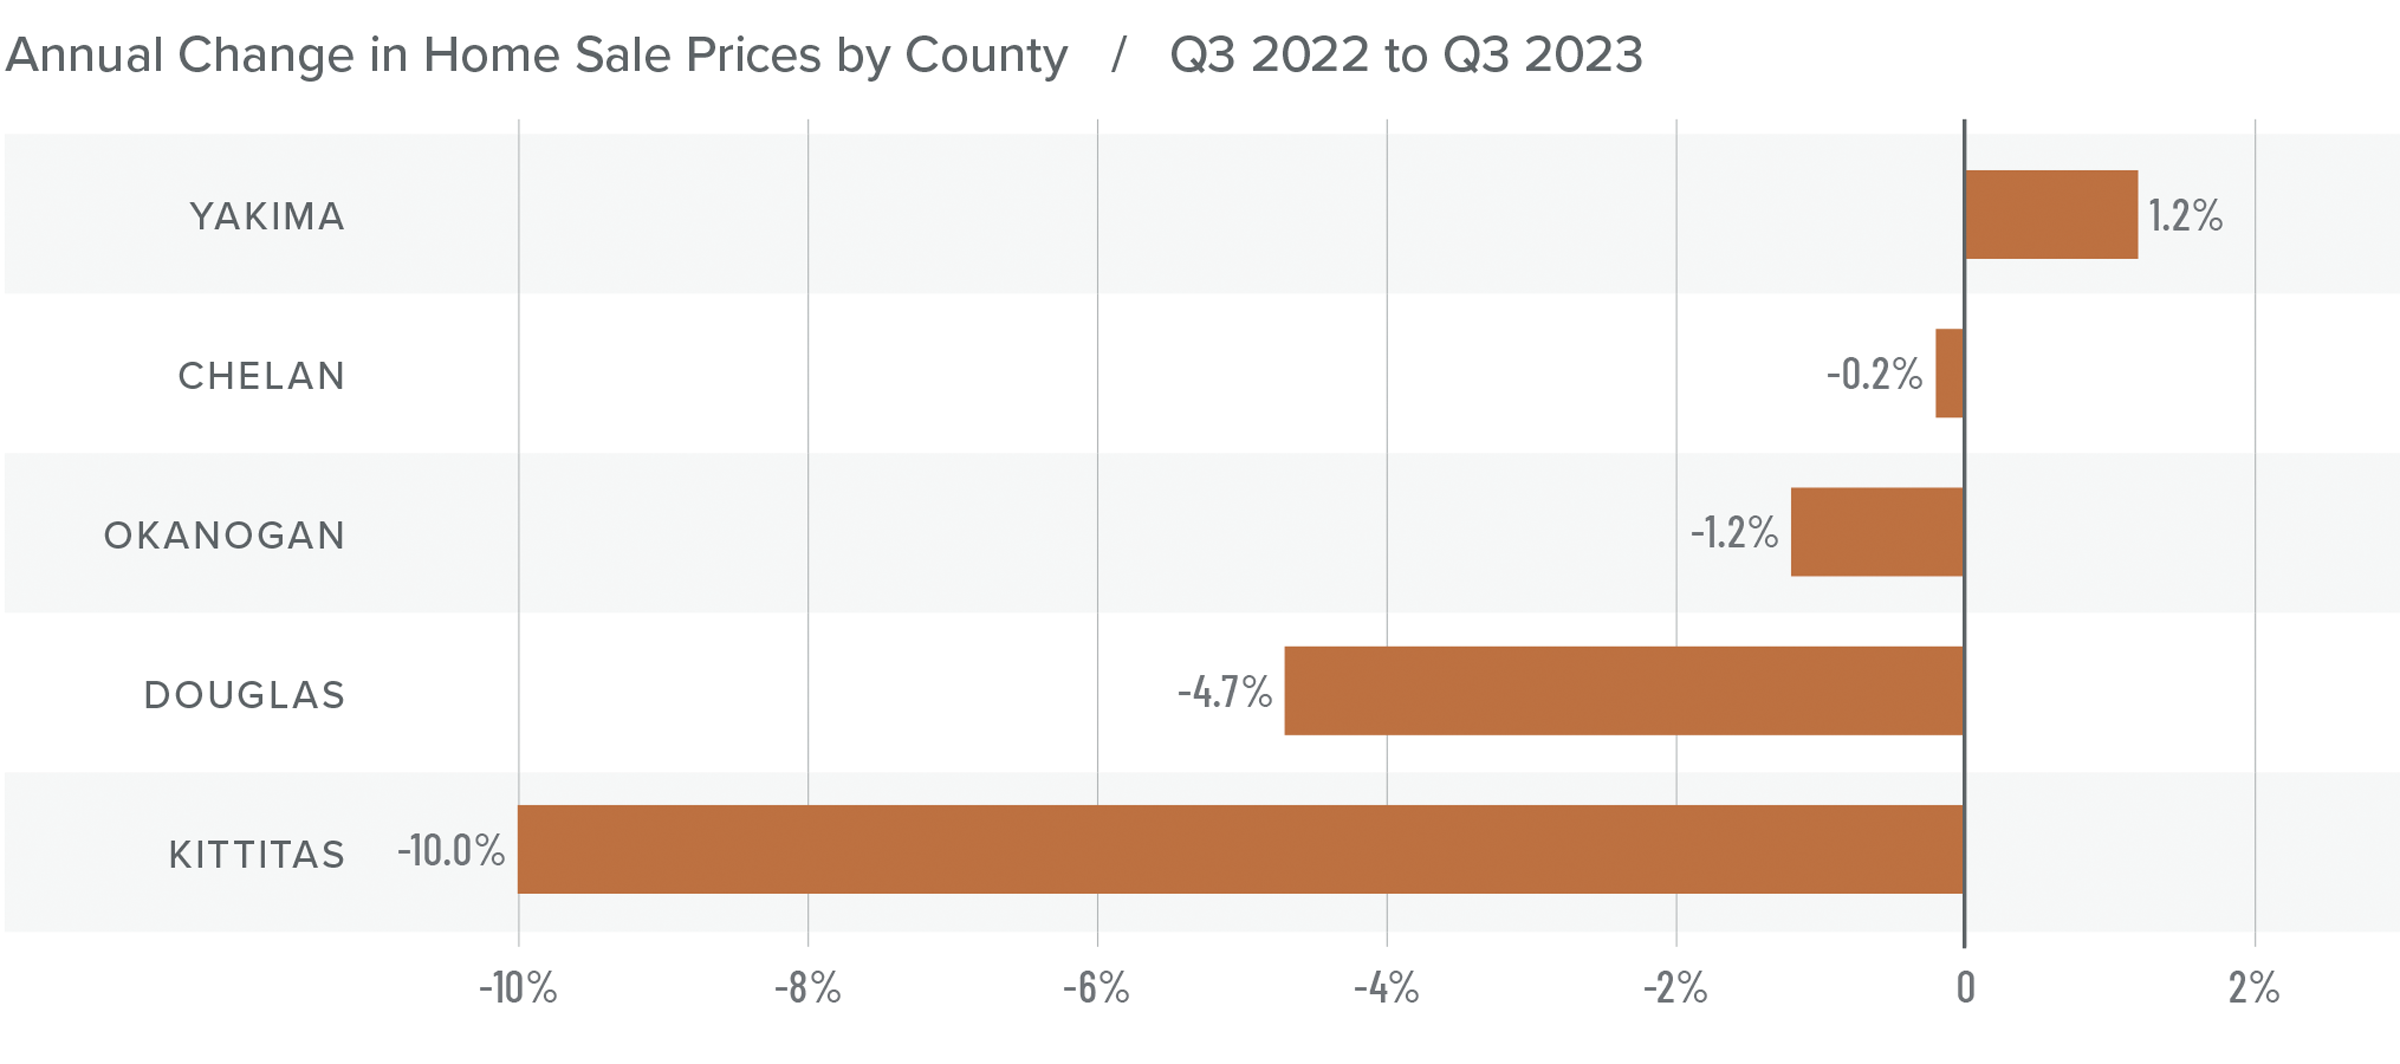
❱ The average home price in Central Washington fell 3.1% year over year to $500,399. Prices were 4.6% higher than in the second quarter of this year.
❱ Compared to the third quarter of 2022, prices fell in every county except Yakima. Compared to the second quarter of this year, prices rose in Okanogan (+1.9%), Yakima (+4%), and Chelan (+13%) counties. Prices fell modestly in Douglas and Kittitas counties, where they were 1.6% and 2.8% lower, respectively.
❱ Median list prices rose in Yakima and Douglas counties but fell in the rest of the markets compared to the second quarter of the year. It seems that sellers may be starting to respond to the far higher mortgage rates that buyers are facing.
❱ Inventory levels remain remarkably low, which is supporting home values. But the market is starting to be impacted by the highest mortgage rates we’ve seen in over two decades. This means market conditions are apt to be somewhat muted during the fall and winter months.
Mortgage Rates
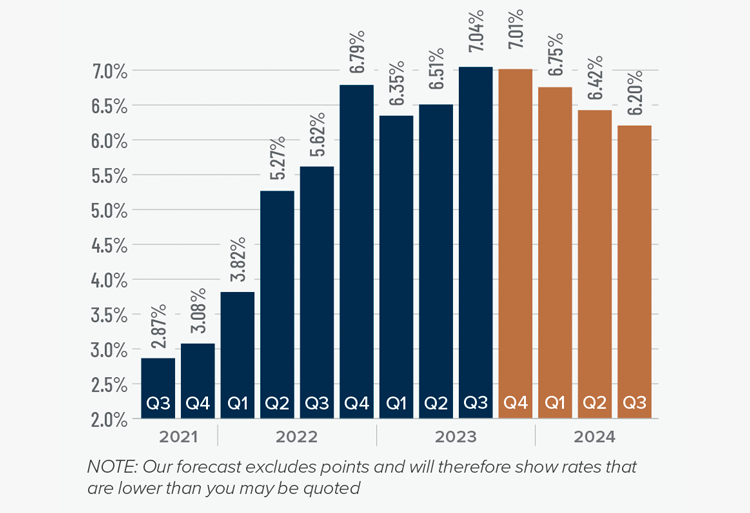
Mortgage rates continued trending higher in the third quarter of 2023 and are now at levels we have not seen since the fall of 2000. Mortgage rates are tied to the interest rate (yield) on 10-year treasuries, and they move in the opposite direction of the economy. Unfortunately for mortgage rates, the economy remains relatively buoyant, and though inflation is down significantly from its high, it is still elevated. These major factors and many minor ones are pushing Treasury yields higher, which is pushing mortgage rates up. Given the current position of the Federal Reserve, which intends to keep rates “higher for longer,” it is unlikely that home buyers will get much reprieve when it comes to borrowing costs any time soon.
With such a persistently positive economy, I have had to revise my forecast yet again. I now believe rates will hold at current levels before starting to trend down in the spring of next year.
Central Washington Days on Market
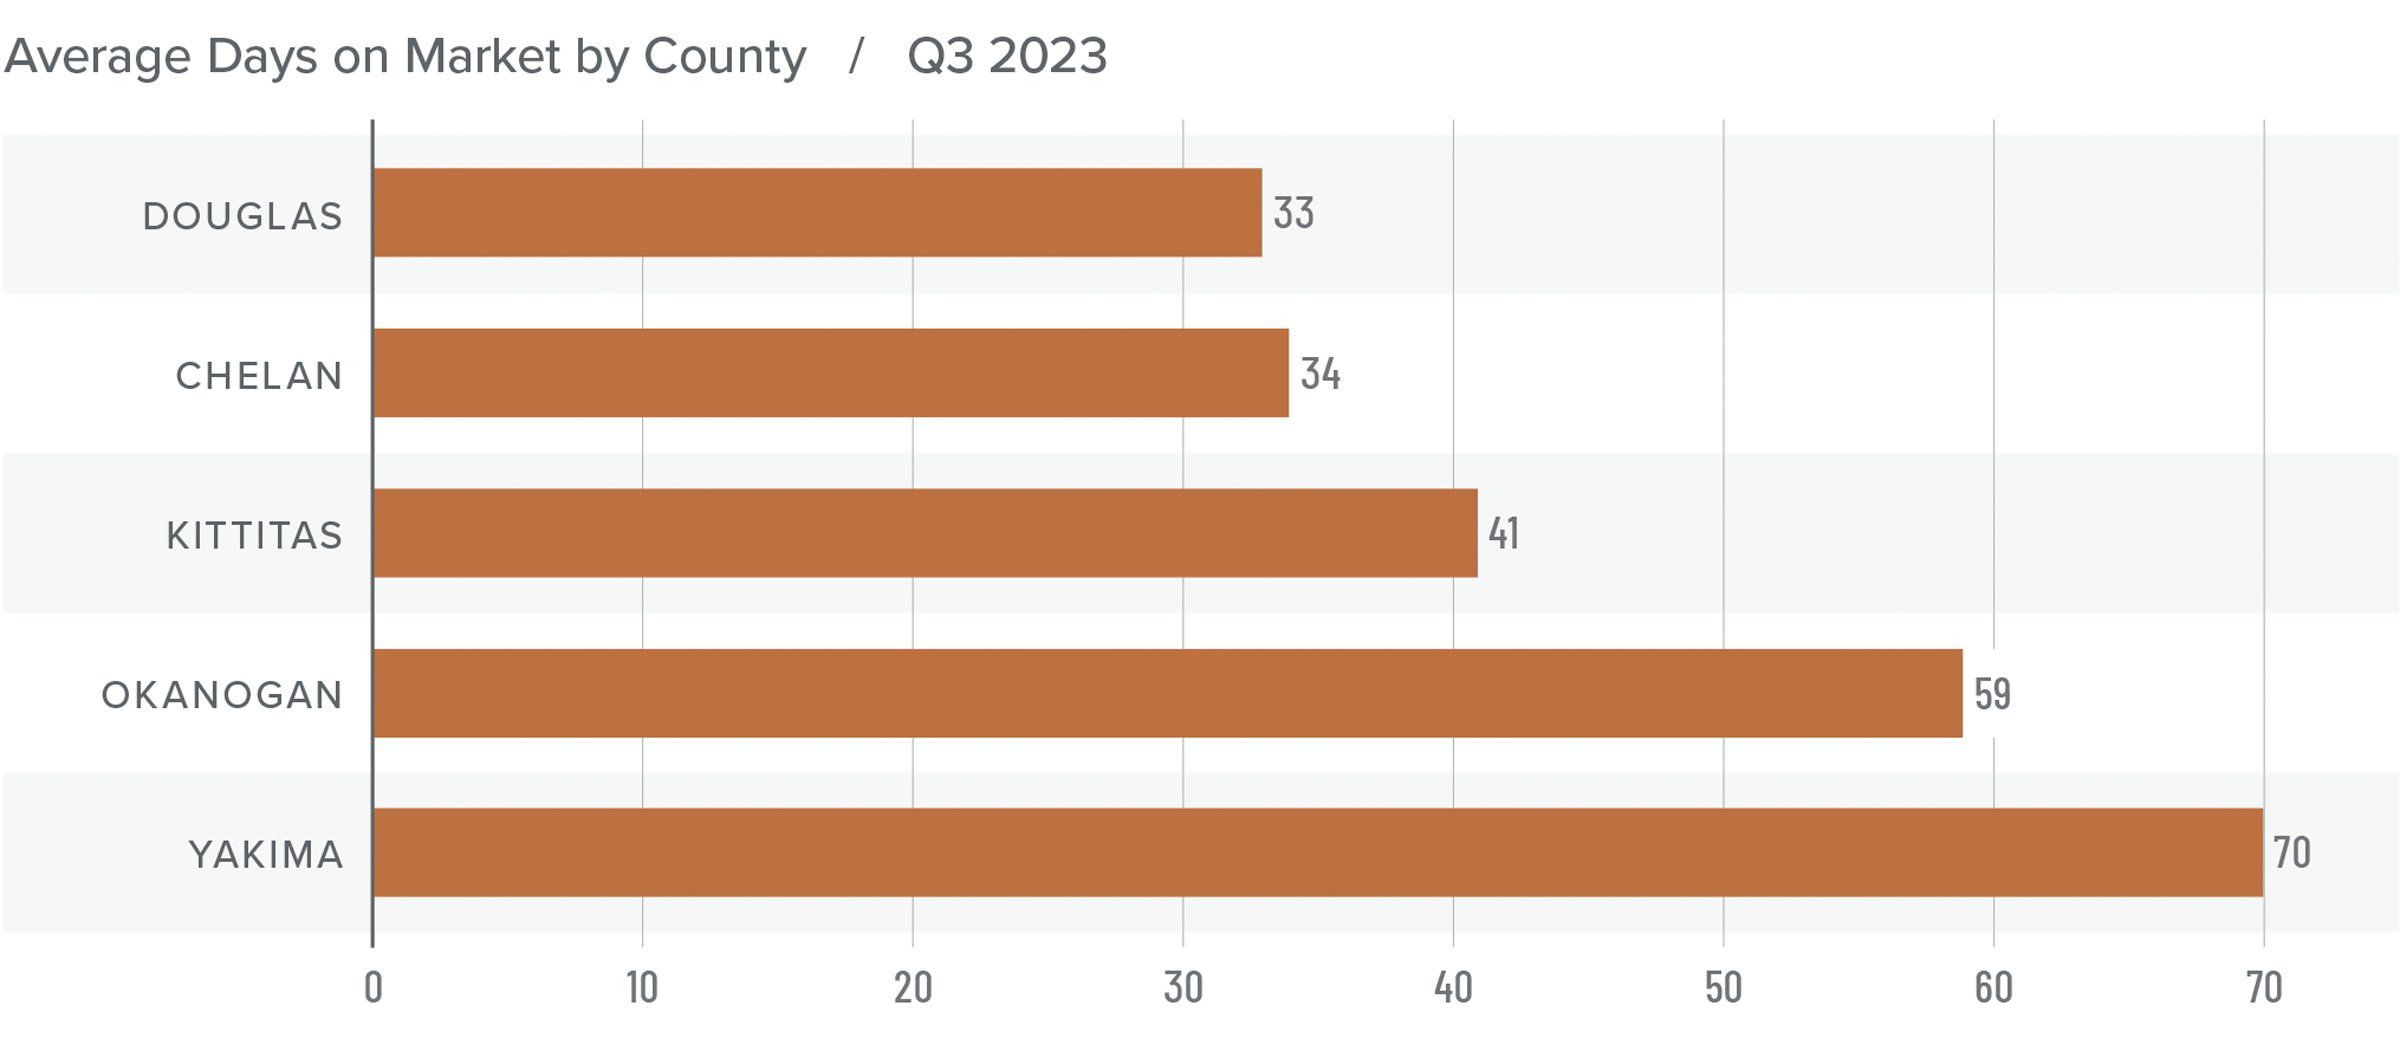
❱ The average time it took to sell a home in Central Washington in the third quarter of 2023 was 47 days.
❱ Average market time rose in all counties year over year, but fell in every county other than Kittitas compared to the second quarter of 2023.
❱ It took ten more days to sell a home in Central Washington than it did during the third quarter of 2022.
❱ On average, it took six fewer days to sell a home in the third quarter of 2023 than it did in the second.
Conclusions
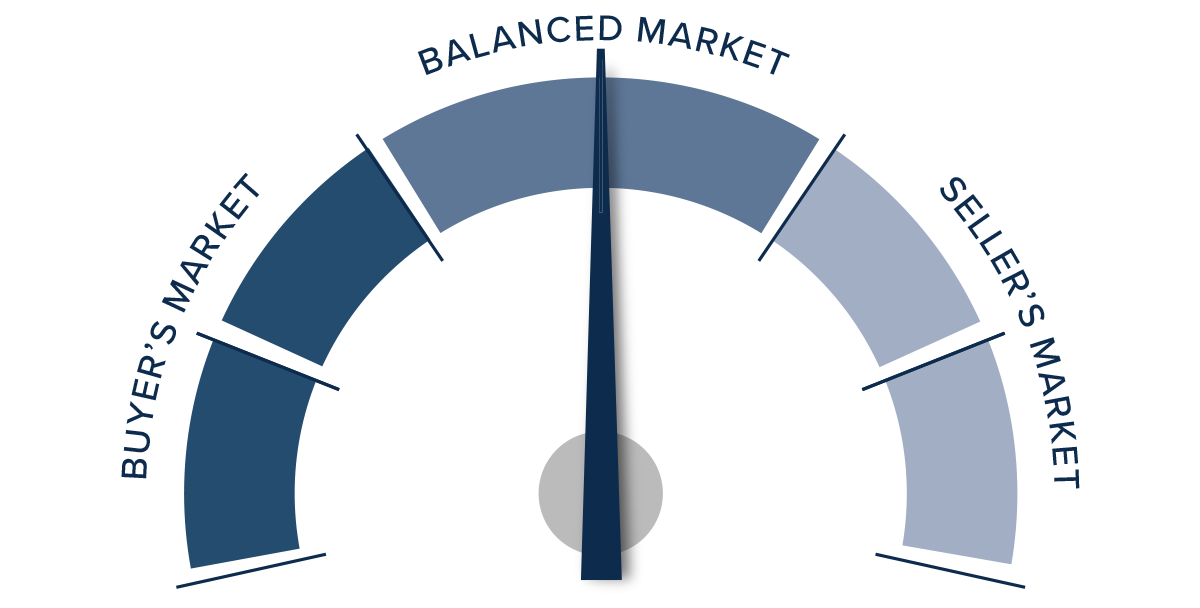
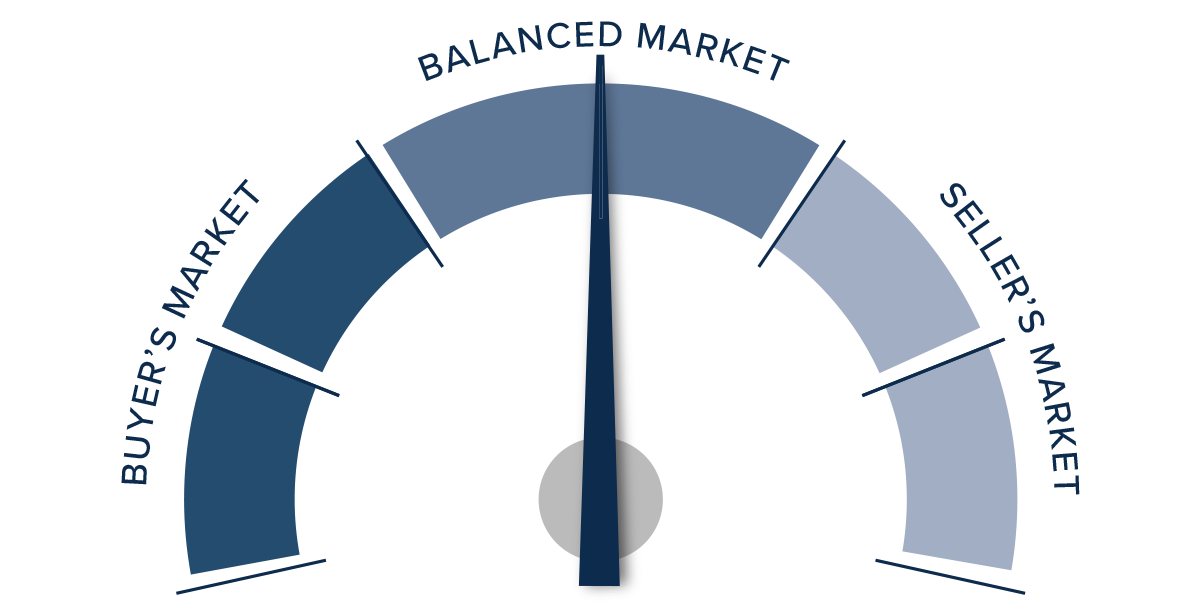
This speedometer reflects the state of the region’s real estate market using housing inventory, price gains, home sales, interest rates, and larger economic factors.
Listing activity declined across the region, but this was due to a major drop in the number of homes for sale in Yakima County. All other areas saw inventory levels rise. Furthermore, while list prices were up 16% from the second quarter on a regional level, they were modestly lower in Okanogan, Chelan, and Kittitas counties.
In all, this makes for a somewhat confusing market where it’s unclear whether buyers or sellers have the upper hand.
Far higher mortgage rates combined with declining affordability may have factored into sellers lowering their asking prices in some counties. This should favor home buyers, but low inventory levels give sellers a bit of an advantage. Ultimately, the market is currently lacking direction. Therefore, the needle swings back toward the middle.
Q3 2023 Eastern Washington Real Estate Market Update

The following analysis of select counties of the Eastern Washington real estate market is provided by Windermere Real Estate. We hope that this information may assist you with making better-informed real estate decisions. For further information about the housing market in your area, please don’t hesitate to contact your Windermere Real Estate agent.
Regional Economic Overview
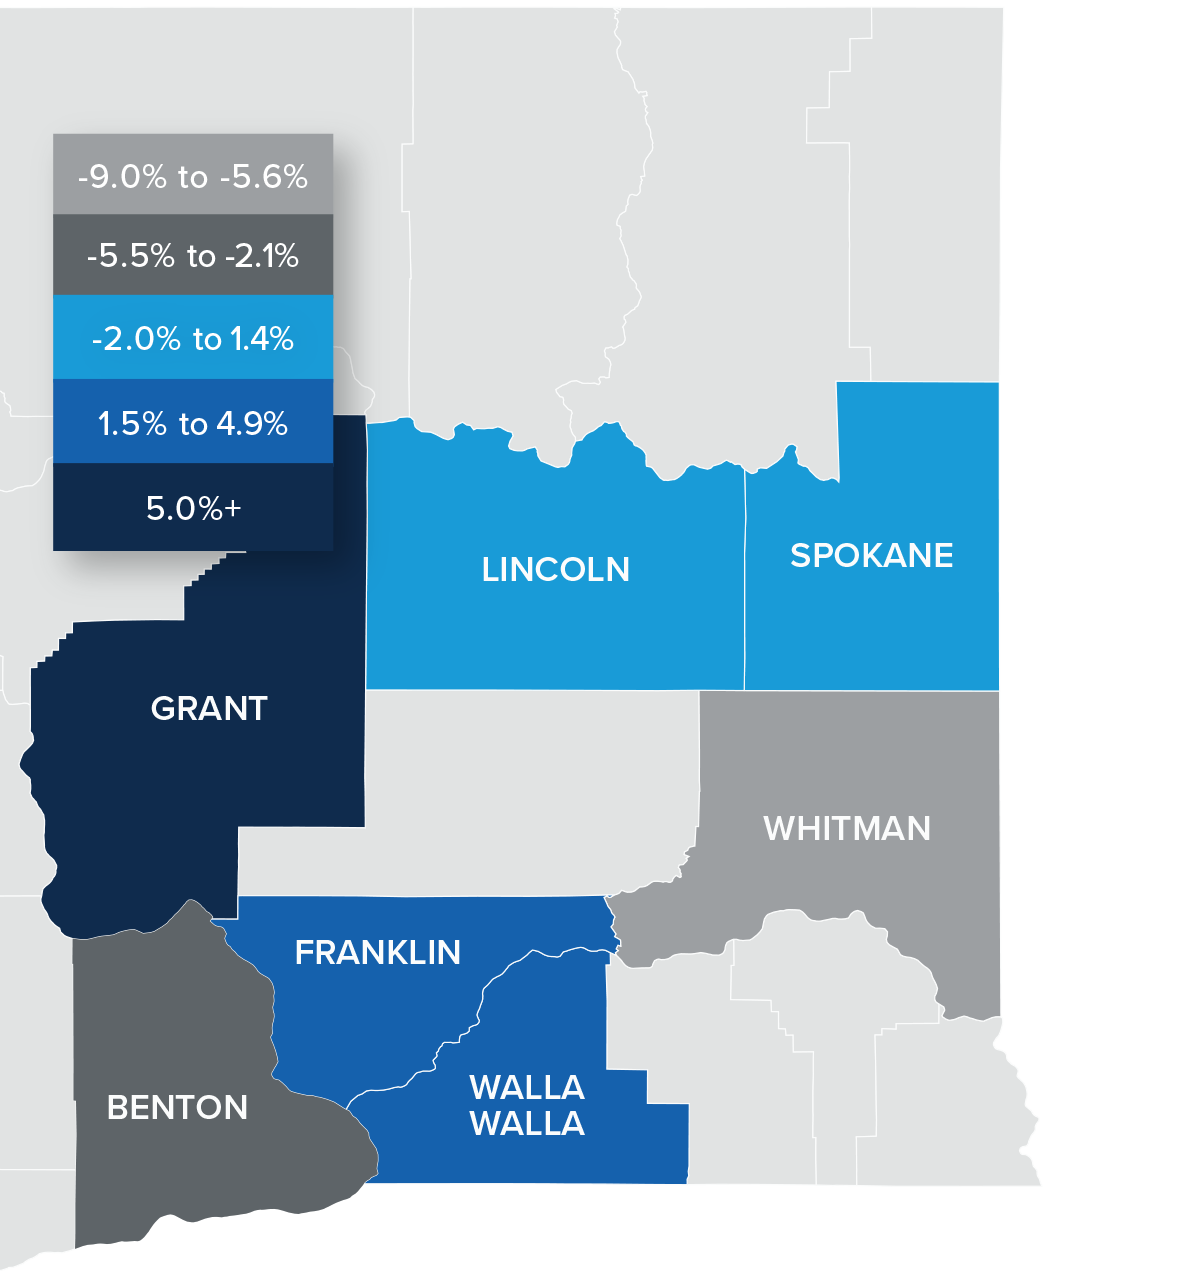
Year over year, Eastern Washington gained 4,515 jobs, representing a significant slowdown from the pace of growth during the post-pandemic recovery. On a percentage basis, the region’s job market grew by only .9%. The fastest growing county was Spokane, where employment rose 2.2%. This was followed by Walla Walla (+1.4%) and Benton (+1.1%) counties. Employment growth was negative in the rest of the markets contained in this report.
Unadjusted for seasonality, the regional unemployment rate was 4.2%, which is down from 5.2% during the same period in 2022. When seasonally adjusted, the jobless rate was 4.4%, which was down from 5.5% at the same time in 2022.
Eastern Washington Home Sales
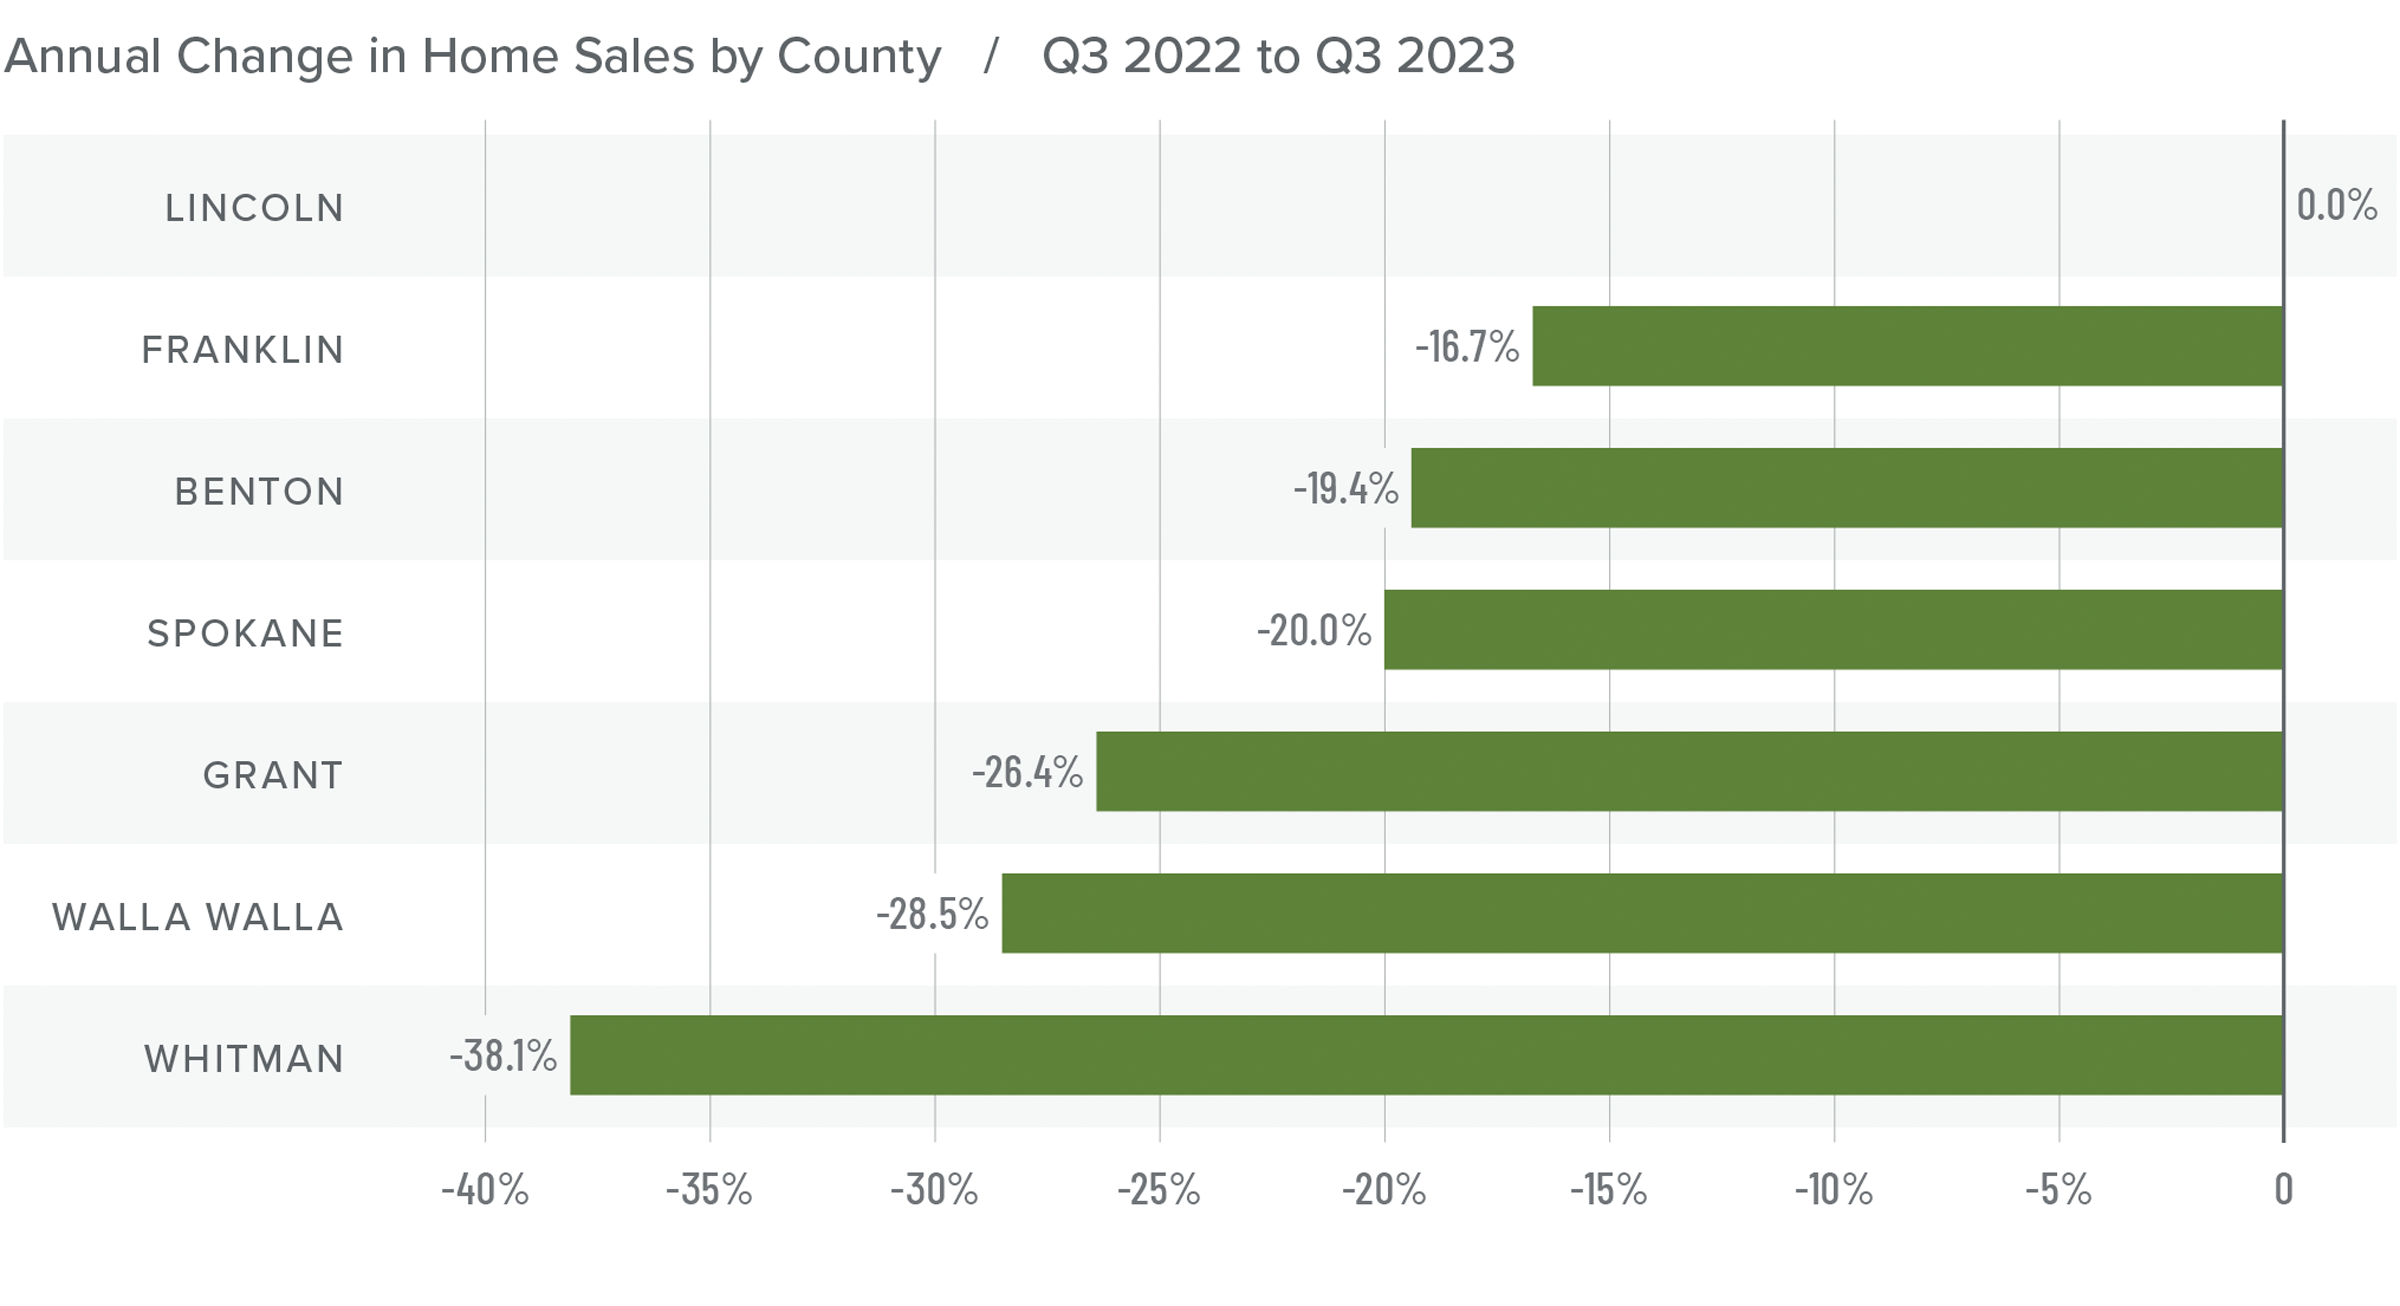
❱ In the third quarter of 2023, 2,647 homes sold. This was 21.2% lower than in the third quarter of 2022 but was up 1.8% compared to the second quarter of this year.
❱ The modest increase in sales may be attributable to the 35% increase in the number of homes for sale. Even more impressive was that sales grew in the face of significantly higher mortgage rates.
❱ Year over year, sales fell across the region except in Lincoln County, where they were flat. However, compared to the second quarter of this year, sales were higher in Spokane, Benton, and Franklin counties.
❱ Pending sales fell 6.8%, which suggests that sales were likely pulled forward due to rising interest rates and that closings in the final quarter of 2023 may also be down.
Eastern Washington Home Prices
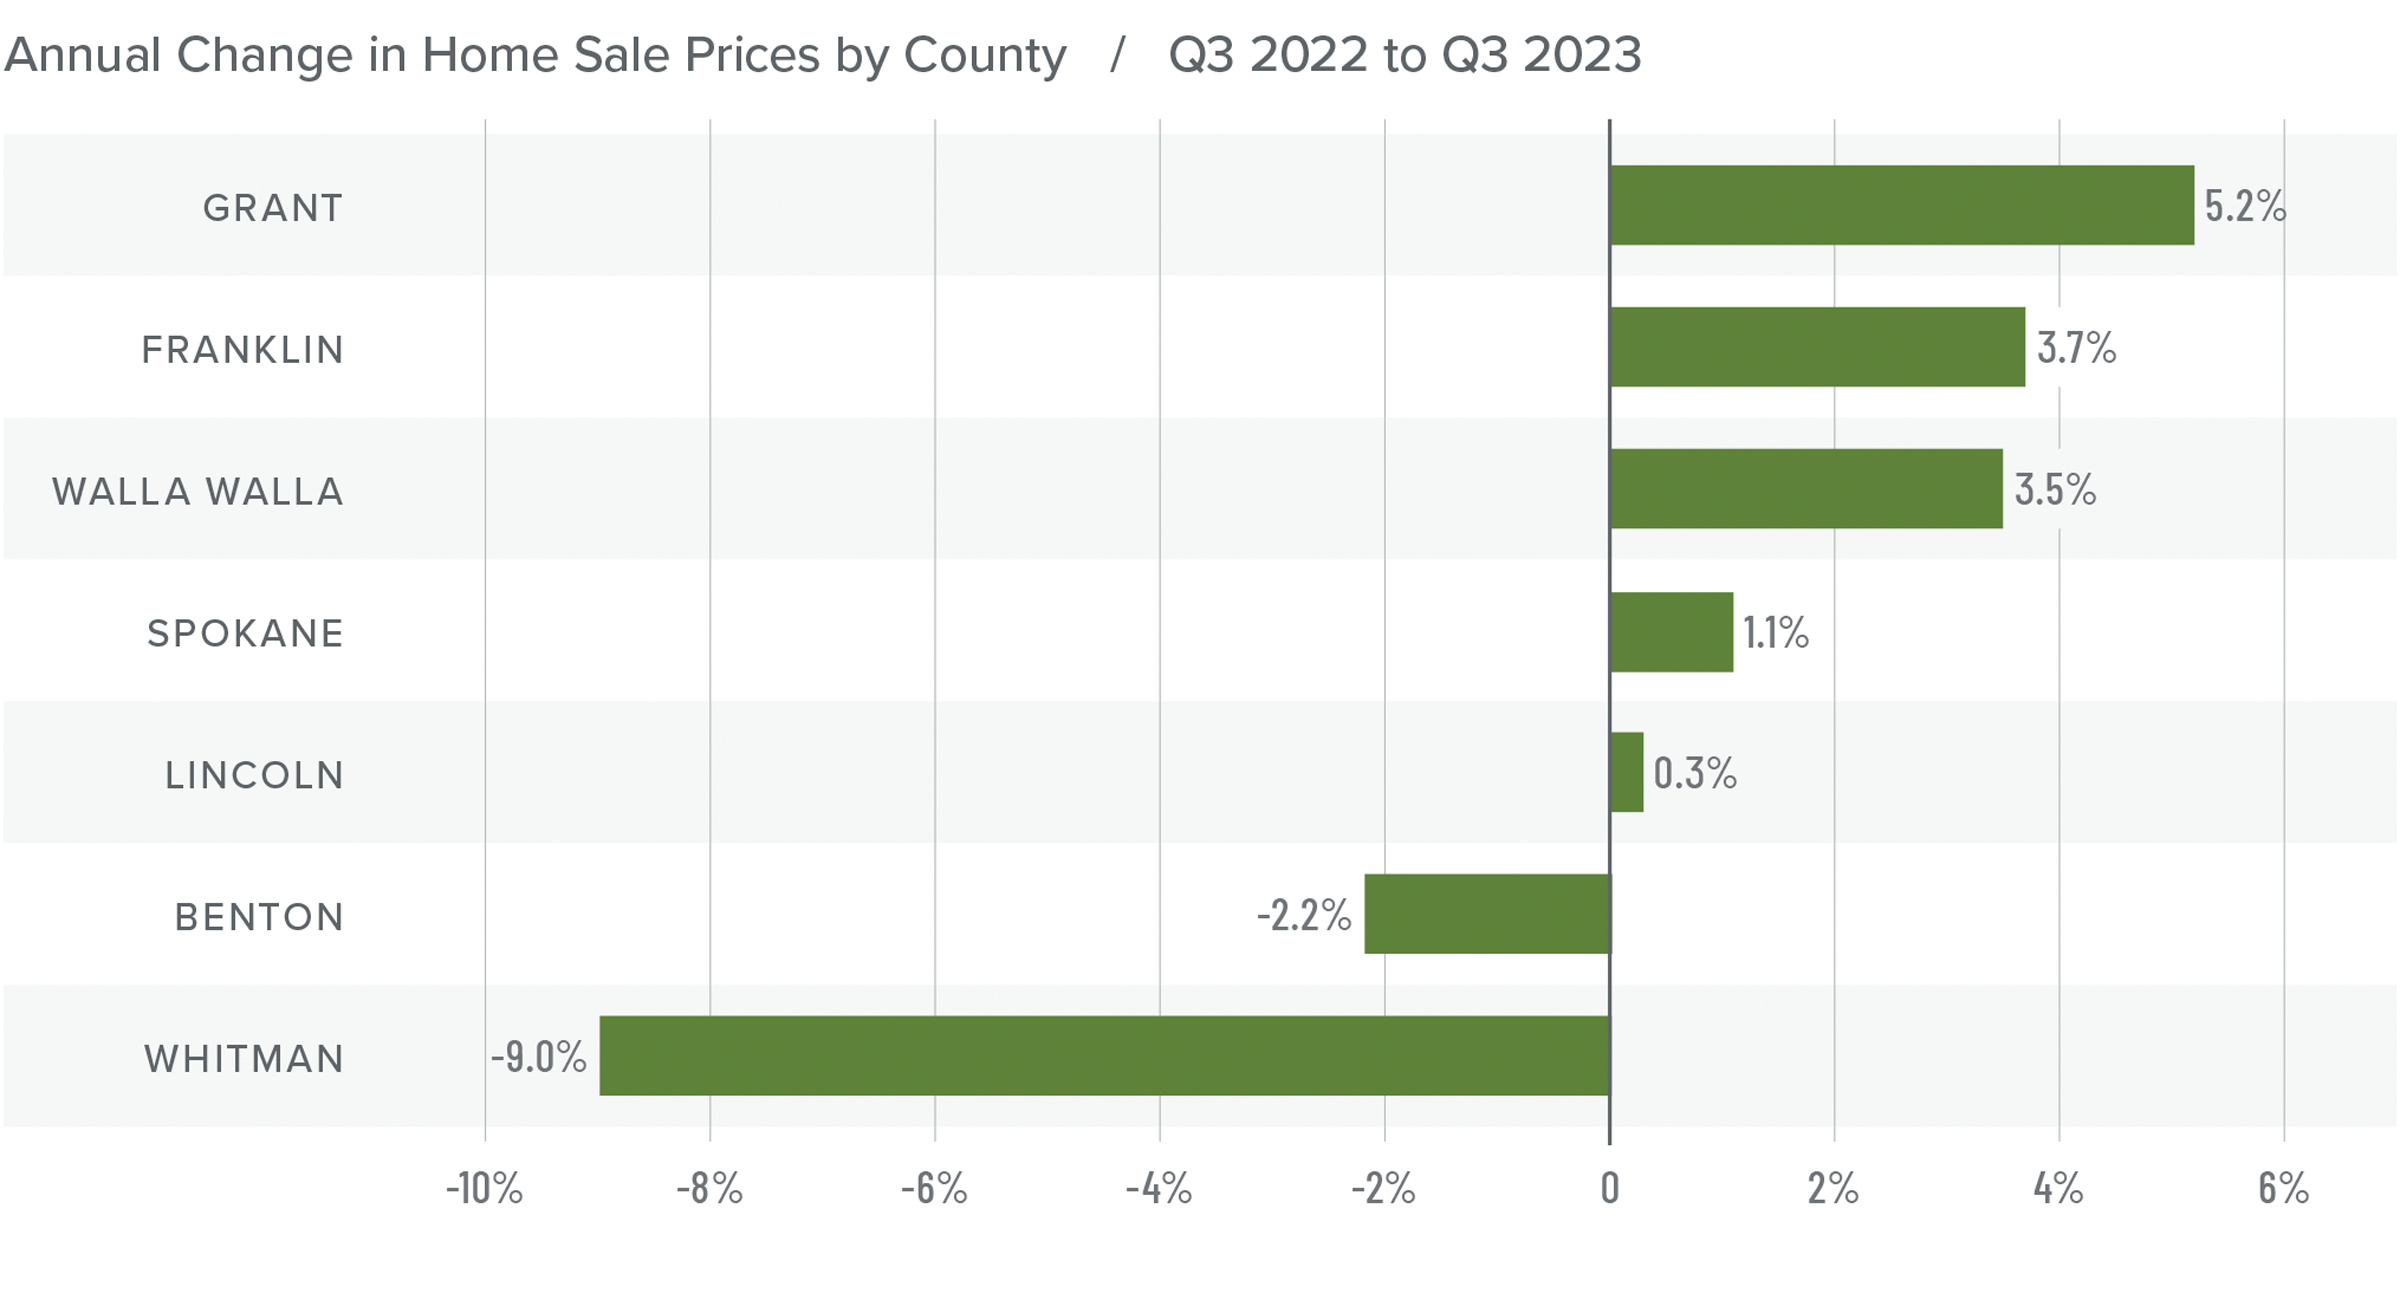
❱ Year over year, the average home price in Eastern Washington rose .8% to $466,007. Prices rose 3.4% compared to the second quarter of 2023.
❱ Of note was that median list prices rose 4.4% between the second and third quarters of this year. Sellers still appear to be confident in the value of their homes despite mortgage rates that are at their highest levels in over two decades.
❱ Prices rose in five of the counties contained in this report but fell in two when compared to the same period in 2022. The same was true for quarterly growth, with average prices rising in every county other than Whitman and Walla Walla.
❱ Though home price growth was positive, it has certainly slowed. Some of this may be attributable to increased supply levels, but I believe that mortgage rates are acting as the most significant headwind. I expect price growth to slow further as we enter the final quarter of the year, and there’s a possibility it will turn negative across the region.
Mortgage Rates
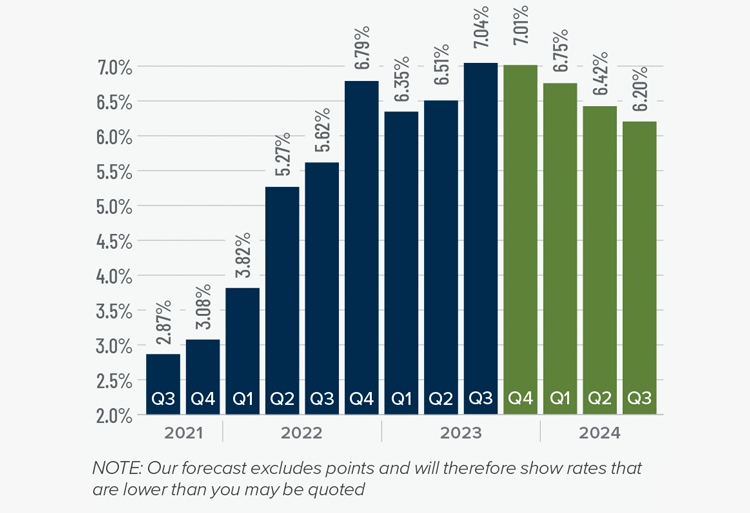
Mortgage rates continued trending higher in the third quarter of 2023 and are now at levels we have not seen since the fall of 2000. Mortgage rates are tied to the interest rate (yield) on 10-year treasuries, and they move in the opposite direction of the economy. Unfortunately for mortgage rates, the economy remains relatively buoyant, and though inflation is down significantly from its high, it is still elevated. These major factors and many minor ones are pushing Treasury yields higher, which is pushing mortgage rates up. Given the current position of the Federal Reserve, which intends to keep rates “higher for longer,” it is unlikely that home buyers will get much reprieve when it comes to borrowing costs any time soon.
With such a persistently positive economy, I have had to revise my forecast yet again. I now believe rates will hold at current levels before starting to trend down in the spring of next year.
Eastern Washington Days on Market
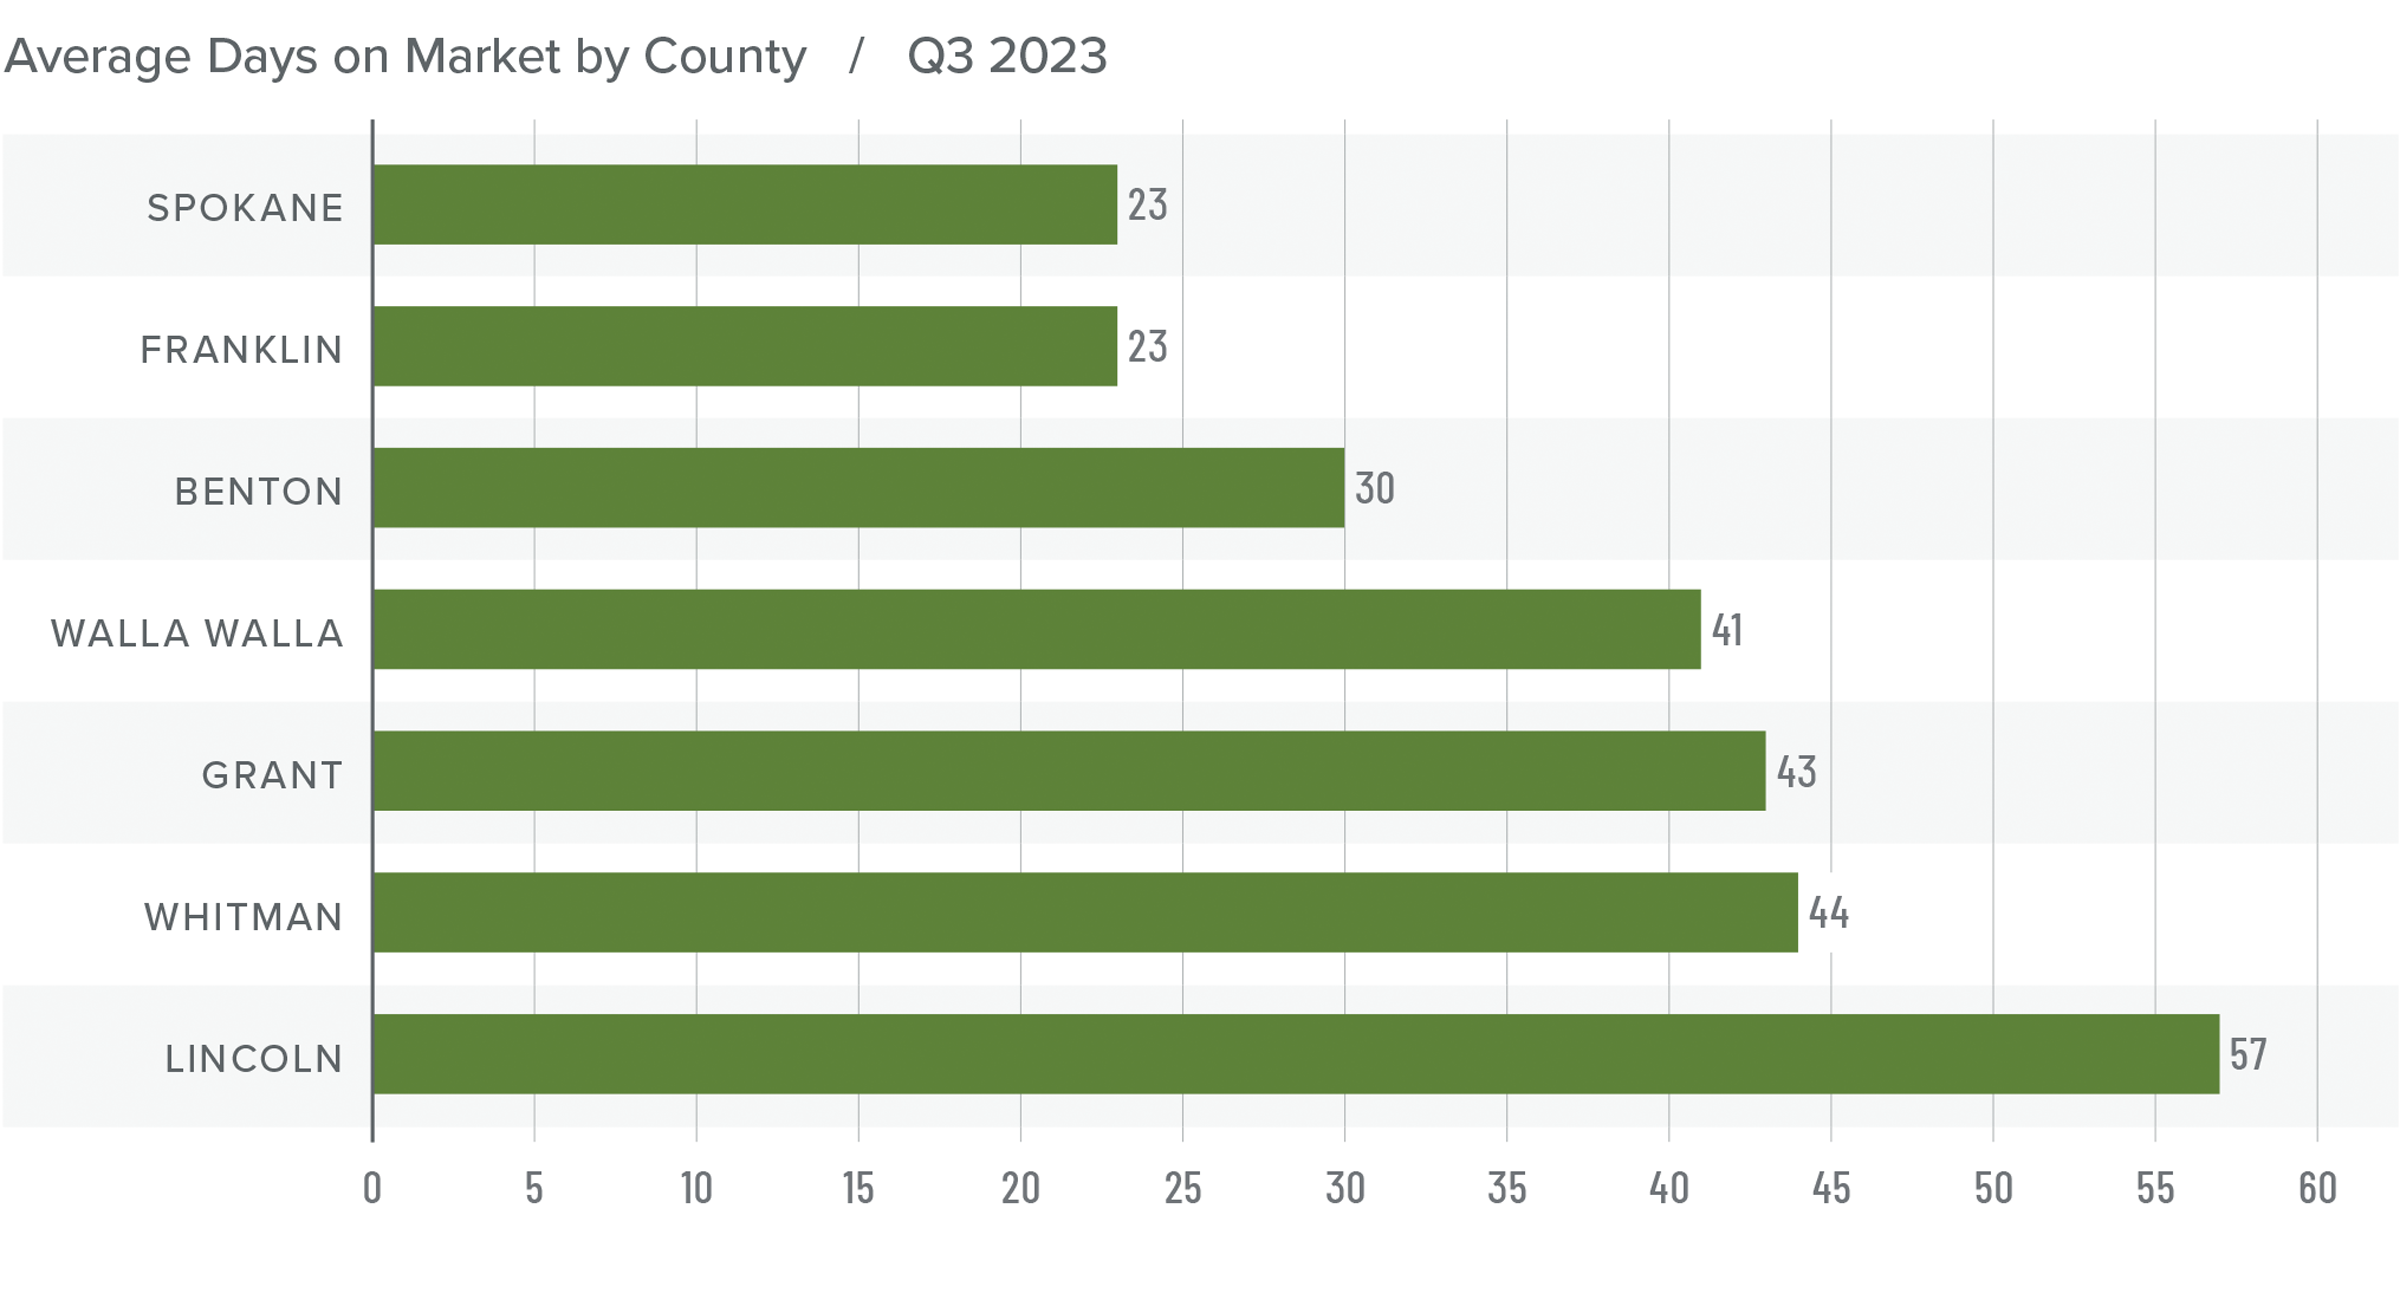
❱ The average time it took to sell a home in Eastern Washington in the third quarter of 2023 was 37 days, which is 13 more days than during the same period of 2022.
❱ Compared to the second quarter of this year, average days on market fell in Grant, Lincoln, Franklin, and Whitman counties but rose in the rest of the markets. In aggregate, market time was down by one day.
❱ All counties saw market time rise compared to the same period in 2022.
❱ Buyers were still actively looking during the quarter, but they were a little choosier than they have been due to there being more homes for sale.
Conclusions
This speedometer reflects the state of the region’s real estate market using housing inventory, price gains, home sales, interest rates, and larger economic factors.
The market appears to be in a period of transition. Although sales were still happening, the pace of growth during the third quarter was modest. Moreover, listing inventory has risen significantly, which favors home buyers who are faced with decades-high mortgage rates.
Home sale prices were higher and asking prices were up significantly, which is a little counterintuitive given where mortgage rates are sitting. Sellers appear to still be confident.
The market is clearly in a state of flux and will likely continue to be in the coming
months. Buyers are hoping that mortgage rates have peaked, and may even come down by the new year, which is leading to a lot of fence-sitters.

As such, the needle moves back
a little from sellers, but it remains in the
balanced quadrant, as neither side has an
overriding advantage.
Q3 2023 Colorado Real Estate Market Update

The following analysis of select counties of the Colorado real estate market is provided by Windermere Real Estate. We hope that this information may assist you with making better-informed real estate decisions. For further information about the housing market in your area, please don’t hesitate to contact your Windermere Real Estate agent.
Regional Economic Overview
The pace of job gains in Colorado picked up in the third quarter. The state added 42,700 new jobs over the past year, representing a growth rate of 1.5%. That said, growth has certainly slowed from what we saw over the past two years. The Denver and Colorado Springs metro areas saw jobs rise by only .1%; the Boulder metro area saw jobs rise .2%; Greeley rose .6%; and the Fort Collins metro area grew 1.7%.
The state unemployment rate in August was 3.1%, up from 2.6% in the third quarter of 2022. By metro area, jobless rates ranged from a low of 3.2% in Boulder to a high of 3.8% in the Colorado Springs metropolitan area.
Colorado Home Sales
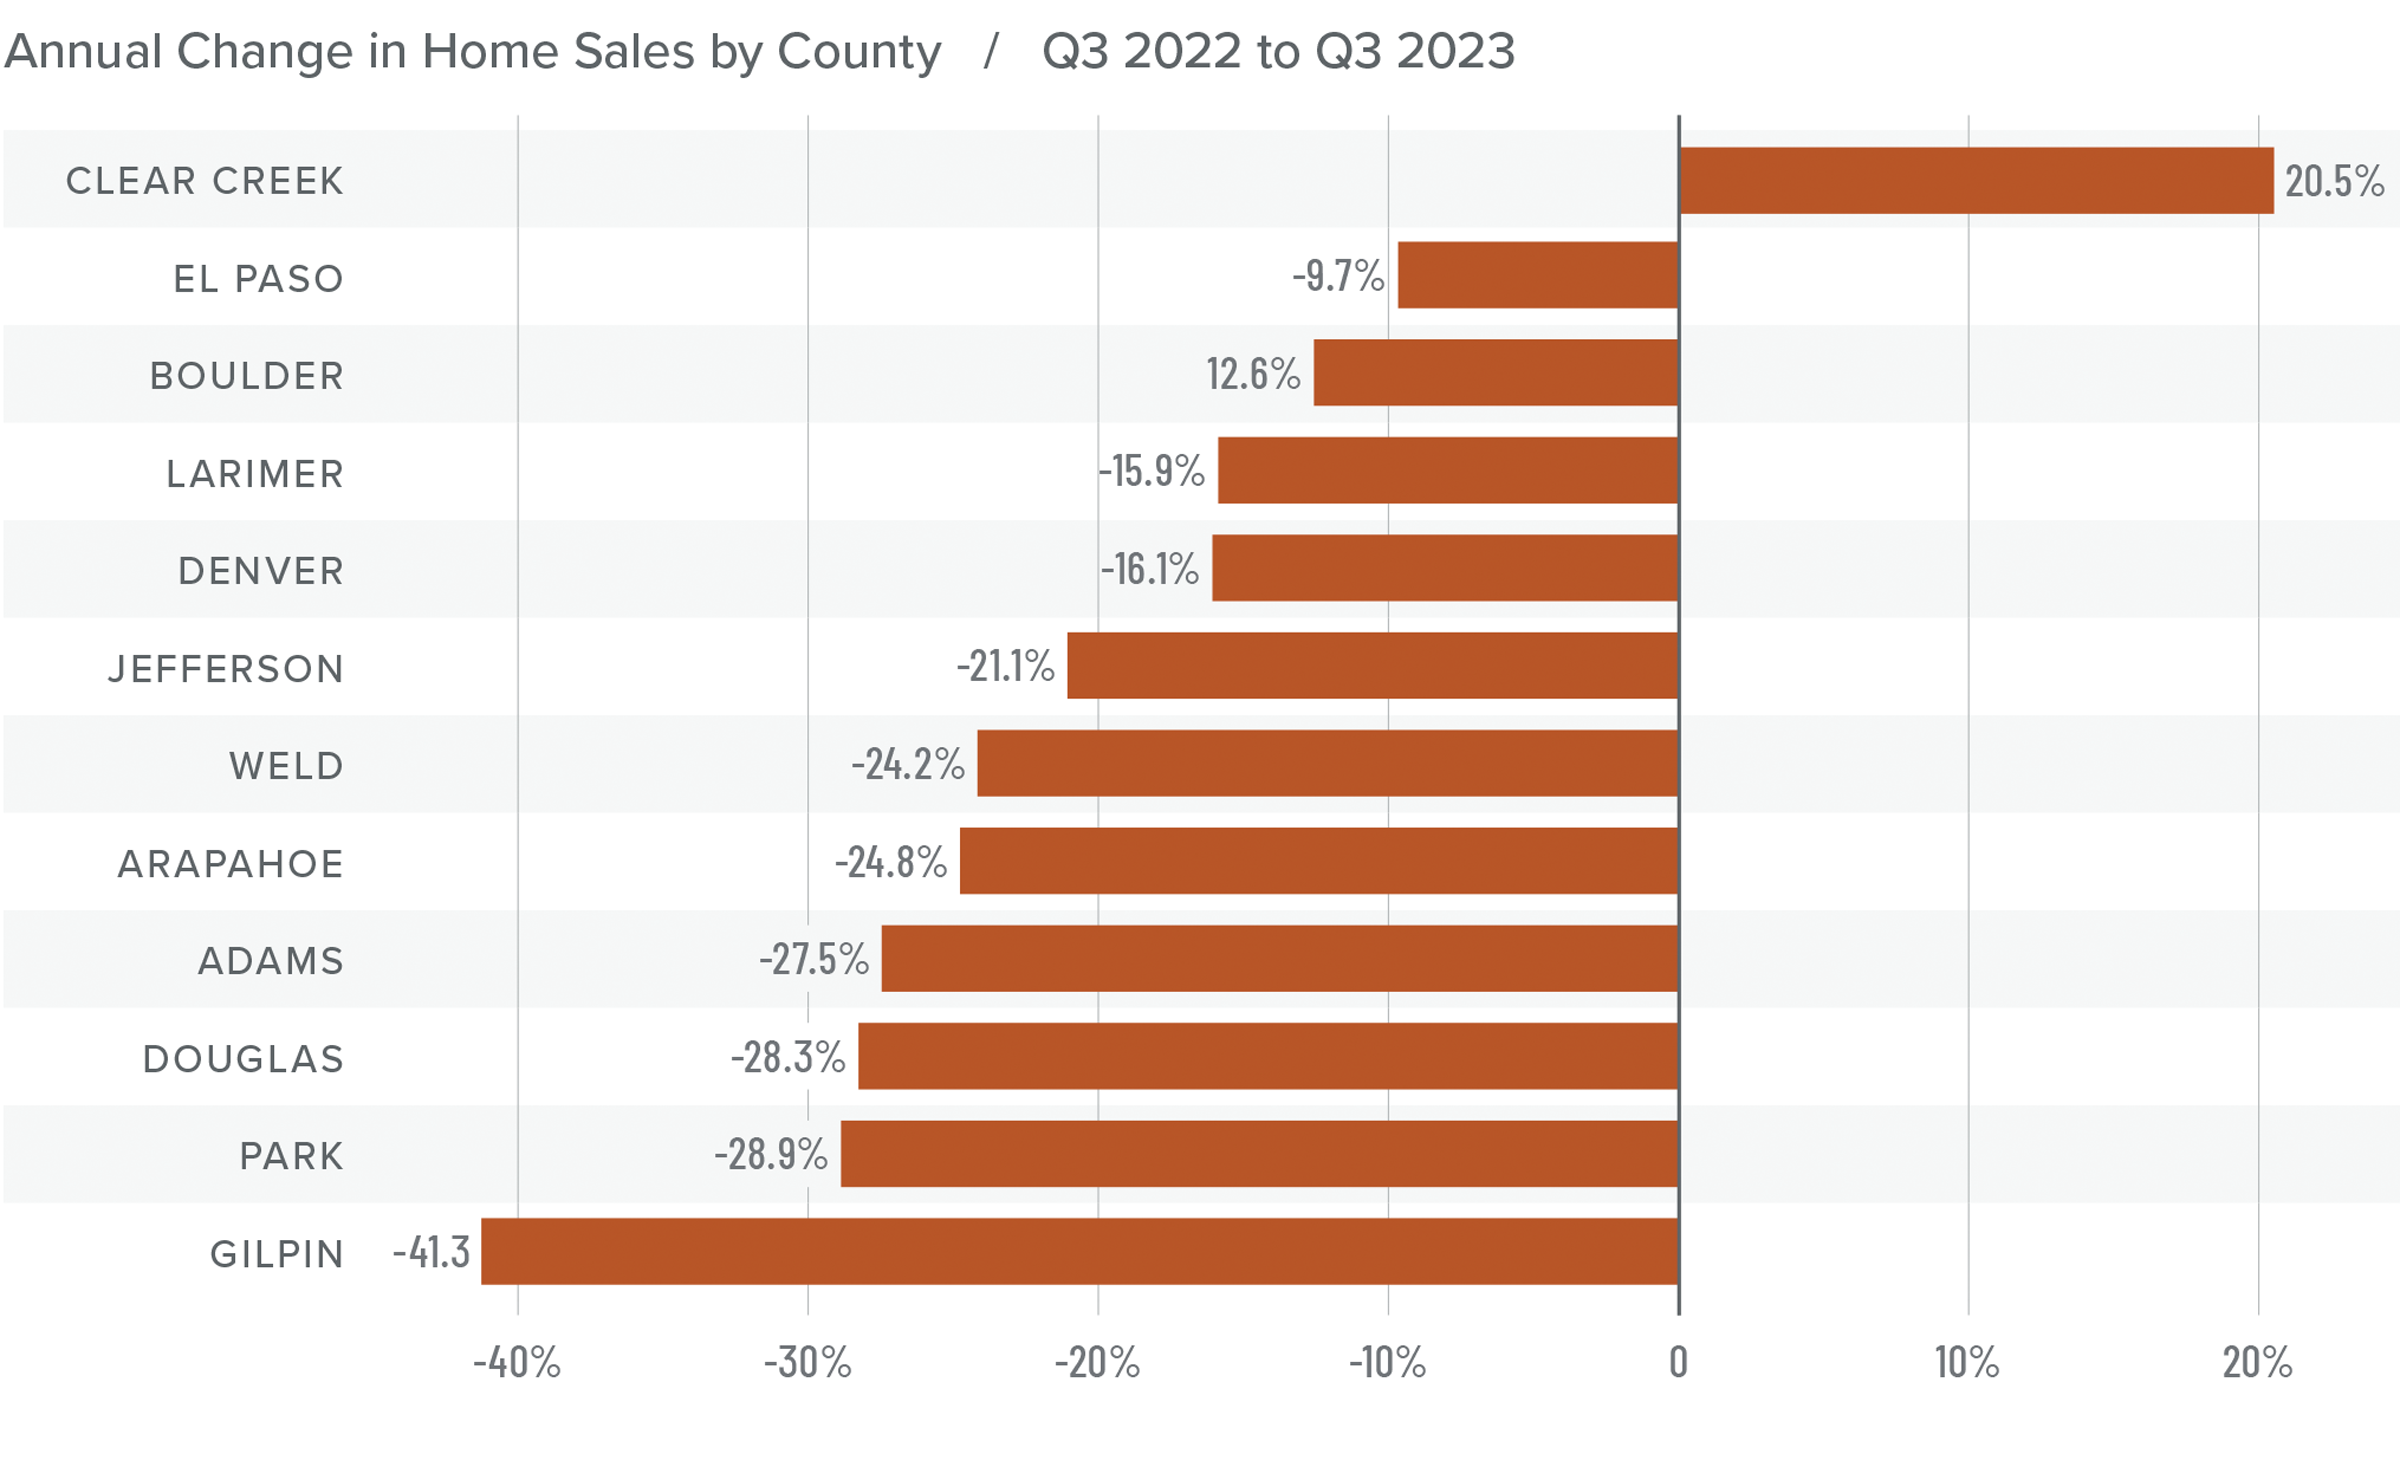
❱ In the third quarter of 2023, 8,597 homes sold, representing a drop of 20.9% from the same period in 2022. Sales were down 11.2% from the second quarter of this year.
❱ Year over year, sales fell across all the markets covered by this report except for Clear Creek County. Compared to the second quarter of this year, sales fell in every county except Clear Creek and Gilpin.
❱ The year-over-year drop in sales is not a surprise given that mortgage rates are significantly higher today and inventory is lower. What is of some concern is that inventory was up more than 36% from the second quarter, yet sales still fell. It appears that higher mortgage rates are now having an impact on the market.
❱ Pending sales, which are an indicator of future closings, fell 14.3% from the second quarter, suggesting that sales may be lackluster in the final quarter of the year.
Colorado Home Prices
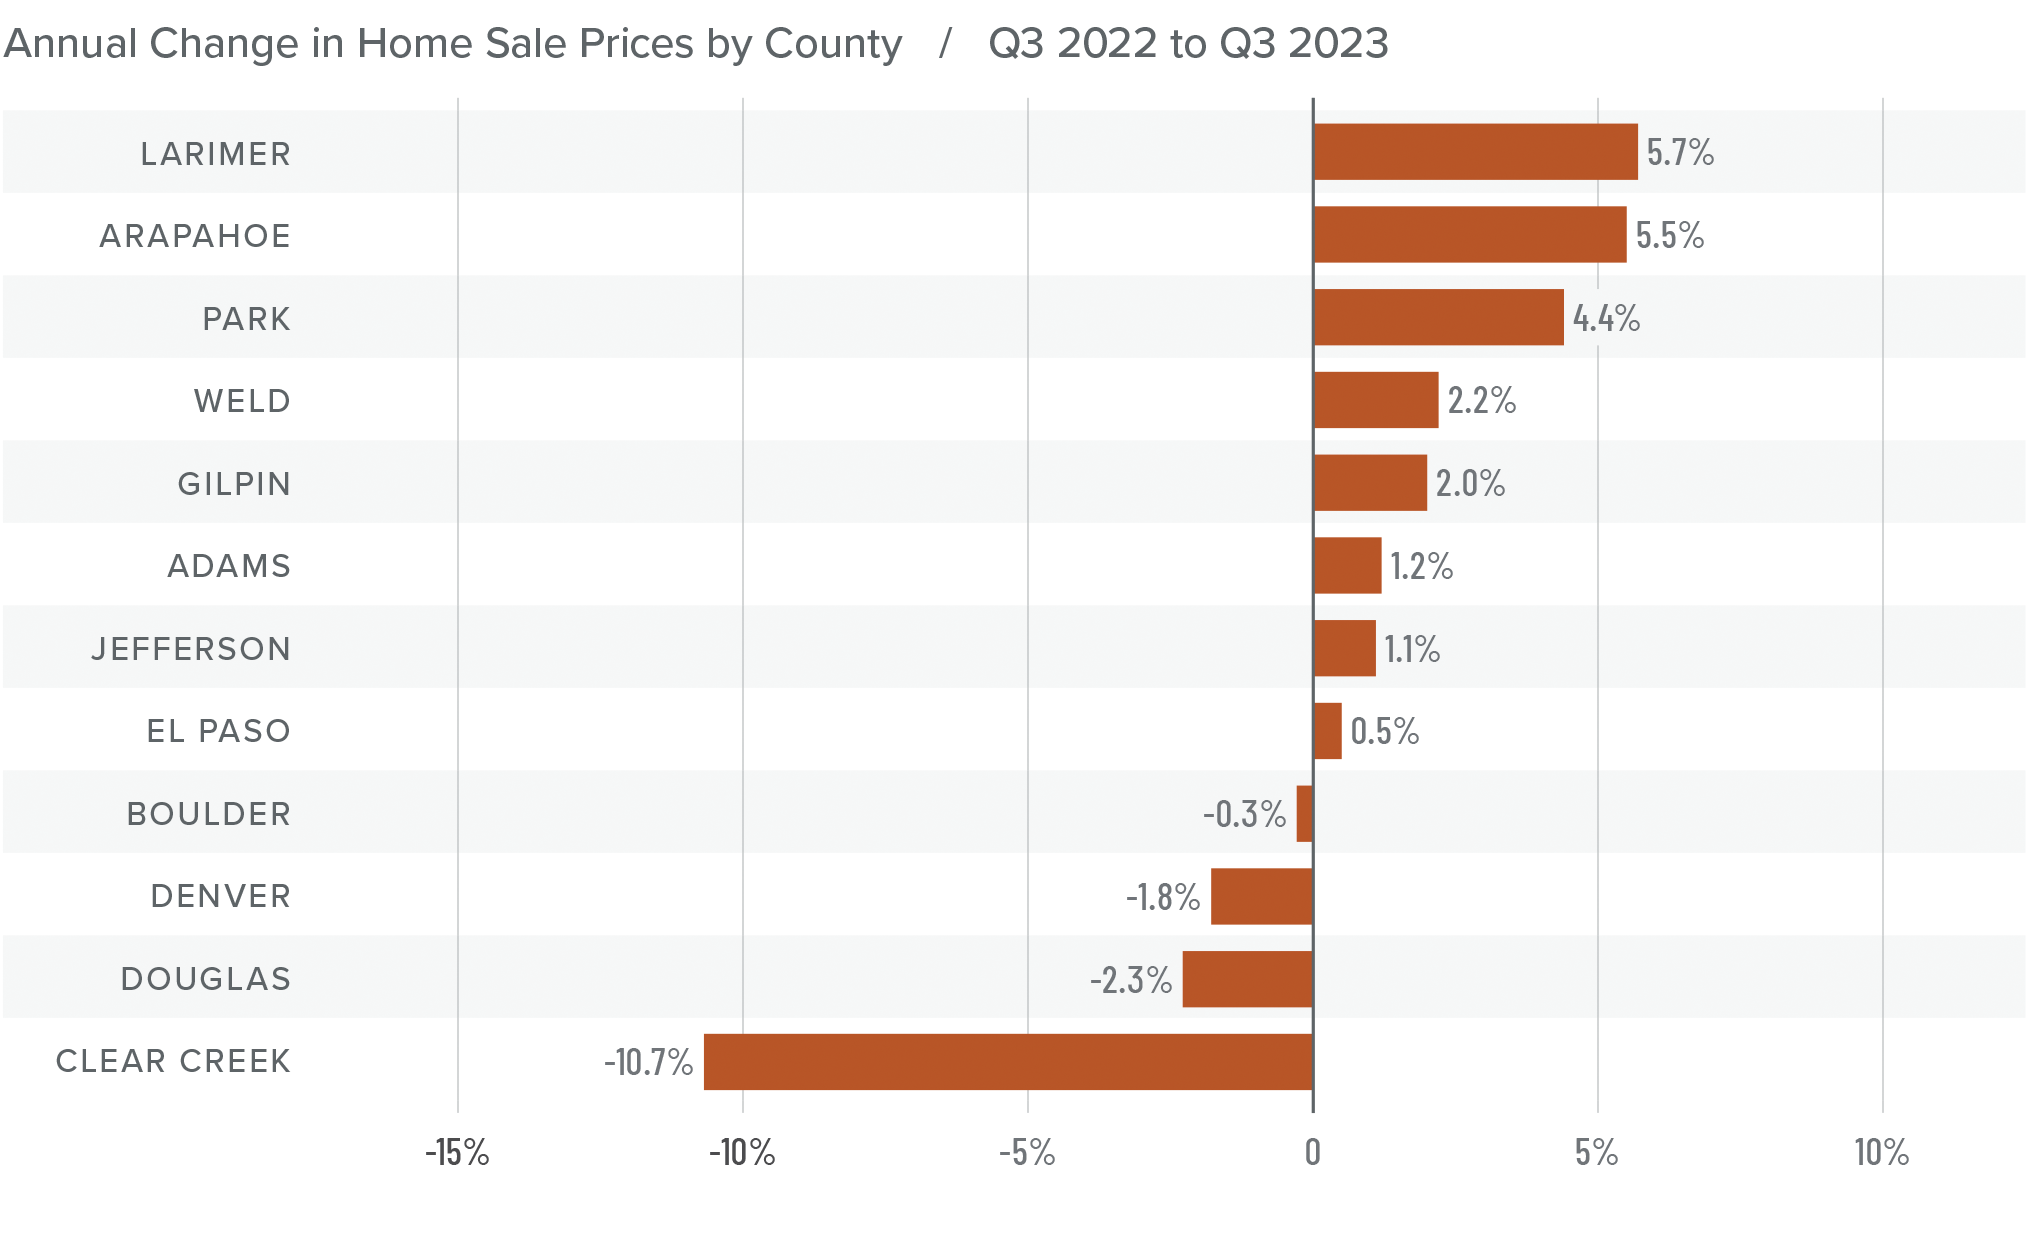
❱ The average home sale price rose 1.7% from the same period in 2022 to $665,725. Prices were 1.1% lower than in the second quarter of this year.
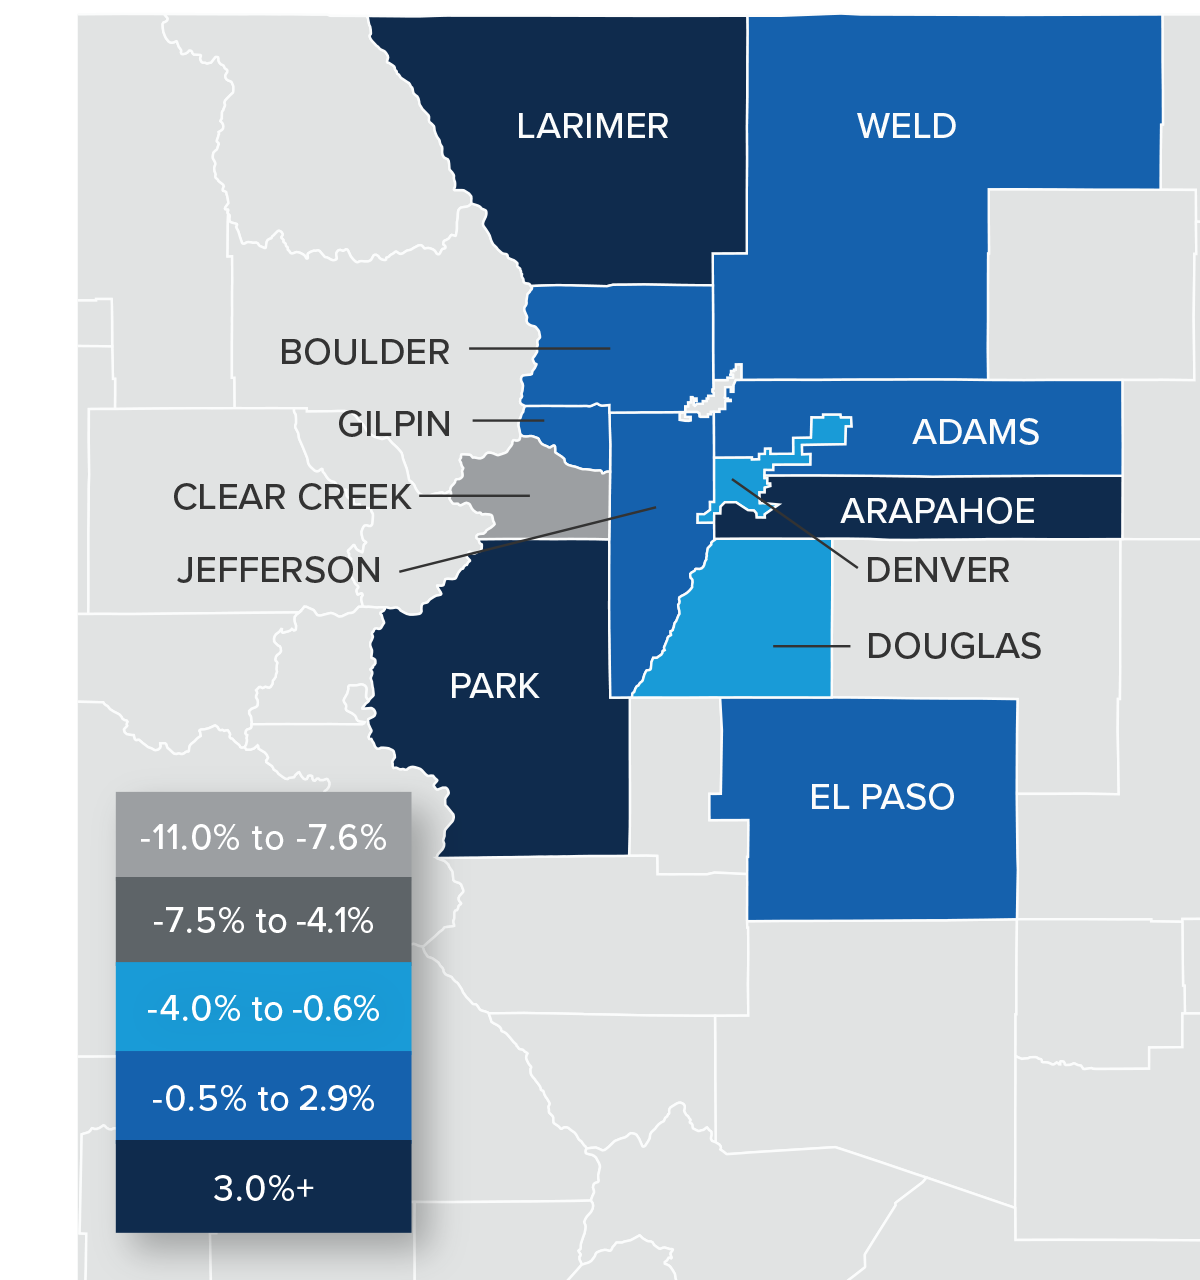
❱ Compared to the second quarter, prices rose in Adams, Larimer, Gilpin, and El Paso counties but fell in the balance of the market areas.
❱ Year over year, prices rose in eight counties and fell in four. Clear Creek County saw a significant drop but since very few home sales happen there, it’s not uncommon for prices to experience significant swings.
❱ List prices are a leading indicator that I follow closely, and given that they were lower in all markets except Weld County compared to the second quarter of this year, it appears that sellers have started reacting to higher mortgage rates. This will likely lead home prices to fall a little further as we move toward the end of the year.
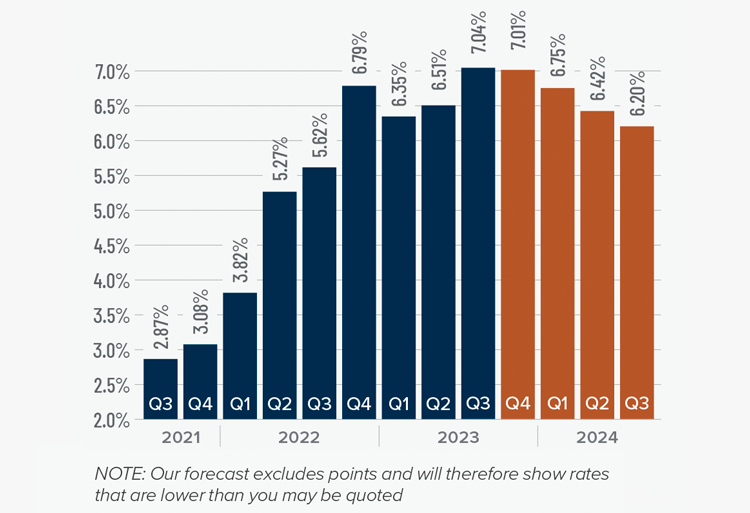
Mortgage Rates
Mortgage rates continued trending higher in the third quarter of 2023 and are now at levels we have not seen since the fall of 2000. Mortgage rates are tied to the interest rate (yield) on 10-year treasuries, and they move in the opposite direction of the economy. Unfortunately for mortgage rates, the economy remains relatively buoyant, and though inflation is down significantly from its high, it is still elevated. These major factors and many minor ones are pushing Treasury yields higher, which is pushing mortgage rates up. Given the current position of the Federal Reserve, which intends to keep rates “higher for longer,” it is unlikely that home buyers will get much reprieve when it comes to borrowing costs any time soon.
With such a persistently positive economy, I have had to revise my forecast yet again. I now believe rates will hold at current levels before starting to trend down in the spring of next year.
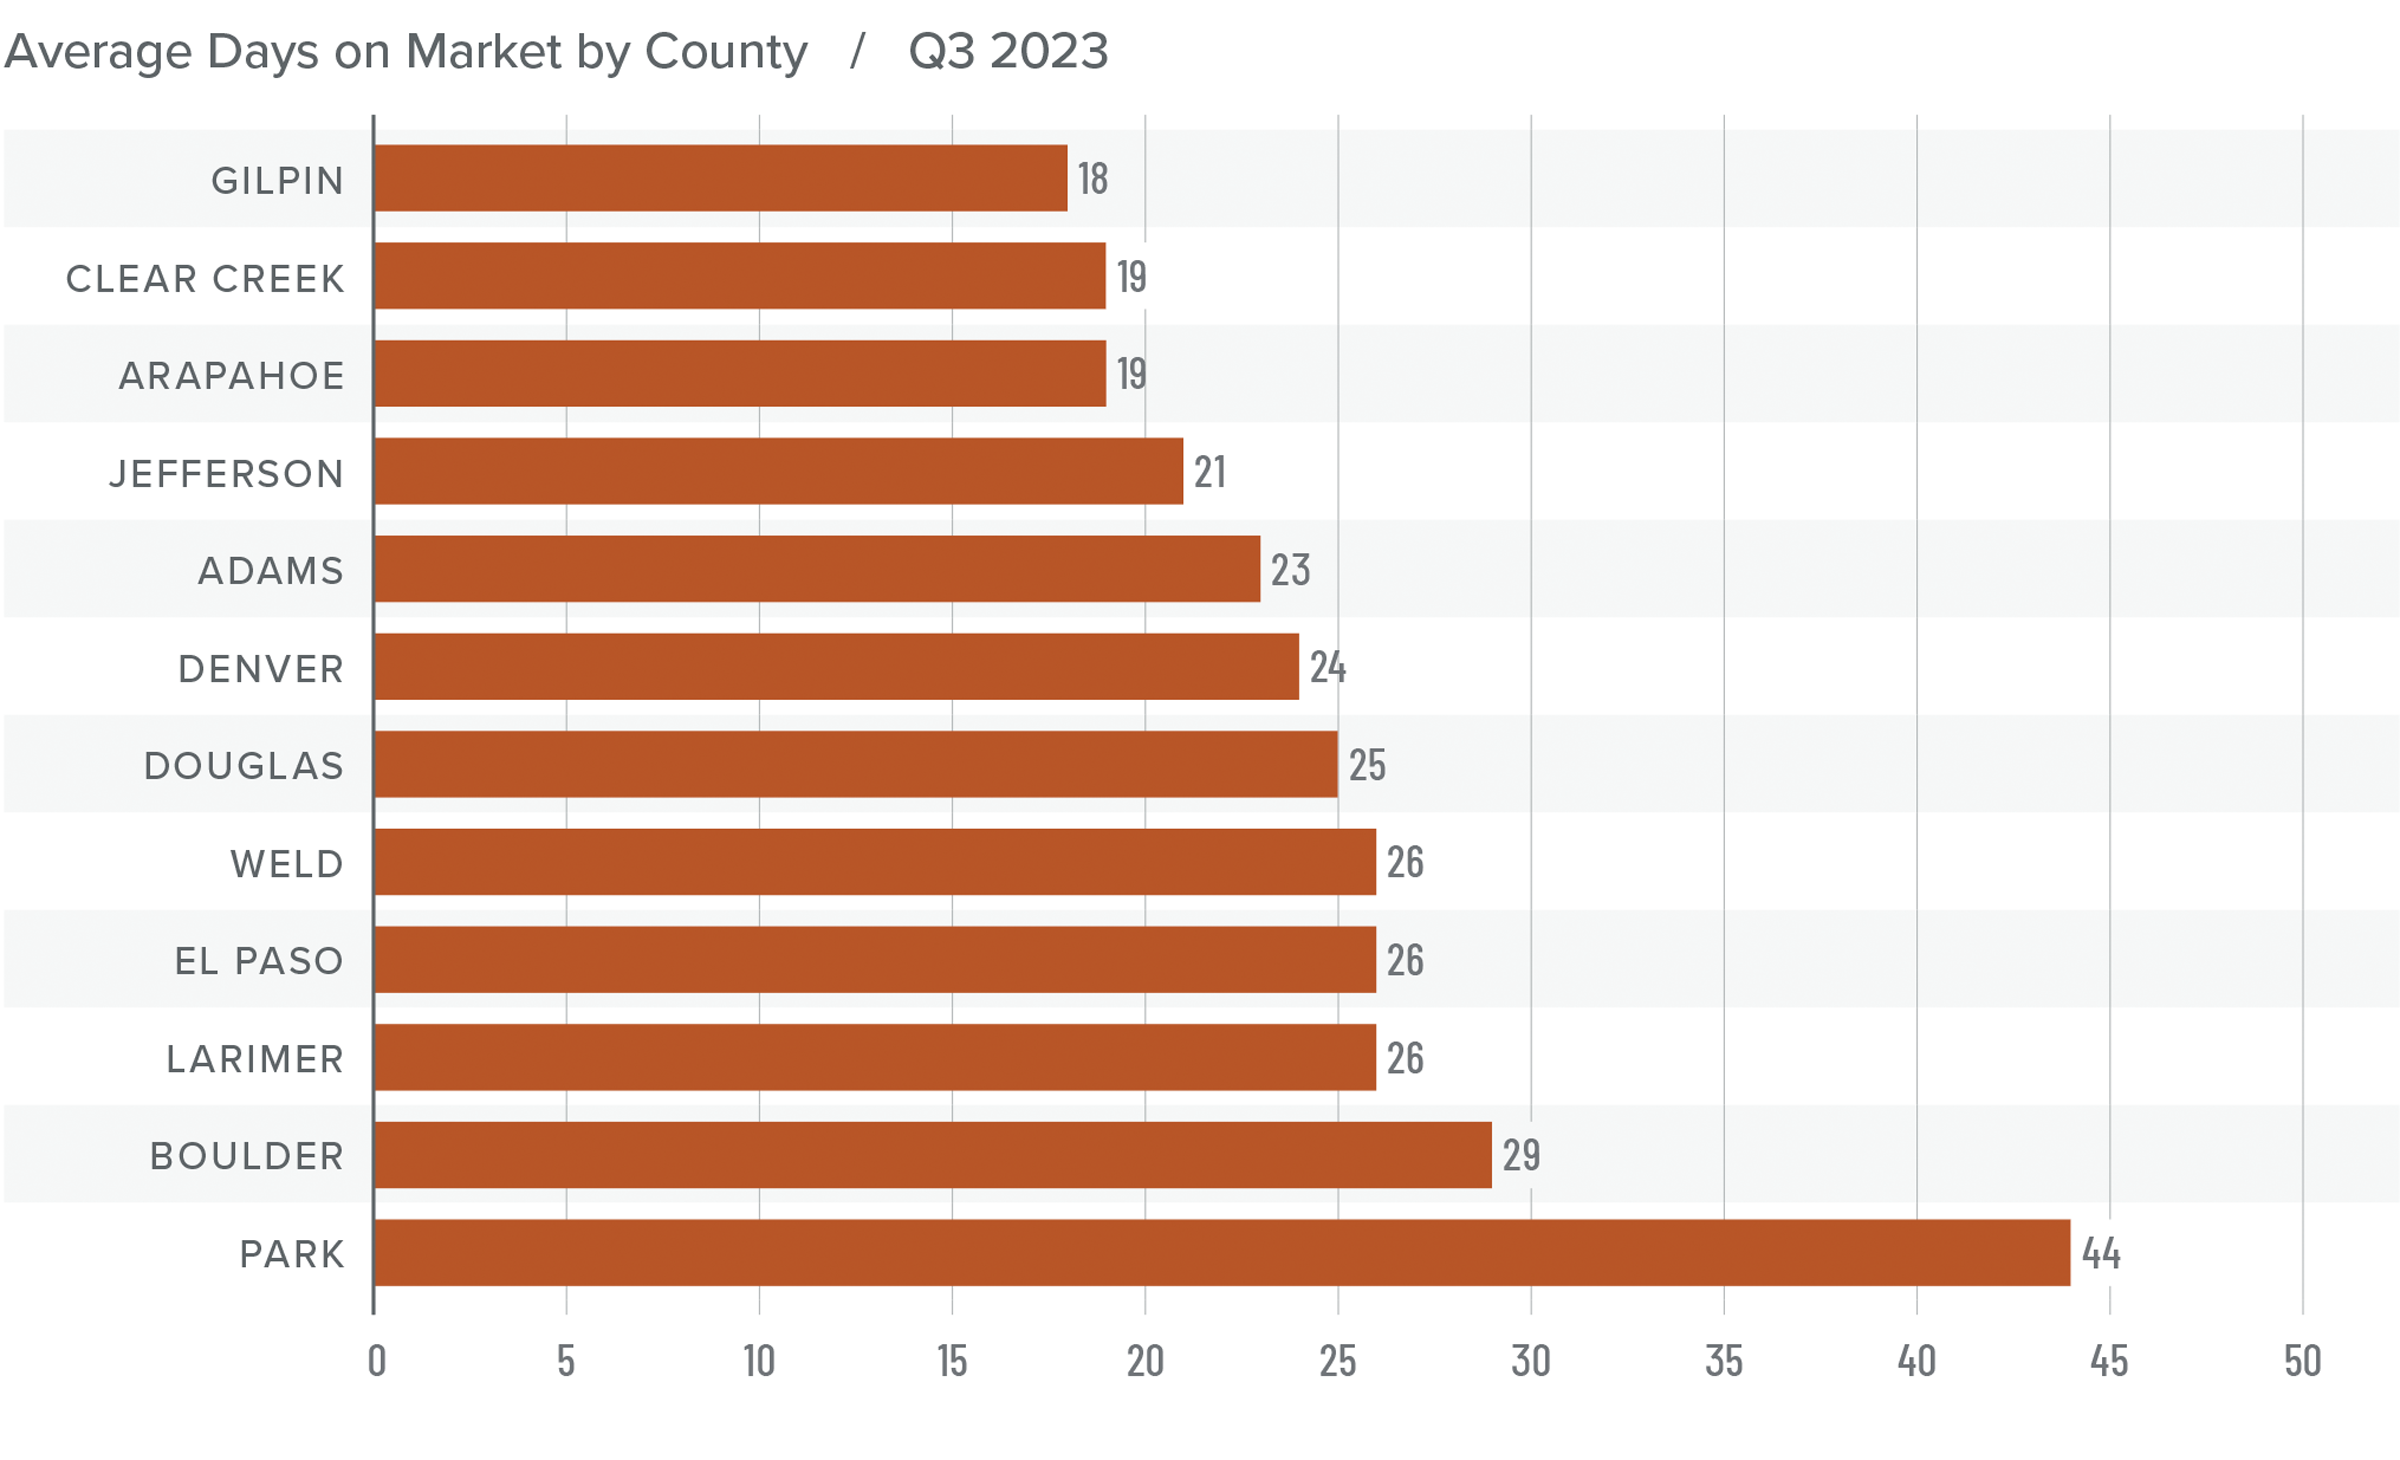
Colorado Days on Market
❱ The average time it took to sell a home in the markets contained in this report rose four days compared to the same period in 2022.
❱ The length of time it took to sell a home compared to the second quarter of this year fell in Boulder, Clear Creek, Gilpin, and Park counties, but rose across the rest of the market areas.
❱ It took an average of 25 days to sell a home in the region, which is five fewer days than in the second quarter of 2023.
❱ Despite having more choice in the market, buyers picked up the pace a little in the quarter. It remains to be seen whether this will continue given stubbornly high financing costs.
Conclusions
This speedometer reflects the state of the region’s real estate market using housing inventory, price gains, home sales, interest rates, and larger economic factors.
Job growth is still significantly slower than it has been over the past two years. A slowing economy and decades-high mortgage rates are a recipe for a sluggish housing market, but Colorado appears to be rather resilient.
That said, with rising inventories, slowing sales, and lower list prices, it can hardly be described as a traditional seller’s market. In last quarter’s market update it was said that sellers appeared to have the edge over buyers, but it’s now clear that the market is starting to respond to higher mortgage rates.

Although the market conditions described above favor home buyers, they’re not totally in the driver’s seat. As such, the needle moved into the balanced quadrant. As we move through the winter and into the spring of 2024, we hope that we will have more clarity on the direction of the housing market.
")


