This is the latest in a series of videos with Windermere Principal Economist Jeff Tucker where he delivers the key economic numbers to follow to keep you well-informed about what’s going on in the real estate market.
Hi. I’m Jeff Tucker, the principal economist at Windermere Real Estate, and these are the numbers to know right now.
The first number this week: 970,000.

That’s the annualized pace of new single-family construction started in October, according to the latest new residential construction survey released Tuesday, November 19. That’s a big step down from September’s (revised) pace of 1 million, 42 thousand, and generally lower than forecasters were expecting. As you can see here, back in 2021 builders were running at a pace well above 1 million annualized starts, before interest rates climbed and dampened their enthusiasm in 2022.
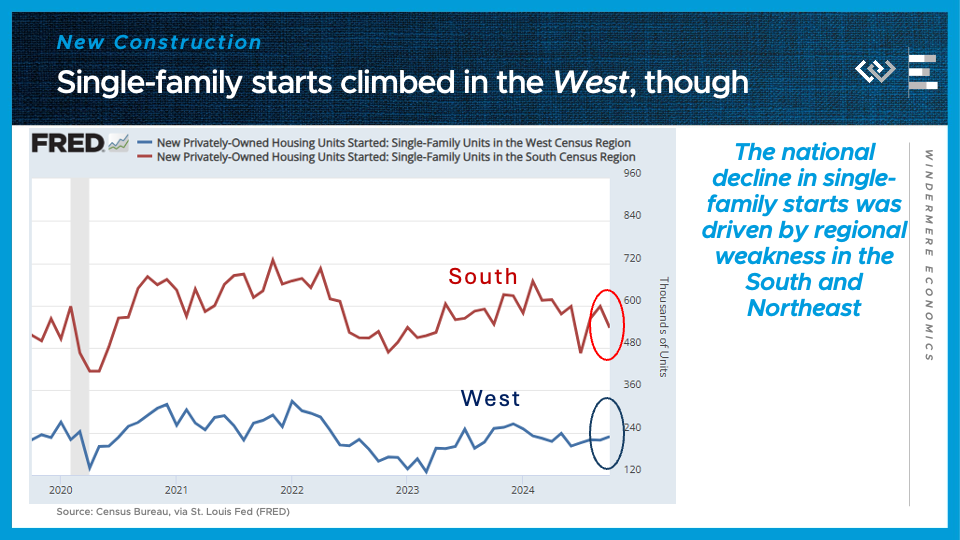
However, when you dig into the regional details of the new construction report, it turns out that here in the Western Census Region, single-family starts actually climbed about 5%, to 229,000 annualized new homes. The headline decline was driven by a drop in the South (which usually accounts for almost half of new construction), as well as the smallest, noisiest region, the Northeast.
The next number to know this week: 326,000.
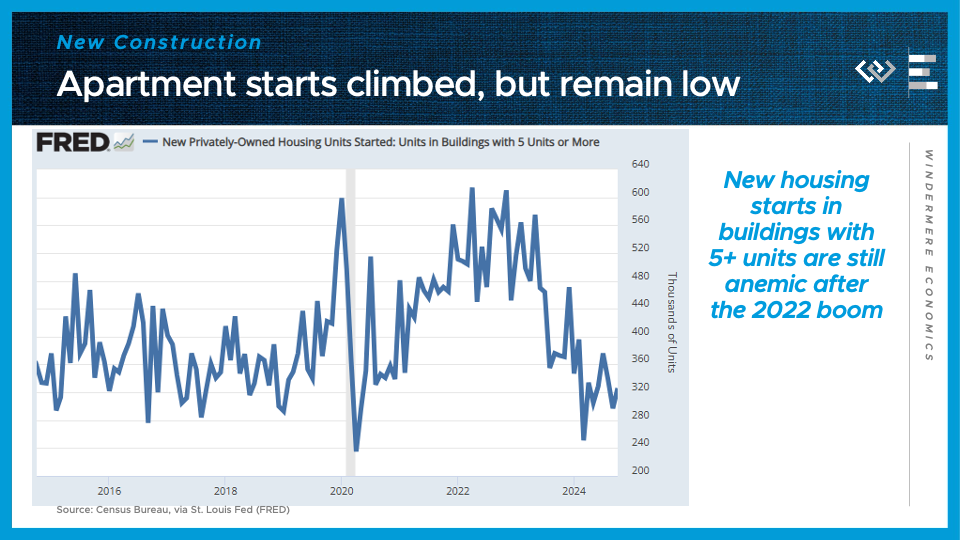
That’s the annualized pace of new multifamily apartment construction started in October, from that same new residential construction report by the Census. It’s a bit noisier than the single-family survey, and this month did represent a step upward from September’s revised pace, but it still leaves apartment construction on the low side, relatively depressed after the boom that peaked in 2022. In fact, it’s still lower than in most months before the pandemic.
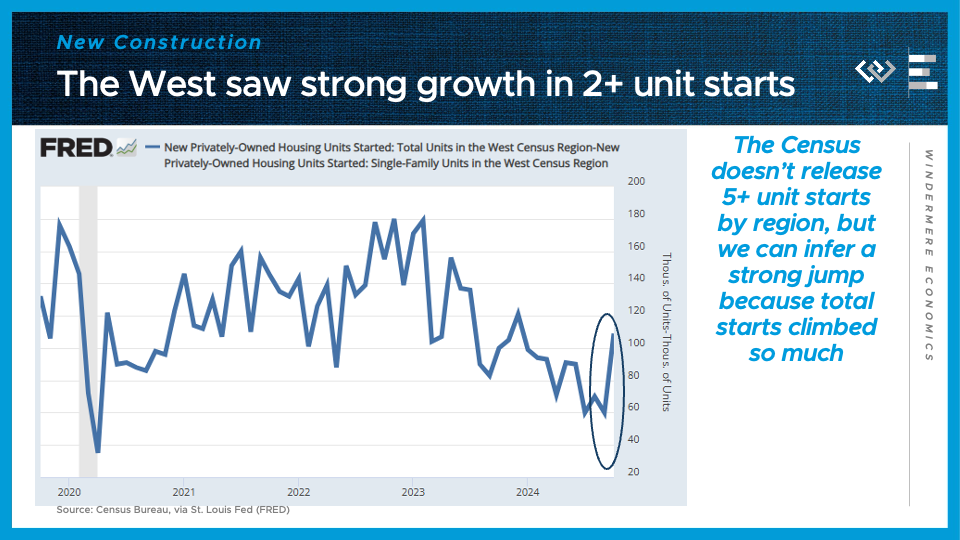
The Census doesn’t release regional breakdowns for multifamily starts, but if we back them out from the difference between total starts and single-family, we can see that the West had a huge jump in starts for homes in any building with 2 or more units: from 60,000 to 109,000, annualized. Now, this is a noisy data series, and we shouldn’t read too much into one month’s data, but it’s still an encouraging sign of strength for builders in the West.
The next number to know right now: 46.
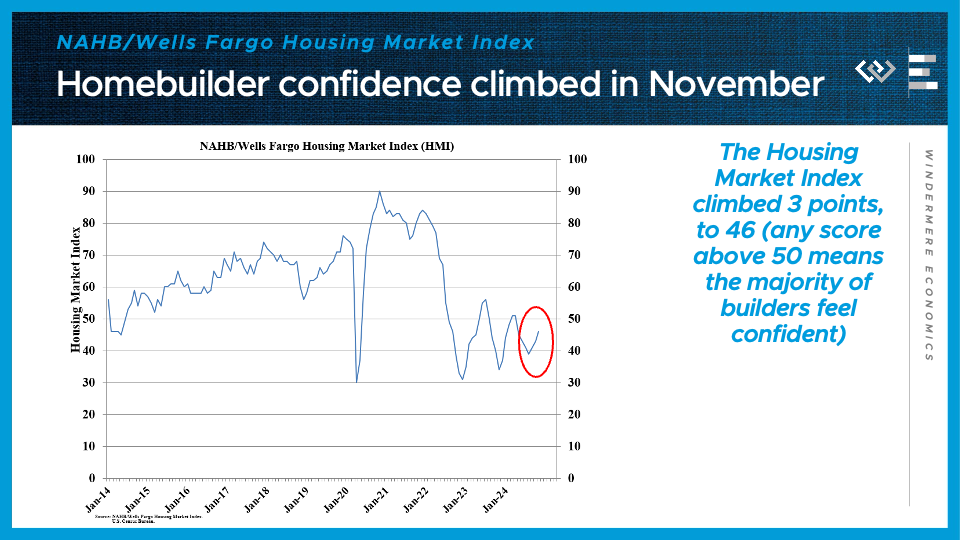
That’s the preliminary November reading for the Housing Market Index, published by Wells Fargo and the National Association of Home Builders. The index is constructed so that any number above 50 means a majority of builders feel confident about current and near-future conditions. November’s score of 46 is the closest we’ve come to that threshold since April of this year. In their press release, the president of the builders’ association pointed to growing confidence about regulatory relief, while their chief economist cautioned that high interest rates and potentially rising tariffs could darken the industry’s outlook next year. Nonetheless, on balance, builders are starting to feel a little better about their prospects.
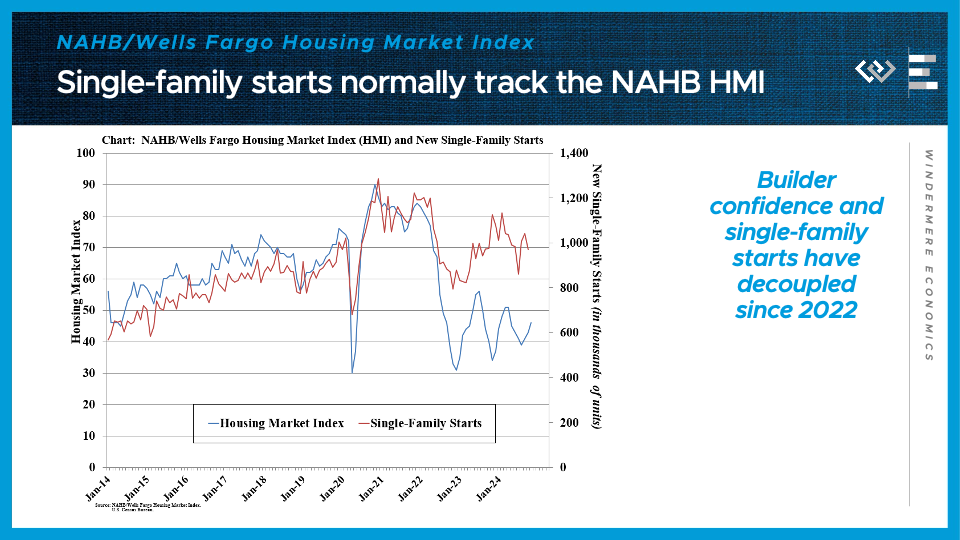
Historically, higher builder confidence as measured by this survey goes hand in hand with more housing starts, but in the last couple years that relationship has broken down. In fact, right now we’re still seeing a lot more single-family construction than this middling level of builder confidence would lead one to expect. I think the simplest explanation for this divergence is that the Housing Market Index survey is sent to a broad sample of home builders, which intrinsically means it tends to overweight the outlook of smaller home builders, relative to their share of new construction. In the last couple of years, the strong financial position of the biggest publicly-traded home builders has helped them thrive even after interest rates climbed, in part by offering interest rate buydowns for their customers.
Our final number to know right now: 7.08% or 6.78%.

Those are the two most recent readings for where mortgage rates stand, first according to Mortgage News Daily as of Monday, November 18, or secondly according to Freddie Mac’s Primary Mortgage Market Survey as of Thursday, November 14. Those daily readings from Mortgage News Daily have been unusually volatile in the two weeks since the election, and I’m also opting to show them alongside Freddie Mac’s popular weekly survey, in part because the two sources have diverged a bit more than usual in the last couple months. It’s a good reminder that there isn’t one single source of truth on mortgage rates, and everyone’s rate will depend on their particular circumstances and their lender.
Still the big takeaway I see here is that rates are up sharply from their lows in mid-September, but hopefully they might be stabilizing after climbing for the last two months, and they’re still somewhat below the highs they reached back in May of this year, or October of last year.
 Facebook
 X
X
 Pinterest
 Copy Link


