
 Facebook
 X
X
 Pinterest
 Copy Link

This is the latest in a series of videos with Windermere Principal Economist Jeff Tucker where he delivers the key economic numbers to follow to keep you well-informed about what’s going on in the real estate market.
We now have over a full month of data to see how 2025 is shaping up, and I wanted to focus today on one of my favorite leading indicators: inventory. So the first number to know this week:
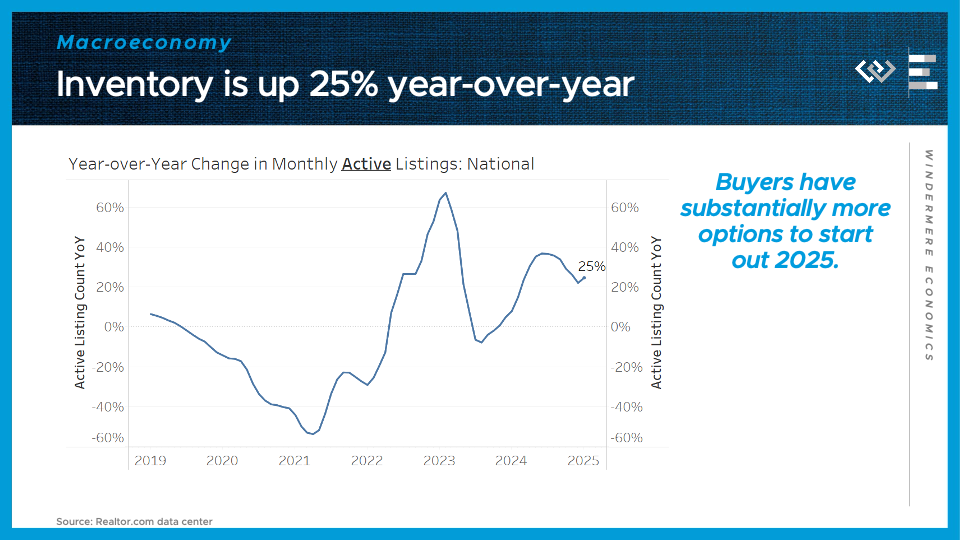
25%
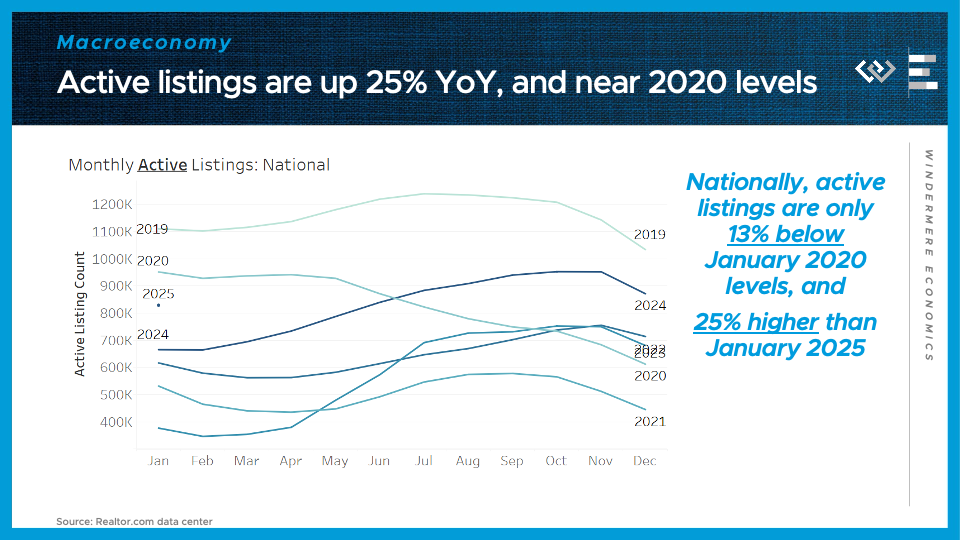
That’s how many more active listings there were this January compared to January 2024. For a sense of scale, it was about 829,000 active listings this year, compared to only about 666,000 active listings last year. And in fact we are now only 13% below January 2020 levels, on the eve of the pandemic. That’s a huge milestone the housing market is approaching, after really being defined by low inventory for the last few years.
Now, there’s a ton of data in this graph which makes it a little hard to read, so I’ll try highlighting a couple sections at a time:
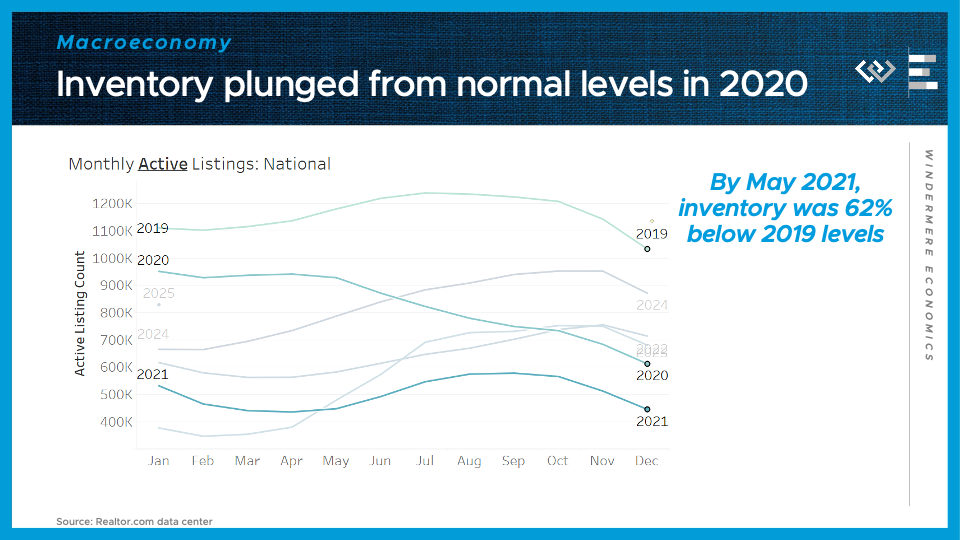
Here’s what happened early in the pandemic: inventory plunged, first because sellers weren’t even sure about selling in the early pandemic, and then because demand actually took off, fueled in part by lower interest rates as well as booming demand for more space and maybe the chance to work from home. So ultimately just over a year later, by May 2021, for instance, we had 62% fewer active listings than in May of 2019. That helped fuel some extraordinary price appreciation and really frenzied competition in the market, for about a year.
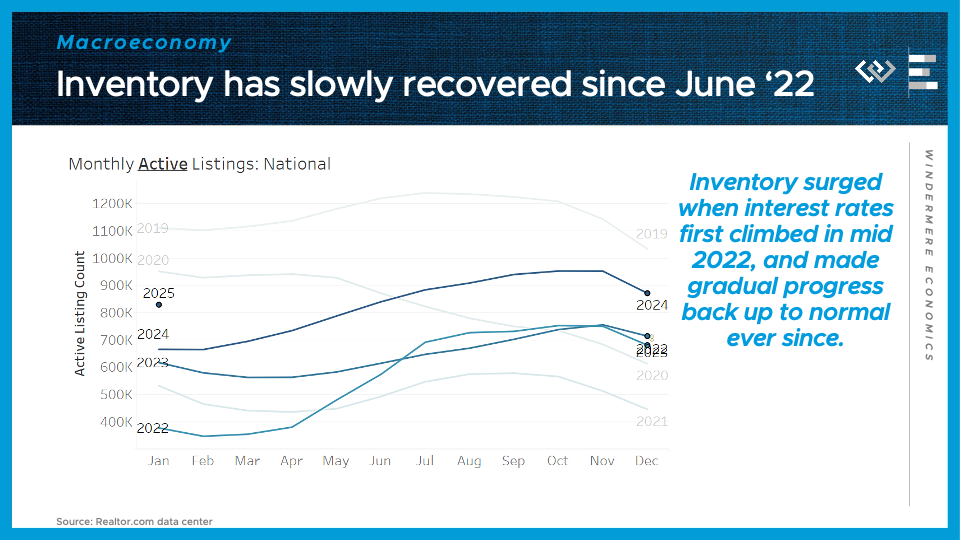
Then in mid-2022, interest rates shot up from record lows of around 3%, above pre-pandemic levels, to the highest in a generation, which helped put the brakes on homebuyer demand for a while, which has slowly helped inventory build back up toward normal levels, and that’s almost where we are today.
Now what does higher inventory really mean: It should restore some balance to the market between buyers and sellers, putting a damper on home price appreciation; helping homes sell a little slower on average; and giving buyers more variety of choices and a little more negotiating power. All of that means the market is shaping up to be a little friendlier for buyers this spring.
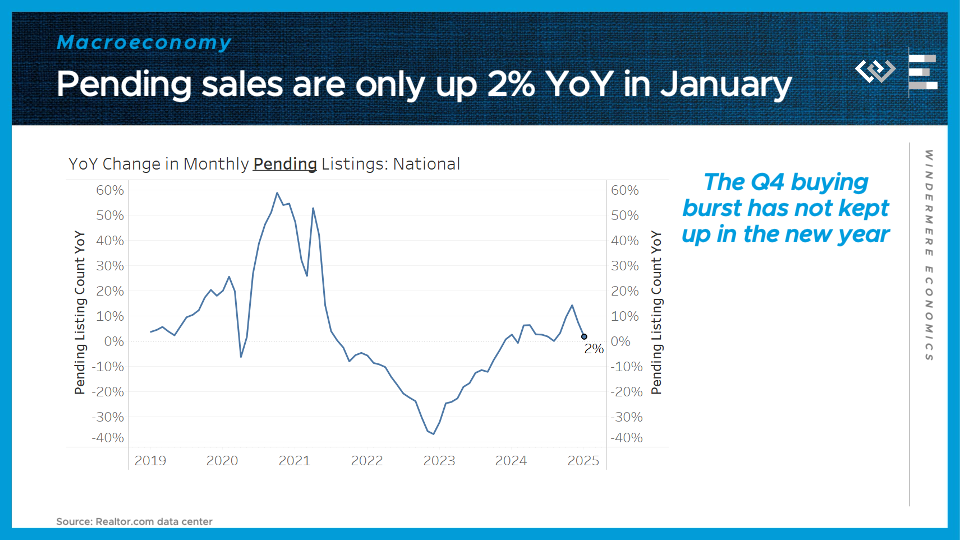
Pending sales have risen just 2% from the same time last year, showing that the home-purchase surge in Q4 of 2024 has not really continued into the new year. That surge was driven by lower interest rates, so it’s perhaps not surprising to see it peter out now that interest rates are back up around 7%. The second number to know this week:
3%
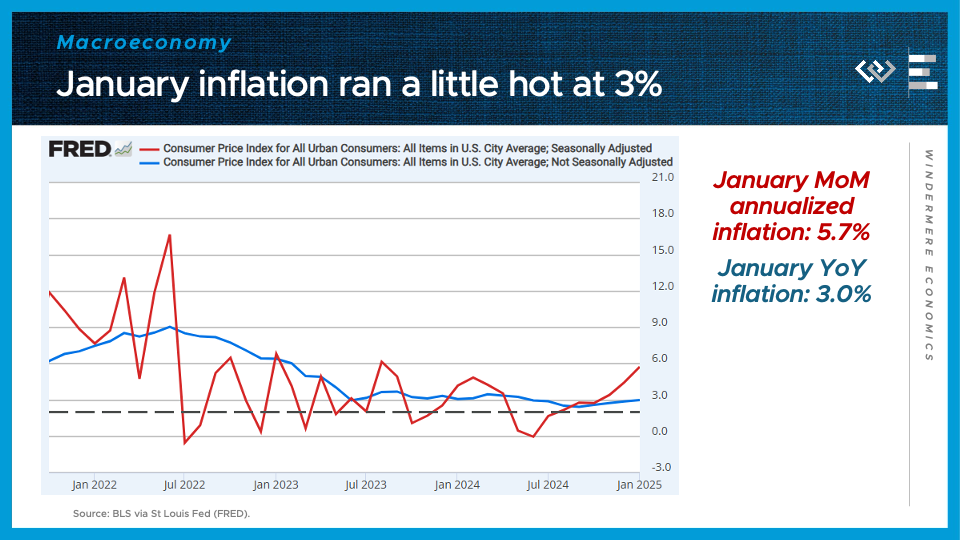
That’s the inflation rate in January, as measured by the year-over-year change in the Consumer Price Index. As a reminder the Fed is aiming for inflation of just 2%, so this figure is still running a little too hot. This is just one data point, but stubborn inflation is one reason why the Federal Reserve did NOT opt to cut their short-term interest rate at their most recent meeting.

Speaking of interest rates, our last number to know this week: a little less than 7%. That’s where interest rates have moved recently, giving a little bit of relief to homebuyers, but still probably feeling a bit high for many folks. I think some gradual further declines are possible, but certainly not guaranteed, and really big declines seem especially unlikely any time soon.
")


