The following analysis of select Idaho real estate markets is provided by Windermere Real Estate Chief Economist Matthew Gardner. We hope that this information may assist you with making better-informed real estate decisions. For further information about the housing market in your area, please don’t hesitate to contact your Windermere agent.
ECONOMIC OVERVIEW
Job growth in Idaho remains fairly strong. Over the past 12 months, the state has added 22,000 new jobs, representing a solid growth rate of 3.1%.
In August, the state unemployment rate was 2.8%, down from 3.1% a year ago. The state is, essentially, at full employment, and it appears my forecast predicting that Idaho would add just over 20,000 new jobs in 2018 will likely come true.
HOME SALES ACTIVITY
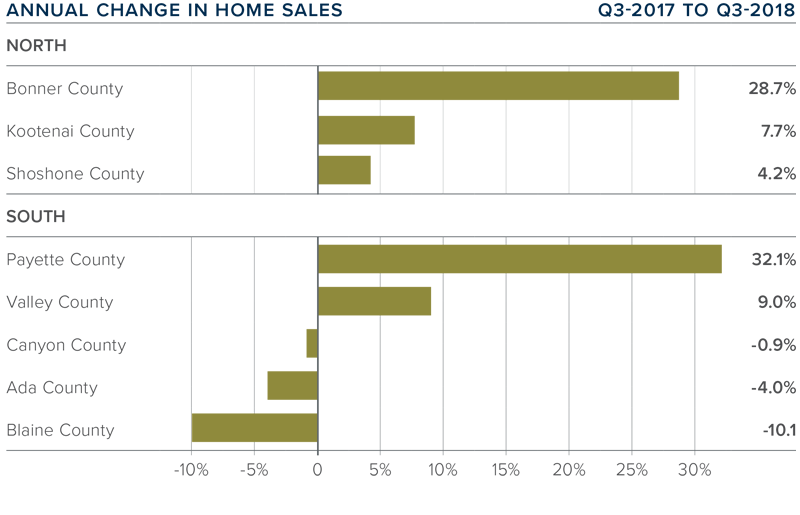
- 6,592 homes were sold during the third quarter, representing a very modest drop of 0.3% from the third quarter of 2017.
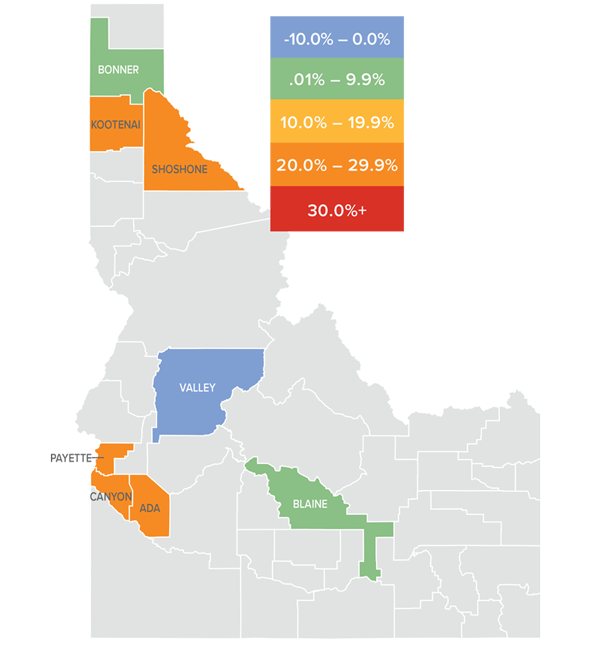
- In Northern Idaho, sales again rose the fastest in Bonner County, where they were up by a substantial 28.7% relative to the third quarter of 2017. There were more modest increases in the other two counties. In Southern Idaho, we saw substantial sales growth in the relatively small Payette County but lower sales in Canyon, Ada, and Blaine Counties.
- Demand for housing remains strong, but pending sales saw a modest decline. Listing activity remains at relatively low levels and, given substantial growth in home prices, this may be limiting the ability for some to buy. I am hoping inventory levels will rise, but it is unlikely that this will happen until next spring.

HOME PRICES

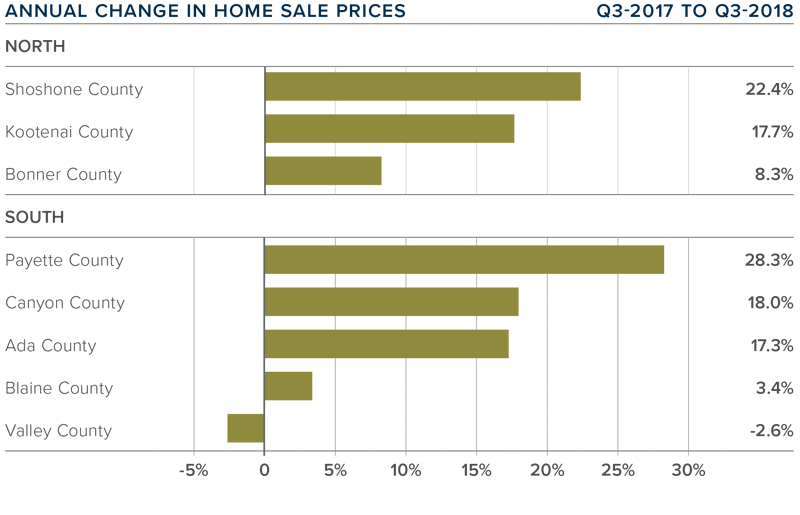
- The average home price in the region rose 15.7% year-over-year to $326,329.
- Payette County led the market with the strongest annual price growth. Homes there sold for 28.3% more than a year ago, but this is a small market with very few sales, so it is subject to severe swings in average sale prices.
- There were price increases in all but one county compared to the third quarter of 2017. The outlier was Valley County, which had a very modest drop.
- As I have stated in prior reports, listing activity continues to drive home prices up at above-average rates. I do not see this changing substantively until the new year.

DAYS ON MARKET
- It took an average of 93 days to sell a home in Northern Idaho and 72 days in the southern part of the state.
- The average number of days it took to sell a home in the region dropped six days when compared to the third quarter of 2017 and was down by nine days from the second quarter of this year.
- Homes in all but two surveyed counties took less time to sell than they did in the same quarter of 2017. The outliers were Valley and Kootenai, which saw the time it took to sell a house rise, but very modestly.
- Homes again sold the fastest in Canyon and Ada Counties, where it took an average of 26 and 27 days, respectively.

CONCLUSIONS

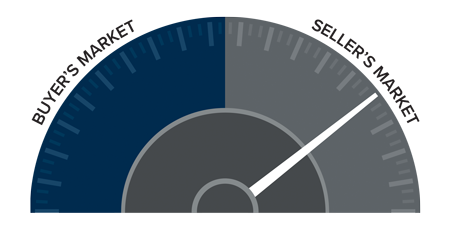
The speedometer reflects the state of the region’s housing market using housing inventory, price gains, home sales, interest rates, and larger economic factors.
Job growth continues to spur the housing market in Idaho and this is unlikely to change. The number of available homes for sale is still well below where I would like it to be, which is causing prices to continue to rise at above-average rates. That said, limited sales growth may be a function of housing affordability, which may be keeping some buyers on the fence.
I will be interested to see if this trend continues in the fourth quarter. Given these factors, I have moved the needle just a little more in favor of home sellers.

Matthew Gardner is the Chief Economist for Windermere Real Estate, specializing in residential market analysis, commercial/industrial market analysis, financial analysis, and land use and regional economics. He is the former Principal of Gardner Economics and has more than 30 years of professional experience both in the U.S. and U.K.
 Facebook
 X
X
 Pinterest
 Copy Link


