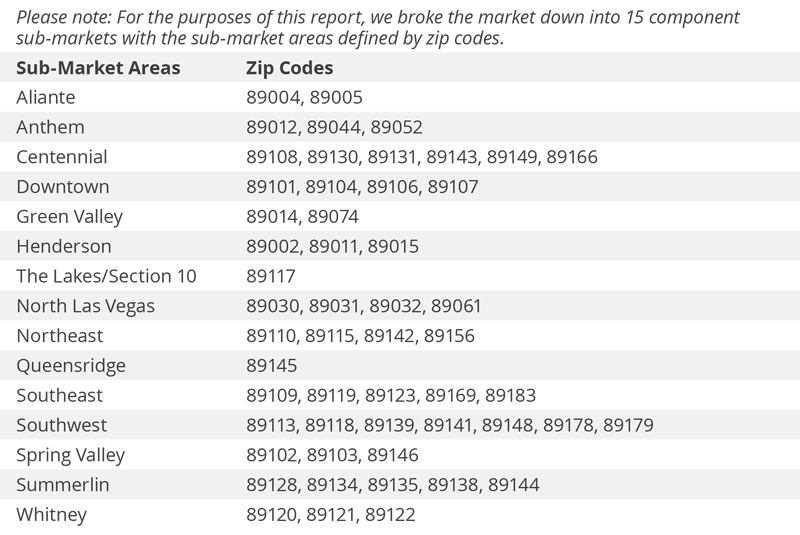
The following analysis of the greater Las Vegas, Nevada real estate market is provided by Windermere Real Estate Chief Economist Matthew Gardner. We hope that this information may assist you with making better-informed real estate decisions. For further information about the housing market in your area, please don’t hesitate to contact your Windermere agent.
 ECONOMIC OVERVIEW
Employers in the Las Vegas metropolitan area continue to add jobs. A total of 27,800 new positions were added over the past 12 months, representing an annual growth rate of a healthy 2.9%. Interestingly, Las Vegas employment broke the million mark for the very first time in May of this year.
Thanks to ongoing job growth, the unemployment rate continues to drop. The seasonally adjusted rate was down to 4.6%—a level not seen since before the last recession.
HOME SALES ACTIVITY
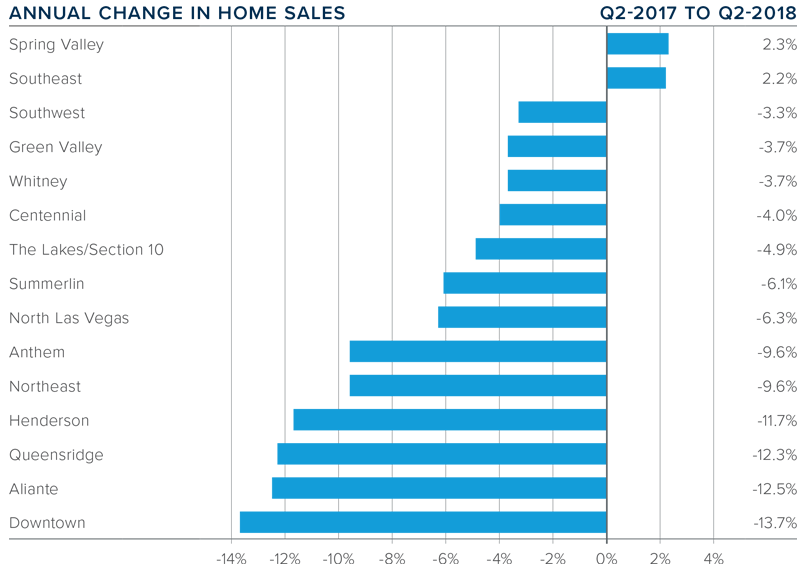
- A total of 9,775 homes were sold in the second quarter of 2018—a drop of 5.7% over the same period a year ago. We can attribute the fall in sales to a lack of homes for sale. Inventory was down 12.7% from the same period in 2017.
- Pending sales rose by a very marginal 0.7% in second quarter, suggesting that closings in third quarter may fall well short of expectations.
- Sales rose in only two sub-markets compared to a year ago, with the Spring Valley and Southeast Las Vegas markets each rising by a little over 2%. All other markets saw sales decline, the most substantial of which was in the Downtown sub-market.
- The data in this report suggests that housing demand, although strong, is being stifled by the lack of homes for sale.

HOME PRICES
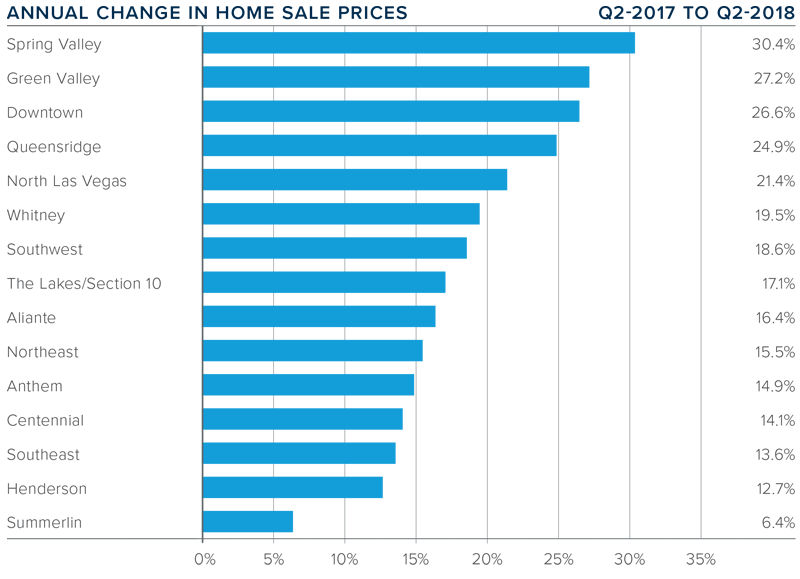
- Home prices in the area rose by 15.9% compared to the second quarter of 2017 to an average of $302,507.
- Notably, only one neighborhood saw annual price growth of less than 10%, with Summerlin coming in at a still healthy 6.4%.
- Prices in all of the sub-markets except one rose by double-digits when compared to the same quarter last year. The strongest growth was in the Spring Valley sub-market, where prices were up 30.4%, but there was substantial price growth in almost every sub-market.
- I believe above-average price growth in the Las Vegas market will continue through the balance of this year and into 2019, even in the face of rising mortgage rates.

DAYS ON MARKET
- The average time it took to sell a home in the region dropped 10 days compared to the second quarter of 2017.
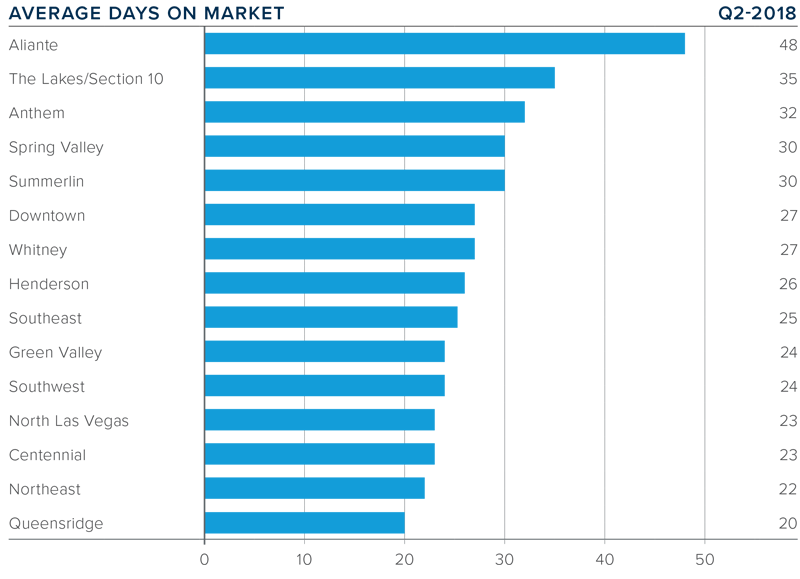
- Region-wide it took an average of only 28 days to sell a home in the second quarter of this year.
- Days on market fell in all but one of the sub-markets compared to a year ago. The exception was Spring Valley, where it took three days longer to sell a home than it did a year ago.
- The greatest drop in days on market was in Aliante, which fell by 38 days when compared to the same quarter in 2017.

CONCLUSIONS

The speedometer reflects the state of the region’s real estate market using housing inventory, price gains, home sales, interest rates, and larger economic factors.
Employment growth in Clark County continues to be very robust. This, when combined with low inventory levels, will continue to push home prices higher. Given these factors, I have moved the speedometer a little farther in favor of sellers.

Mr. Gardner is the Chief Economist for Windermere Real Estate, specializing in residential market analysis, commercial/industrial market analysis, financial analysis, and land use and regional economics. He is the former Principal of Gardner Economics, and has more than 30 years of professional experience both in the U.S. and U.K.
 Facebook
 X
X
 Pinterest
 Copy Link


