
 Facebook
 X
X
 Pinterest
 Copy Link

This is the latest in a series of videos with Windermere Principal Economist Jeff Tucker where he delivers the key economic numbers to follow to keep you well-informed about what’s going on in the real estate market.
Our first number this week is all about the elephant in the room:
Tariffs
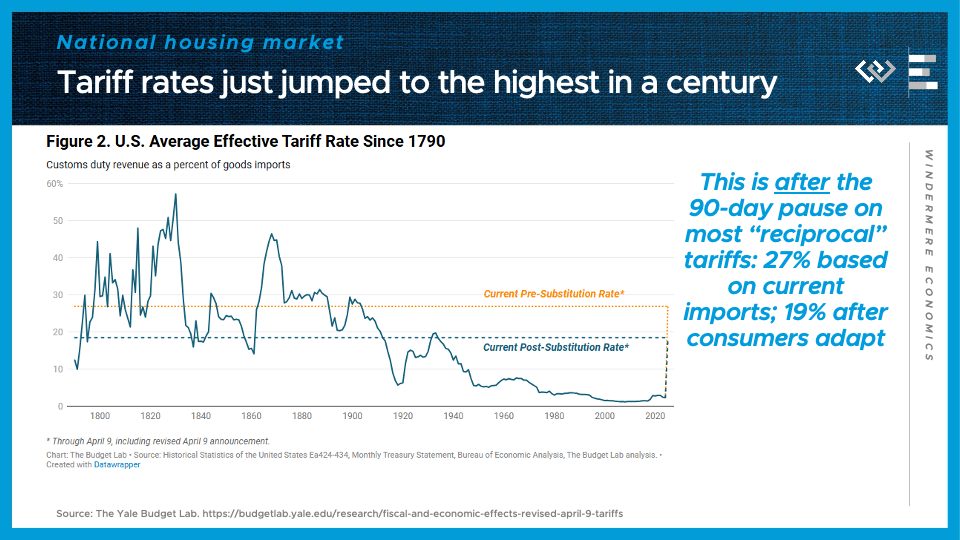
President Trump’s new tariff schedule announced so far in April will raise the average effective tariff rate on imports by a factor of TEN, from 2.6% to 27% — the highest since 1903. And that’s including the 90-day pause for some of the higher reciprocal tariffs. The Yale Budget Lab computed that based on the mix of imports we have been buying. They also estimated, on this chart, that after Americans start substituting away from highly-tariffed sources like China, the post-substitution rate might fall as low as 18.5 percent. That would be the highest since 1933, when trade was shrinking during the Great Depression.
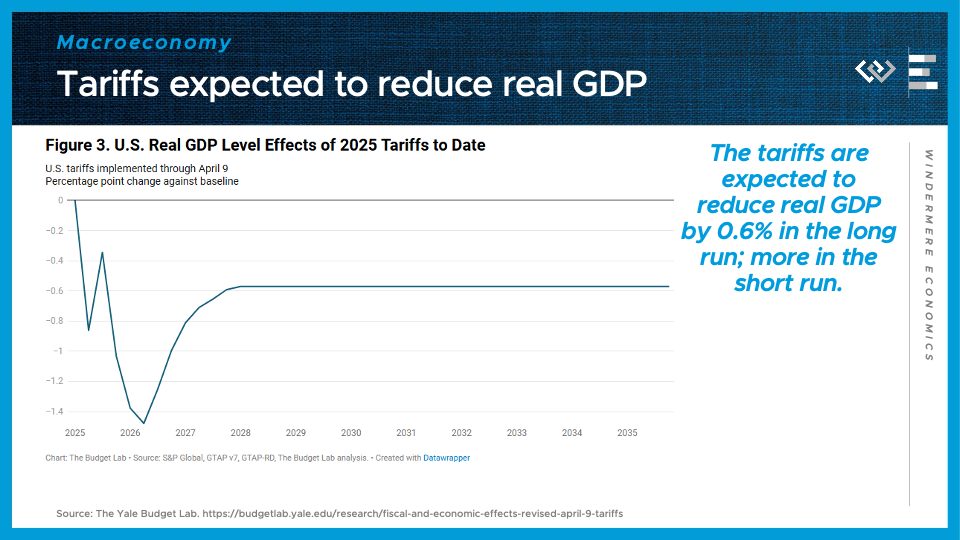
What effect will this have? For one, it will reduce real GDP in the U.S. One estimate has it reducing real GDP growth in 2025 by 1.1 percentage points, and a permanent reduction of 0.6%.
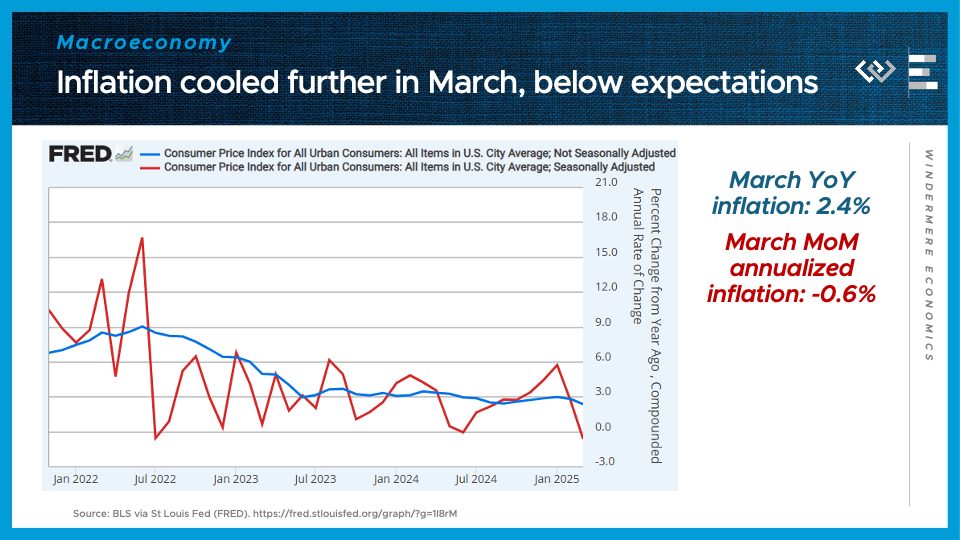
So far, the effects of tariffs haven’t shown up in much hard economic data. The March CPI inflation report, for instance, showed inflation came in below expectations, with a surprising month-over-month decline in the price level, and a cooldown in the year-over-year growth rate to 2.4%. That’s important because it helps give the Fed permission to cut rates later this year, if they start to see the job market slow down.
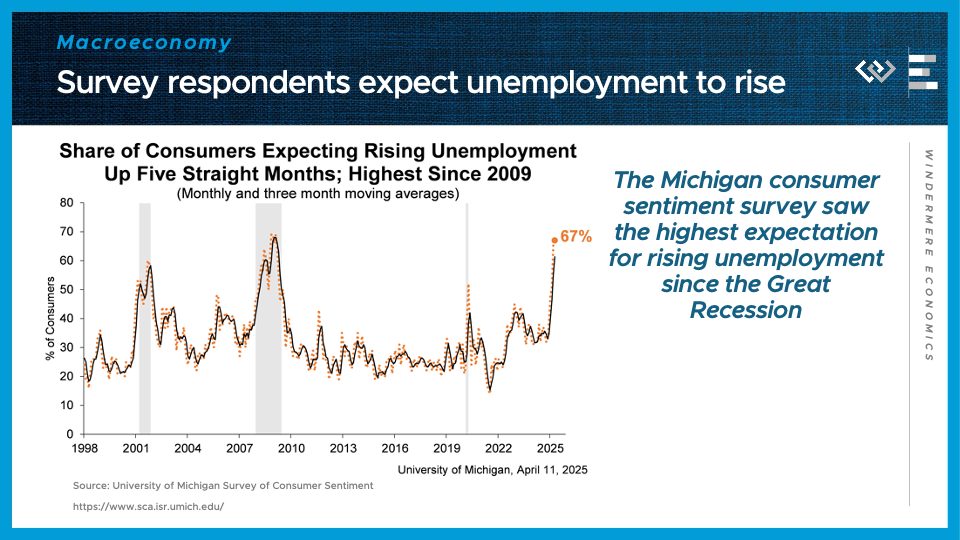
One place where the data is rapidly turning south is forward-looking indicators and especially in sentiment surveys, like the Michigan Consumer Sentiment Survey, whose respondents are the gloomiest about future unemployment that they’ve been since 2009.
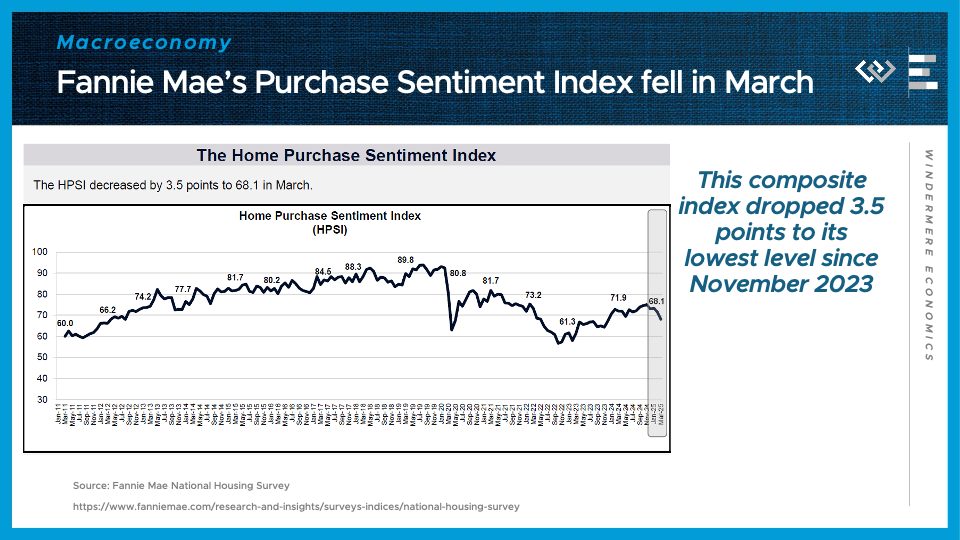
And in the housing market, the Fannie Mae Home Purchase Sentiment Index fell in March to its lowest level in about a year and a half.
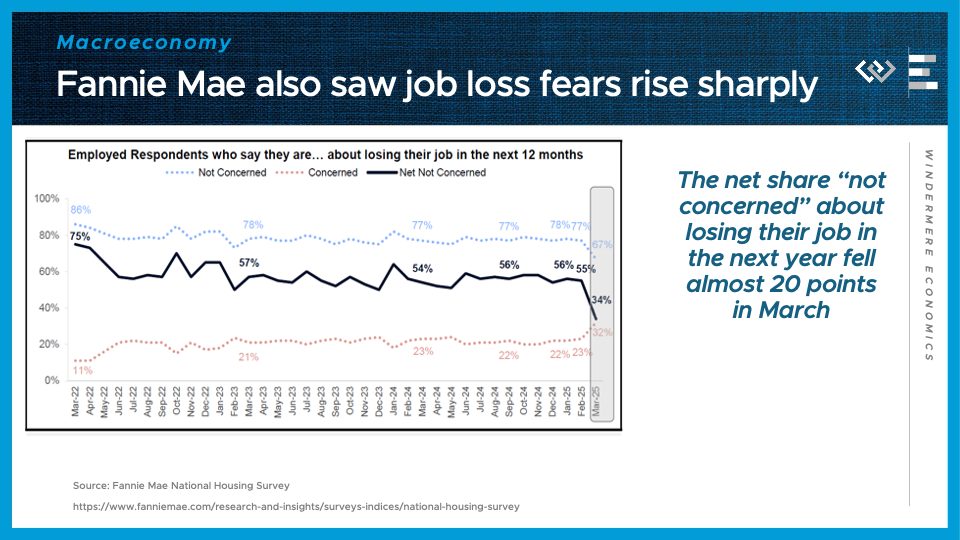
The main factor driving that decline was a sharp increase in respondents’ fears of job loss in the next 12 months. Unlike the Michigan chart a minute ago, this is respondents’s fears of losing their own job. That is likely to cause some would-be home buyers and sellers to hunker down and maybe press “Pause” on buying or selling until their outlook brightens up.
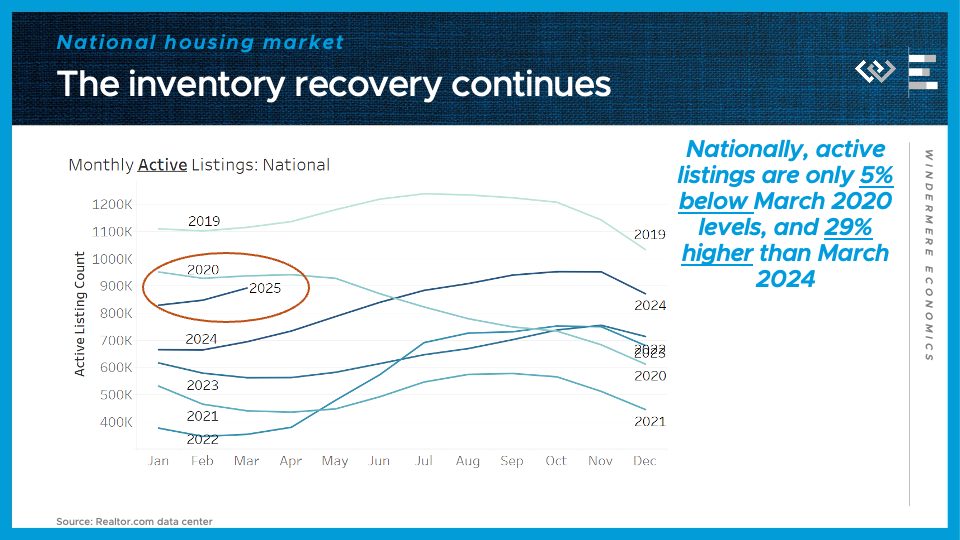
Speaking of the housing market: Data for March continue to show a relatively balanced spring market. Active inventory is only 5% below March 2020 levels, on the eve of the pandemic, and up 29% from last year.
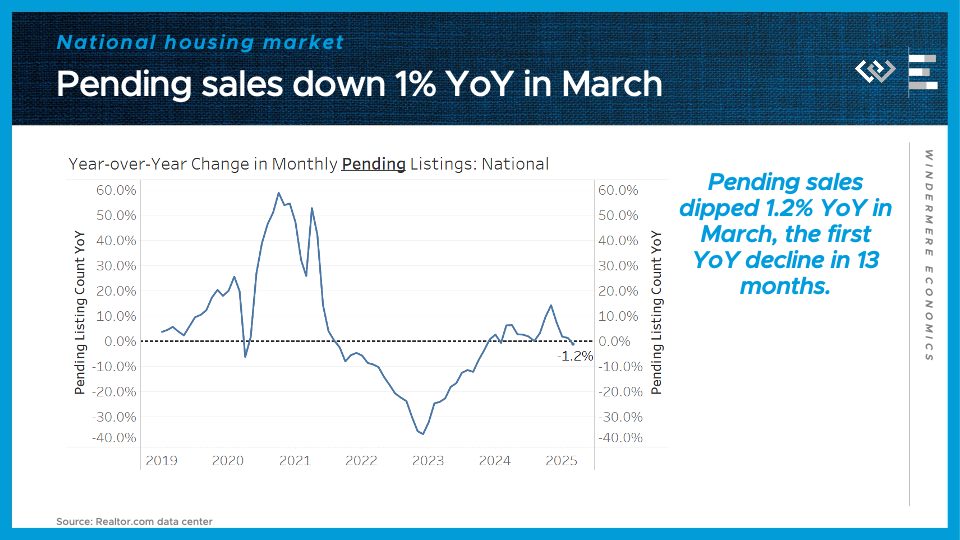
Pending sales are down about 1% from last March. So before any tariff impact, we are seeing just a tiny decline in sales activity.
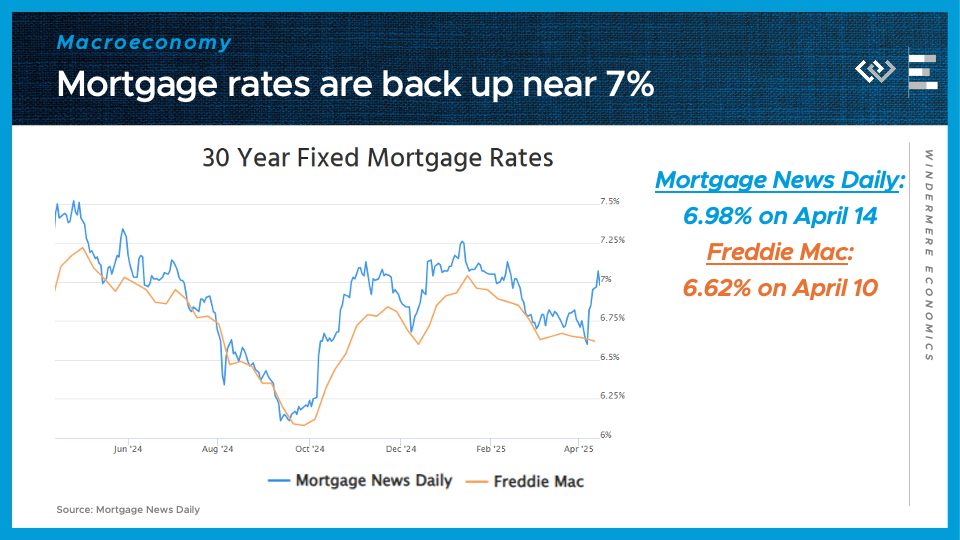
Finally, I’ll end by checking in with the USUAL elephant in the room: mortgage rates, which are back up around 7%. The financial market turmoil in response to the tariff news briefly pushed interest rates down, but then mortgages got carried along with a surprising upswing in US bond yields. That may settle back down in the coming weeks, but uncertainty really remains the watchword for economic data this year.
")


