ECONOMIC OVERVIEW
Oregon State has added almost 40,000 new jobs over the past 12 months. Although growth has slowed significantly, we can attribute this to the fact that the state has reached “full employment.” When this is achieved, growth has to rely on the population rising to drive jobs higher and, inevitably, the pace slows. Year-over-year, employment in Oregon rose by 2.2%.
In February, the state unemployment rate fell to 4% and is now at a level that has not been seen in more than four decades. Additionally, the number of people who are unemployed dropped to about 82,000—a figure last seen in August of 1995.
HOME SALES
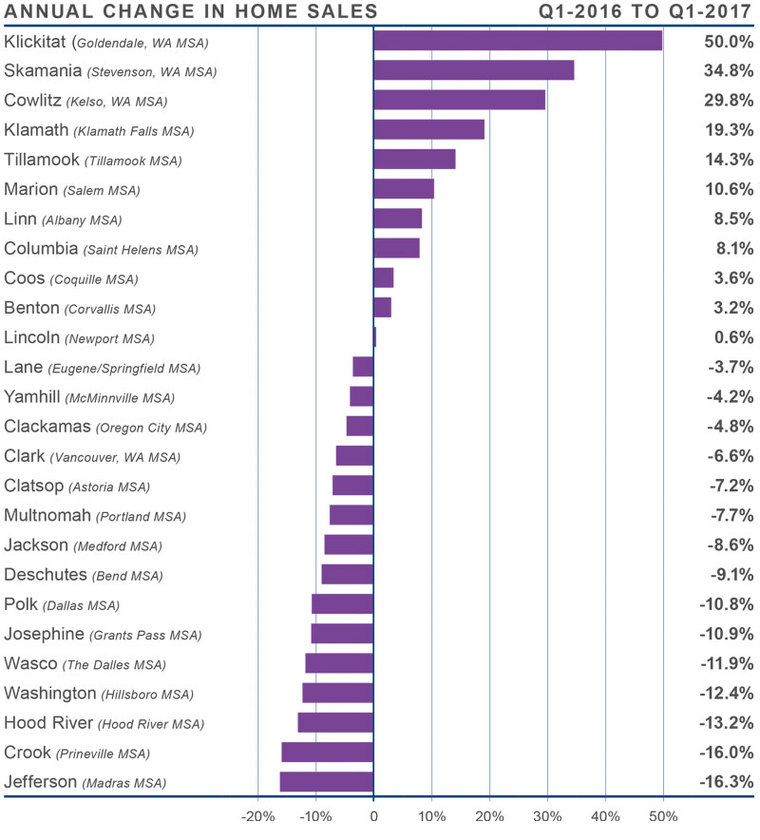
- First quarter home sales fell by 4.5% compared to the same period last year. In total, 12,299 homes sold in the first quarter of this year.
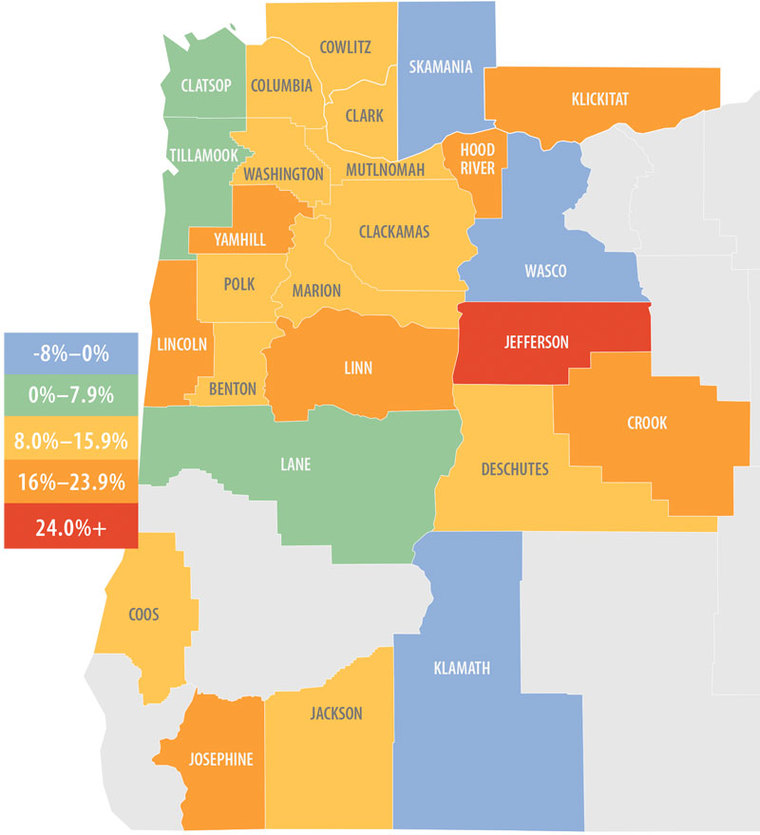
- Sales rose the fastest in Klickitat County, which saw a 50% increase over Q1 2016. There were also noticeable increases in sales in Skamania, Cowlitz, Klamath, and Tillamook Counties. Home sales fell the most in Jefferson, Crook, Hood River, and Washington Counties.
- There were 11 counties where sales rose year over year, and 15 counties that reported declines.
- The low number of homes for sale continues to affect the market and is pushing home sales activity lower. This means sellers remain firmly in the driver’s seat.

HOME PRICES
 The average home price in the region rose by 9.4% year-over-year to $334,299. This is down from 10.9% in the fourth quarter of 2016.
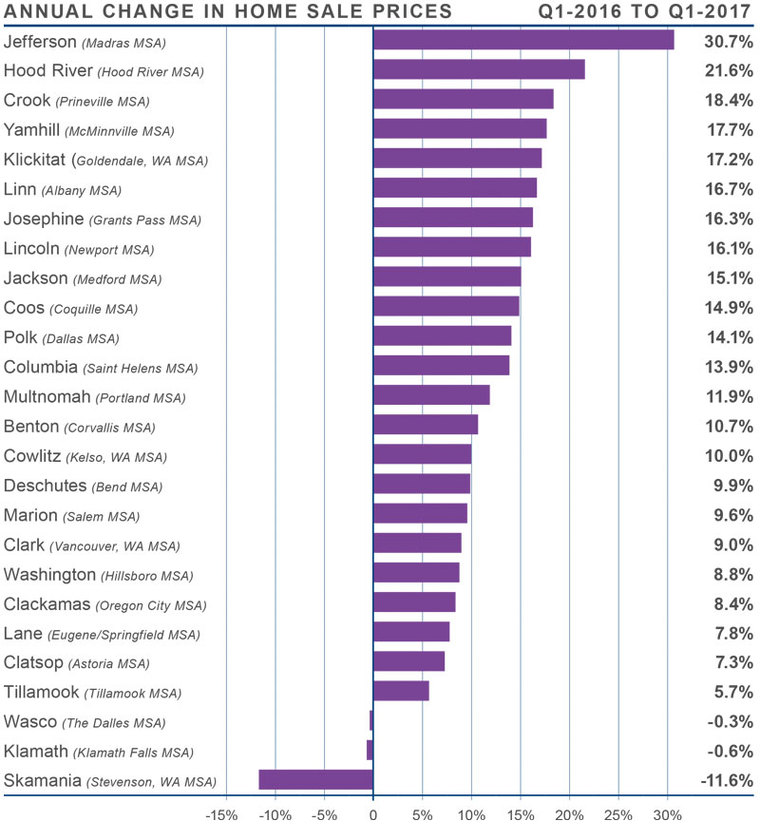
- Jefferson County took over as the market with the strongest annual price growth, with homes selling for 30.7% above the level seen a year ago.
- All but three counties experienced rising prices when compared to the first quarter of 2016, and most of these saw significant, double-digit increases.
- Despite rising interest rates, the lack of inventory continues to drive home prices higher.

DAYS ON MARKET
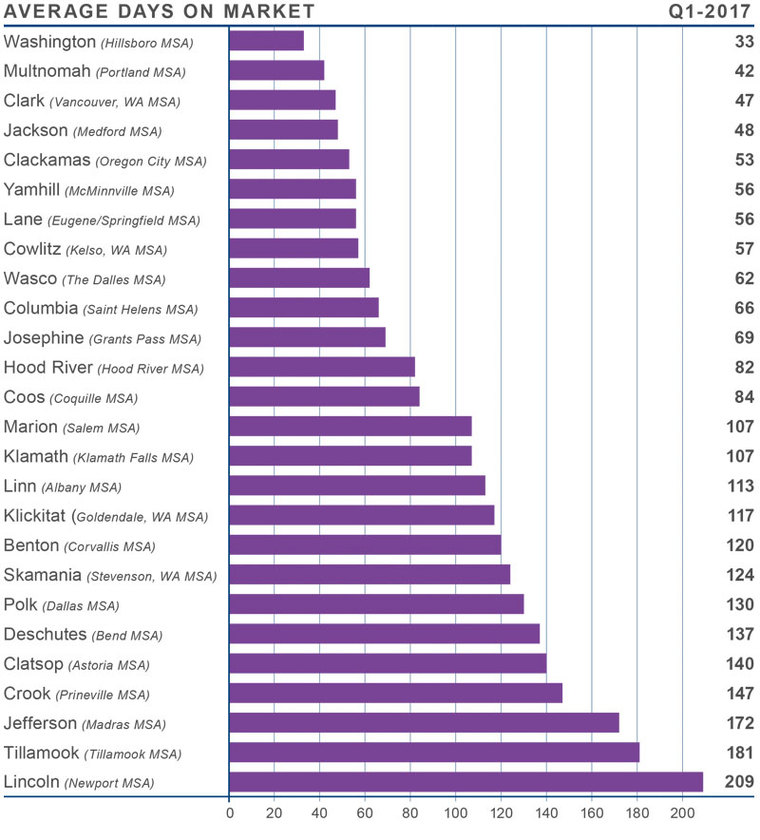
- The average number of days it takes to sell a home in the region dropped by five days when compared to the first quarter of 2016, but it took 17 days longer to sell a home than in the fourth quarter of 2016.
- The average time it took to sell a home in the region was 98 days.
- In several counties, days on market rose when compared to the same period a year ago. This is not too surprising given that the counties where sales slowed are small, which often leads to erratic demand.
- Counties where homes sold the fastest were Washington and Multnomah Counties, where it took an average of 33 and 42 days respectively for homes to sell.

CONCLUSIONS
 The speedometer reflects the state of the region’s housing market using housing inventory, price gains, home sales, interest rates, and larger economic factors. Economic growth in Oregon State remains impressive, and the region’s housing market clearly continues to benefit from such robust growth. Home sales have slowed, which has taken a little steam out of the strong appreciation rates we’ve seen over the past several months. That said, the market remains remarkably tight and unlikely to shift dramatically for the duration of 2017. As such, I have moved the needle slightly more toward sellers for the first quarter.

Matthew Gardner is the Chief Economist for Windermere Real Estate, specializing in residential market analysis, commercial/industrial market analysis, financial analysis, and land use and regional economics. He is the former Principal of Gardner Economics and has over 25 years of professional experience both in the U.S. and U.K.
 Facebook
 X
X
 Pinterest
 Copy Link


