The following analysis of the greater Las Vegas real estate market is provided by Windermere Real Estate Chief Economist Matthew Gardner. We hope that this information may assist you with making better-informed real estate decisions. For further information about the housing market in your area, please don’t hesitate to contact your Windermere agent.
Regional Economic Overview
COVID-19 led to the loss of almost 247,000 jobs in the Las Vegas market—a very significant number. I am happy to report that more than 114,000 of them have now returned. The Leisure & Hospitality sector, unsurprisingly, was significantly impacted, but we are seeing continued improvement here: more than 75,000 of the 136,000 jobs that were lost have returned. With the job recovery continuing at a decent pace, the unemployment rate, which peaked at a remarkable 34% in April, continues to improve. The November rate was 11.5%. The market still has a way to go to get back to where it was pre-COVID, but the improvement is palpable. While the job recovery remains in place, COVID-19 infection rates are still elevated, even if they have pulled back from the new peak seen in December. I remain hopeful that new infection rates will continue to drop and, if I am correct, more jobs will be recovered. But I don’t expect to see a faster recovery until a vaccine becomes readily available.
nevada Home Sales
❱ A total of 10,008 homes sold in the fourth quarter of 2020, an increase of 22.7% compared to the same period a year ago, and 5.2% higher than in the third quarter of 2020.
❱ Pending sales dropped 8.7% from the third quarter, suggesting that closings in the first quarter of 2021 may be lower than I would like to see. That said, pending sales were 27.4% higher year-over-year.
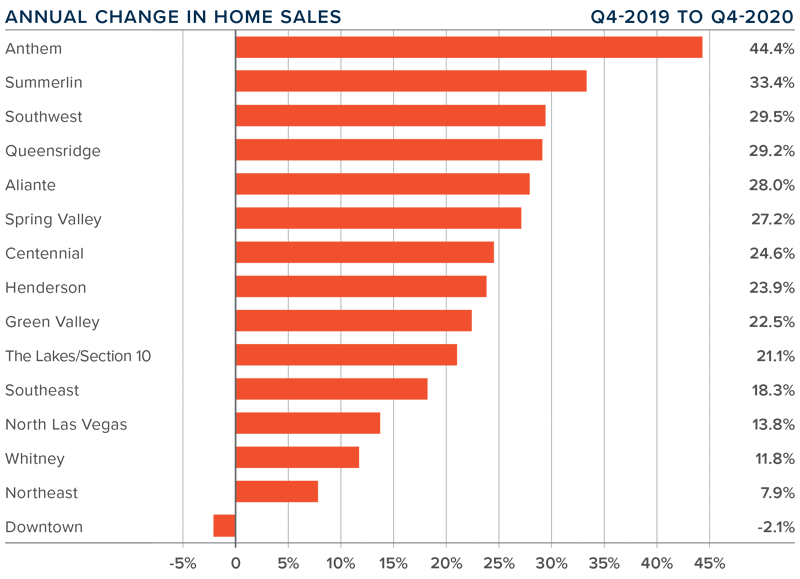
❱ Sales rose in every market other than Downtown, which saw a very modest drop. The Anthem area once again had significant growth. It is also worth noting that all but two markets saw double-digit growth in sales.
❱ Listing activity was down 16.9% compared to the third quarter, and 34.2% lower than the fourth quarter of 2019. I still expect listings will remain relatively muted until a vaccine is readily available and the Las Vegas economy gets back to as close to normal as possible.
nevada Home Prices
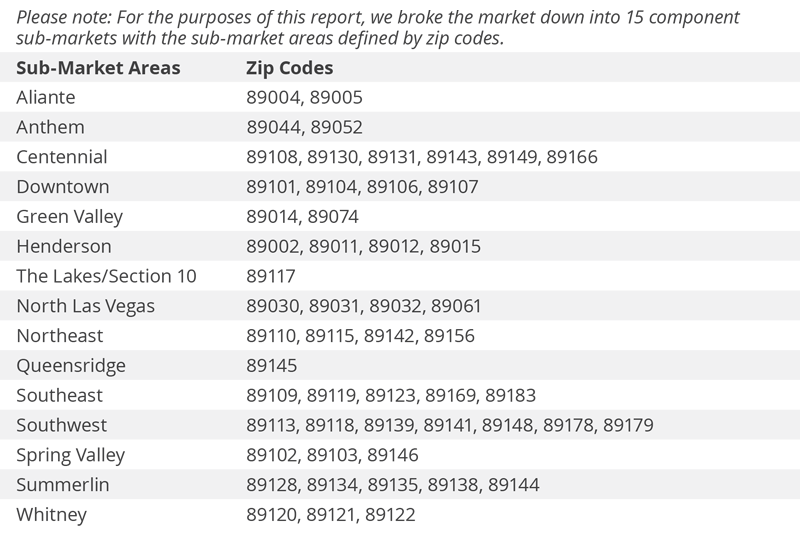
❱ With sales rising and inventory levels still very low, it was not surprising home prices continued to rise at well-above-average rates. The average sale price in the fourth quarter rose 17.6% year-over-year to $383,477. Prices were up 5.4% compared to the third quarter of 2020.
❱ Annual home-price growth continues at well-above-average levels, but as mortgage rates start to creep higher, I expect some modest slowing in the pace of growth. But not yet!
❱ Prices rose in every sub-market compared to the same quarter last year, with significant gains in Summerlin. An additional nine neighborhoods saw double-digit price growth.
❱ Buyer demand remains robust, which continues to benefit home sellers.
Days on Market
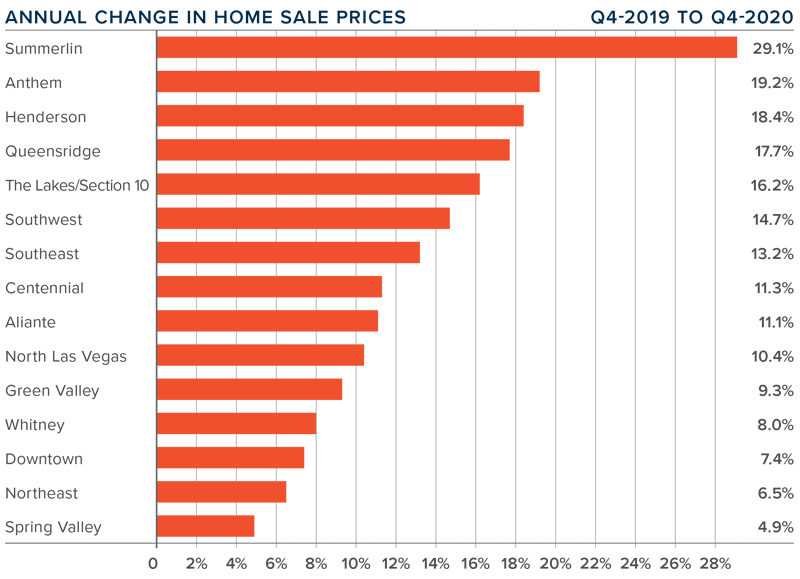
❱ The average time it took to sell a home in the region dropped nine days compared to the fourth quarter of 2019.
❱ Regionally, it took an average of 37 days to sell a home in the final quarter of 2020, which is 5 fewer days than in the third quarter.
❱ Days on market dropped or remained static in all the neighborhoods contained in this report compared to a year ago.
❱ The greatest decline in market time was again in The Lakes/Section 10, where the length of time it took to sell a home dropped 16 days.
Conclusions
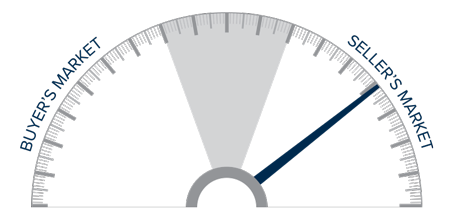
This speedometer reflects the state of the region’s real estate market using housing inventory, price gains, home sales, interest rates, and larger economic factors.
The market continues to recover from the impact of COVID-19. Demand is in place and buyers remain very active. Even modestly rising mortgage rates likely won’t be a deterrent to home buyers. Although frustrated by the lack of homes for sale, they are still looking, which benefits home sellers. As such, I am moving the needle a little more in their favor.
About Matthew Gardner

As Chief Economist for Windermere Real Estate, Matthew Gardner is responsible for analyzing and interpreting economic data and its impact on the real estate market on both a local and national level. Matthew has over 30 years of professional experience both in the U.S. and U.K.
In addition to his day-to-day responsibilities, Matthew sits on the Washington State Governors Council of Economic Advisors; chairs the Board of Trustees at the Washington Center for Real Estate Research at the University of Washington; and is an Advisory Board Member at the Runstad Center for Real Estate Studies at the University of Washington where he also lectures in real estate economics.
 Facebook
 X
X
 Pinterest
 Copy Link


