ECONOMIC OVERVIEW
Over the past 12 months (through August 2016), the markets covered by this report added 273,200 new jobs and the total number of people claiming unemployment insurance dropped by over 100,000. With these shifts toward full employment, the area’s unemployment rate dropped from 6.2% to 5.1% during the past year. Some might note that unemployment was only 4.3% in second quarter and wonder why the rate has increased; however, the reason for this is that there was a substantial increase in the civilian labor force which rose by over 200,000 people.
HOME SALES ACTIVITY
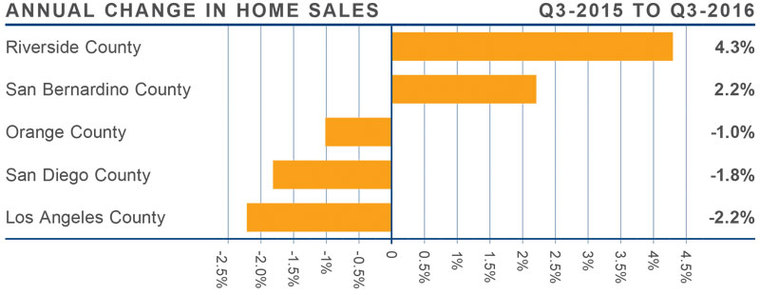
- There were a total of 52,550 home sales in third quarter of 2016. This was 0.6% lower than the same period in 2015, and 3.1% lower than seen in the second quarter of this year.
- The drop in sales is likely a result of inventory levels which remain well below historic averages. It’s worth noting that, while the number of listings in the third quarter was 4.2% lower than the same quarter a year ago, it increased by 5.9% relative to the second quarter of this year.
- Home sales continue to be a mixed bag with transactions higher in Riverside and San Bernardino Counties, but lower in L.A., Orange, and San Diego Counties.
- Even with the recent increase in listings, we are still well below where we need to be for the market to be considered balanced.

HOME PRICES
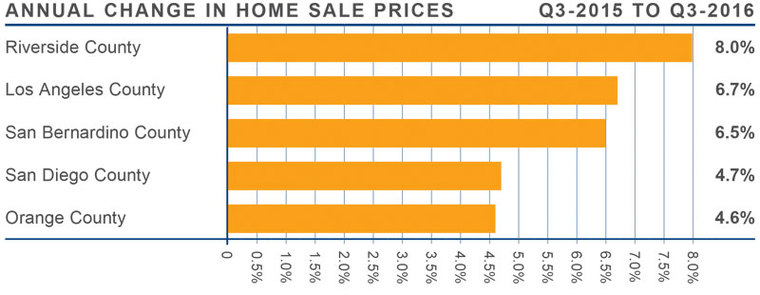
- When compared to third quarter of 2015, average prices in the region rose by 5.8% and are a modest 0.1% higher than seen in the second quarter of 2016.
- When compared to second quarter, San Diego, Riverside, and Los Angeles Counties all saw average home prices decline. While they are all up year-over-year, we may be seeing a small shift in the market in which price growth is expected to slow.
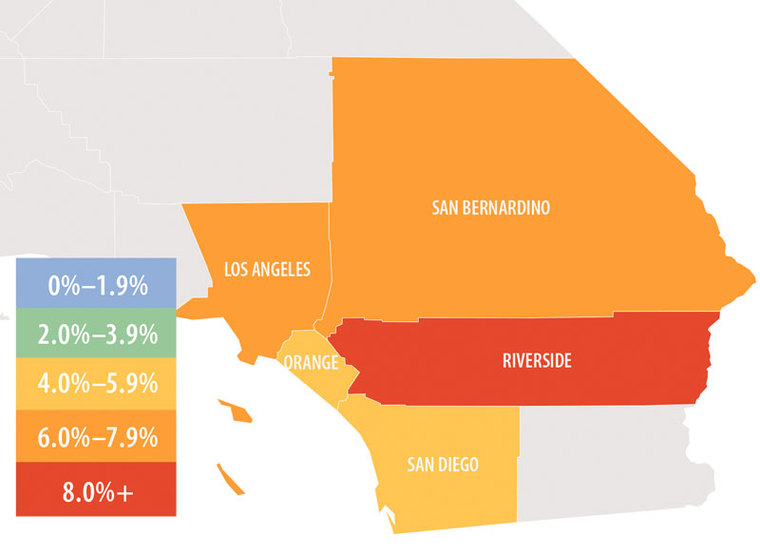
- Riverside County saw the greatest appreciation in home values (+8.0%). This was followed by Los Angeles County, where the average price rose 6.7%.
- Pending sales were up across the board, and it will be interesting to see what effect this jump may have on home prices in the fourth quarter.


DAYS ON MARKET
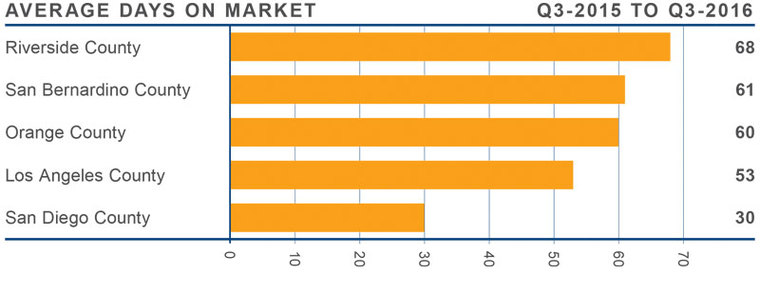
- The average time it took to sell a home in the region was 55 days. This is a drop of 3 days when compared to the third quarter of 2015.
- The drop in days on market is starting to slow. With the jump in new listings that I described earlier, we may see days on market start to rise as we enter the winter months.
- Homes in San Diego County continue to sell at a faster rate than the other markets in the region. In the third quarter, it took an average of 30 days to sell a home there, which is four days less than seen a year ago.
- All five counties saw a drop in the amount of time it took to sell a home between the third quarter of 2015 and the third quarter of 2016.

CONCLUSIONS
 The speedometer reflects the state of the region’s housing market using housing inventory, price gains, sales velocities, interest rates and larger economics factors. The regional economy continues to add jobs and this continues to increase the demand for housing.
That said, price points in some markets are approaching pre-bubble levels and, without sufficient income growth, housing affordability will become an issue. I remain hopeful that additional housing inventory will address this pent-up demand, causing prices to appreciate at more modest rates.
I’ve left the speedometer unchanged from last quarter. Intuitively, I think the market may be headed back to being more balanced, but I want to see a few more quarters of moderating home prices and greater choice for buyers before I make that call.
 Matthew Gardner is the Chief Economist for Windermere Real Estate, specializing in residential market analysis, commercial/industrial market analysis, financial analysis, and land use and regional economics. He is the former Principal of Gardner Economics, and has over 25 years of professional experience both in the U.S. and U.K.
 Facebook
 X
X
 Pinterest
 Copy Link


