ECONOMIC OVERVIEW
The markets covered by this report, which include Los Angeles, San Diego, San Bernardino, Orange, and Riverside Counties, added 115,900 new jobs between February 2016 and February 2017, and the unemployment rate dropped from 5.2% to 4.6%. This represents fewer new jobs than were seen in our last report, but as we continue to move toward “full employment”, a slowing in employment growth is to be expected.
HOME SALES
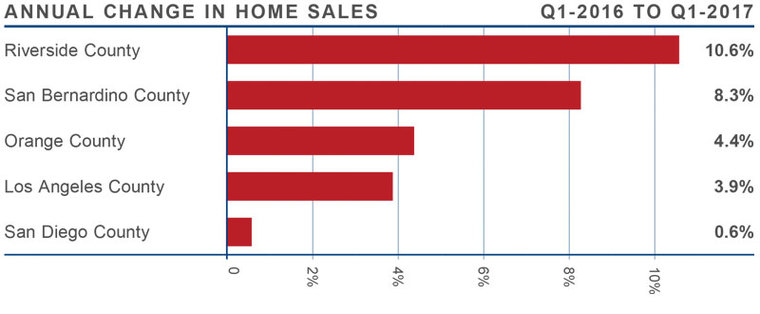
- There were a total of 40,561 home sales in first quarter of this year. This was 5.1% higher than the same period in 2016, but 12% lower than the fourth quarter of last year. This can be attributed to the continued low level of homes for sale throughout the region.
- The average number of homes for sale remains well below that seen a year ago (-15.2%), reversing the more modest decline in listings that we saw in the last quarter of 2016.
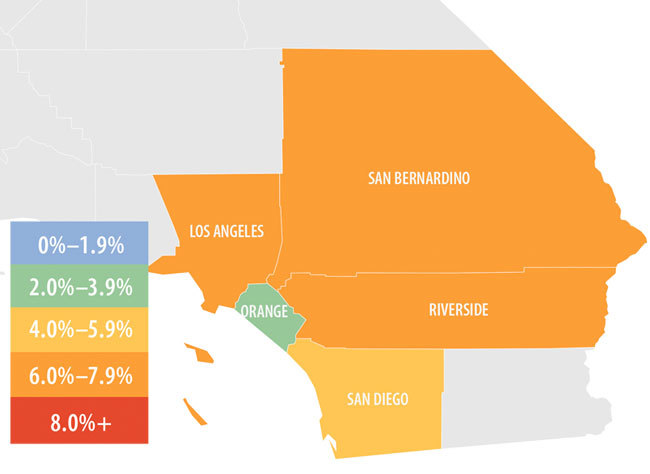
- Home sales were up across the board, with Riverside County continuing to hold the lead with a substantial 10.6% increase relative to the same period in 2016. Healthy sales were also seen in San Bernardino County. San Diego County experienced some slowing in home sales, but that’s likely due to the fact that the number of homes for sale is down 20% compared to a year ago.
- With just 31,000 active listings in the first quarter, sellers are firmly in the driver’s seat. I remain hopeful that inventory levels will rise as we move through the spring; however, the Southern Californian markets are likely to see a housing supply shortage through the balance of the year.

HOME PRICES
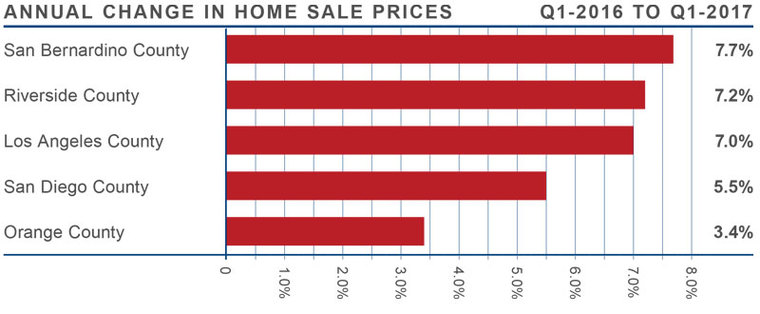
 Average prices in the region rose by 5.3% compared to first quarter of 2016, and are 2.6% higher than fourth quarter of 2016.
- Home values in San Diego, Los Angeles and Orange Counties rose to levels that are getting close to their pre-recession peaks. It is possible that home prices —in concert with rising mortgage rates—are likely to slow at some point, but not quite yet.
- San Bernardino County saw the greatest annual appreciation in home values (+7.7%). This was followed by Riverside County, where the average price rose 7.2% year-over-year.
- Pending home sales continue to trend higher, but are slowing due to tight inventory levels. Demand remains strong and sales prices will likely continue their upward trajectory as buyers outnumber sellers.

DAYS ON MARKET
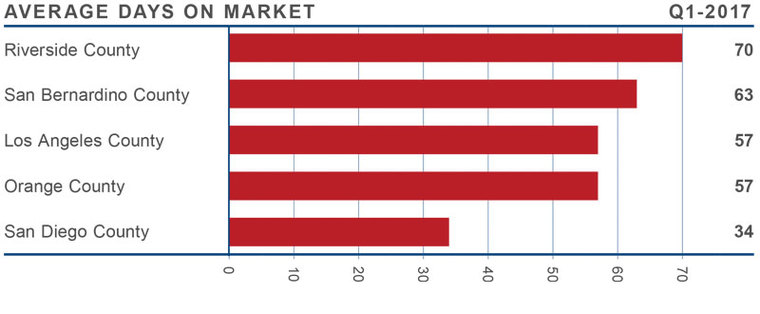
- The average time it took to sell a home in the region was 56 days. This is a drop of 11 days when compared to the first quarter of 2016, but two days longer than in the fourth quarter of 2016.
- The biggest drop in the number of days it took to sell a home was in San Bernardino and Orange Counties, where it took 14 fewer days to sell a home compared to a year ago.
- Homes in San Diego County continue to sell at a faster rate than the other markets in the region. In the first quarter, it took an average of 34 days to sell a home, which is four days less than a year ago.
- All five counties saw a drop in the amount of time it took to sell a home between the first quarter of 2016 and the first quarter of 2017.

CONCLUSIONS
 The speedometer reflects the state of the region’s housing market using housing inventory, price gains, home sales, interest rates, and larger economic factors.
The Southern California economy continues to add jobs, which in turn is increasing the already-high demand for housing. Rising mortgage rates have had a modest effect on slowing home price growth, but they are getting close to record territory in several of the region’s markets.
I was hopeful that we would see a bit of a spring “bump” in listings, but that has not been the case. As such, the market continues to strongly favor sellers, so I have moved the needle a little more in their direction.
 Matthew Gardner is the Chief Economist for Windermere Real Estate, specializing in residential market analysis, commercial/industrial market analysis, financial analysis, and land use and regional economics. He is the former Principal of Gardner Economics, and has over 25 years of professional experience both in the U.S. and U.K.
 Facebook
 X
X
 Pinterest
 Copy Link


