The following analysis of the Southern California real estate market is provided by Windermere Real Estate Chief Economist Matthew Gardner. We hope that this information may assist you with making better-informed real estate decisions. For further information about the housing market in your area, please don’t hesitate to contact me.
ECONOMIC OVERVIEW
The counties covered by this report—Los Angeles, San Diego, San Bernardino, Orange, and Riverside—added 164,100 new jobs between February 2017 and February 2018. As a result, the unemployment rate dropped from 4.8% to 4.1%. Employment growth in Southern California continued to pick up a bit as 2018 started, and I anticipate this will continue as we move through the year.
HOME SALES ACTIVITY
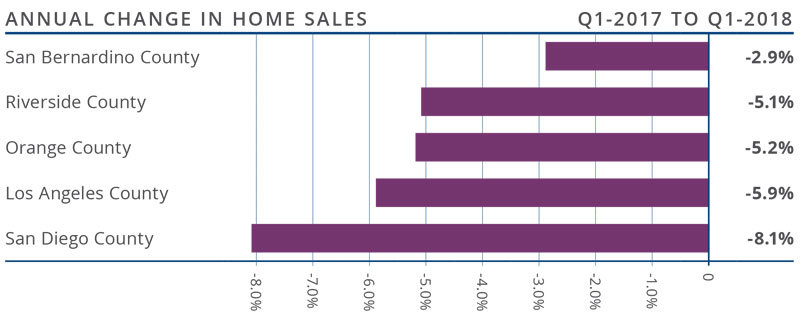
- There were 38,712 home sales in the first quarter of 2018. This was 5.7% lower than the same period in 2017 and 14.6% lower than the final quarter of 2017.
- The number of homes for sale continues to run well below the levels seen a year ago (-8.0%), and was 2.7% lower than in the final quarter of 2017.
- Home sales dropped across the board. The most pronounced decline was in San Diego County, which fell by 8.1%. As stated in last quarter’s report, this drop can be attributed to woefully low levels of inventory.
- There was an average of 28,835 active listings in the first quarter—well below what is needed to get to a balanced market.

HOME PRICES

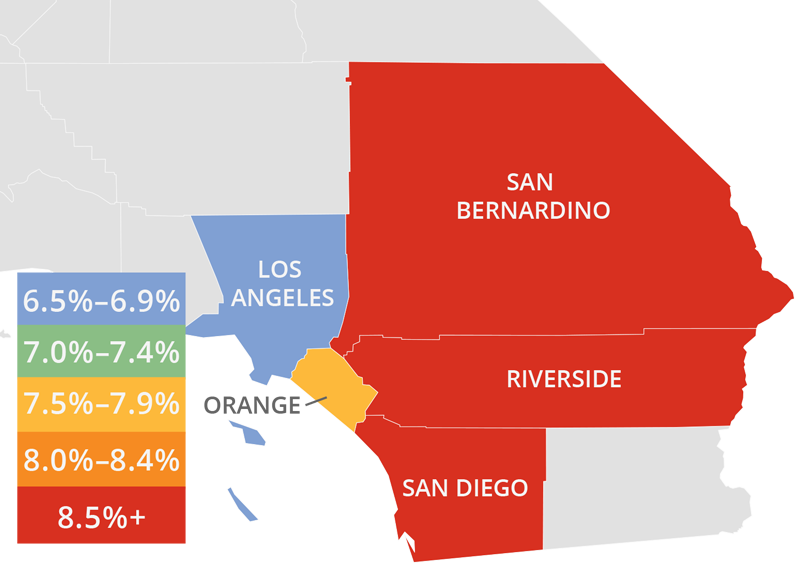
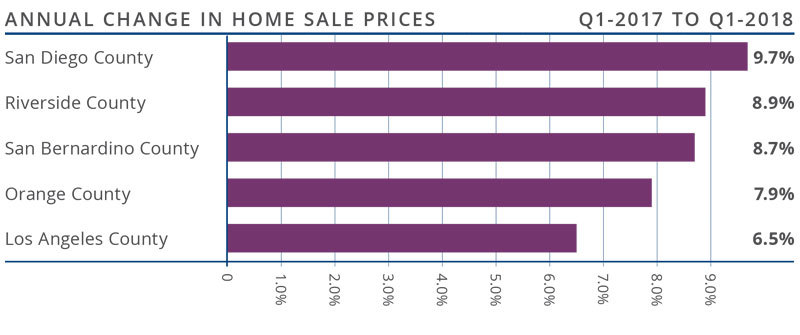
- Year-over-year, average prices in the region rose by 7.5% and were 1.1% higher than in the fourth quarter of 2017.
- Affordability is an ongoing issue and one that, in concert with limited inventory, continues to push home prices higher. New construction activity is still constrained and this puts further upward pressure on prices. Though California is looking at legislation to free up inventory, as well as to add more housing units via Senate Bill 827 and adjustments to Prop. 13, I still believe that prices will continue to rise at above-average rates for the foreseeable future.
- San Diego County had the greatest annual appreciation in home values (+9.7%) but there were solid price increases across the rest of the region as well.
- Pending home sales dropped by 0.3% compared to the first quarter of 2017, which indicates that closings in the second quarter of this year are likely to only see modest increases. Demand for homes in 2018 will remain positive but, with limited inventory, demand is likely to still outstrip supply.

DAYS ON MARKET
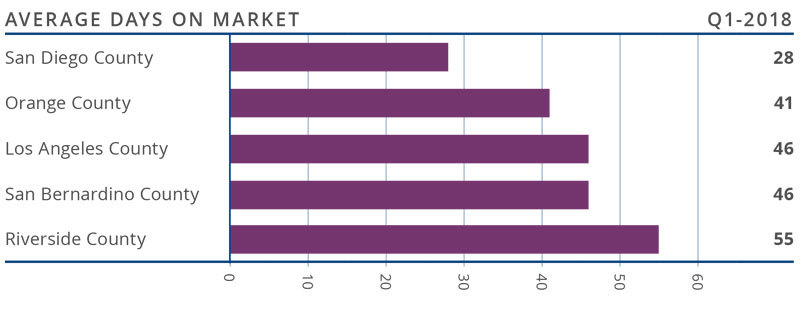
- The average time it took to sell a home in the region was 43 days. This is a drop of 13 days compared to the first quarter of 2017, and matches the final quarter of 2017.
- Homes in San Diego County continue to sell at a faster rate than other markets in the region. In the first quarter, it took an average of just 28 days to sell a home, which is 5 fewer days than a year ago.
- The biggest drop in the number of days it took to sell a home was in San Bernardino County, where it took 16 fewer days compared to the same period last year.
- All five counties saw a drop in the amount of time it took to sell a home compared to the first quarter of 2017.

CONCLUSIONS

The speedometer reflects the state of the region’s housing market using housing inventory, price gains, home sales, interest rates, and larger economic factors.
The Southern California economy continues to expand, which magnifies demand for all housing types. Mortgage rates—although rising—are still very favorable when compared to historic averages, and low inventory continues to drive prices higher. The number of homes for sale in the region is still well below the levels needed for a balanced market. Given all of these factors, I have moved the needle a little more in favor of sellers.

Mr. Gardner is the Chief Economist for Windermere Real Estate, specializing in residential market analysis, commercial/industrial market analysis, financial analysis, and land use and regional economics. He is the former Principal of Gardner Economics, and has more than 30 years of professional experience both in the U.S. and U.K.
 Facebook
 X
X
 Pinterest
 Copy Link


