
 Facebook
 X
X
 Pinterest
 Copy Link
Q3 2023 Colorado Real Estate Market Update

The following analysis of select counties of the Colorado real estate market is provided by Windermere Real Estate. We hope that this information may assist you with making better-informed real estate decisions. For further information about the housing market in your area, please don’t hesitate to contact your Windermere Real Estate agent.
Regional Economic Overview
The pace of job gains in Colorado picked up in the third quarter. The state added 42,700 new jobs over the past year, representing a growth rate of 1.5%. That said, growth has certainly slowed from what we saw over the past two years. The Denver and Colorado Springs metro areas saw jobs rise by only .1%; the Boulder metro area saw jobs rise .2%; Greeley rose .6%; and the Fort Collins metro area grew 1.7%.
The state unemployment rate in August was 3.1%, up from 2.6% in the third quarter of 2022. By metro area, jobless rates ranged from a low of 3.2% in Boulder to a high of 3.8% in the Colorado Springs metropolitan area.
Colorado Home Sales
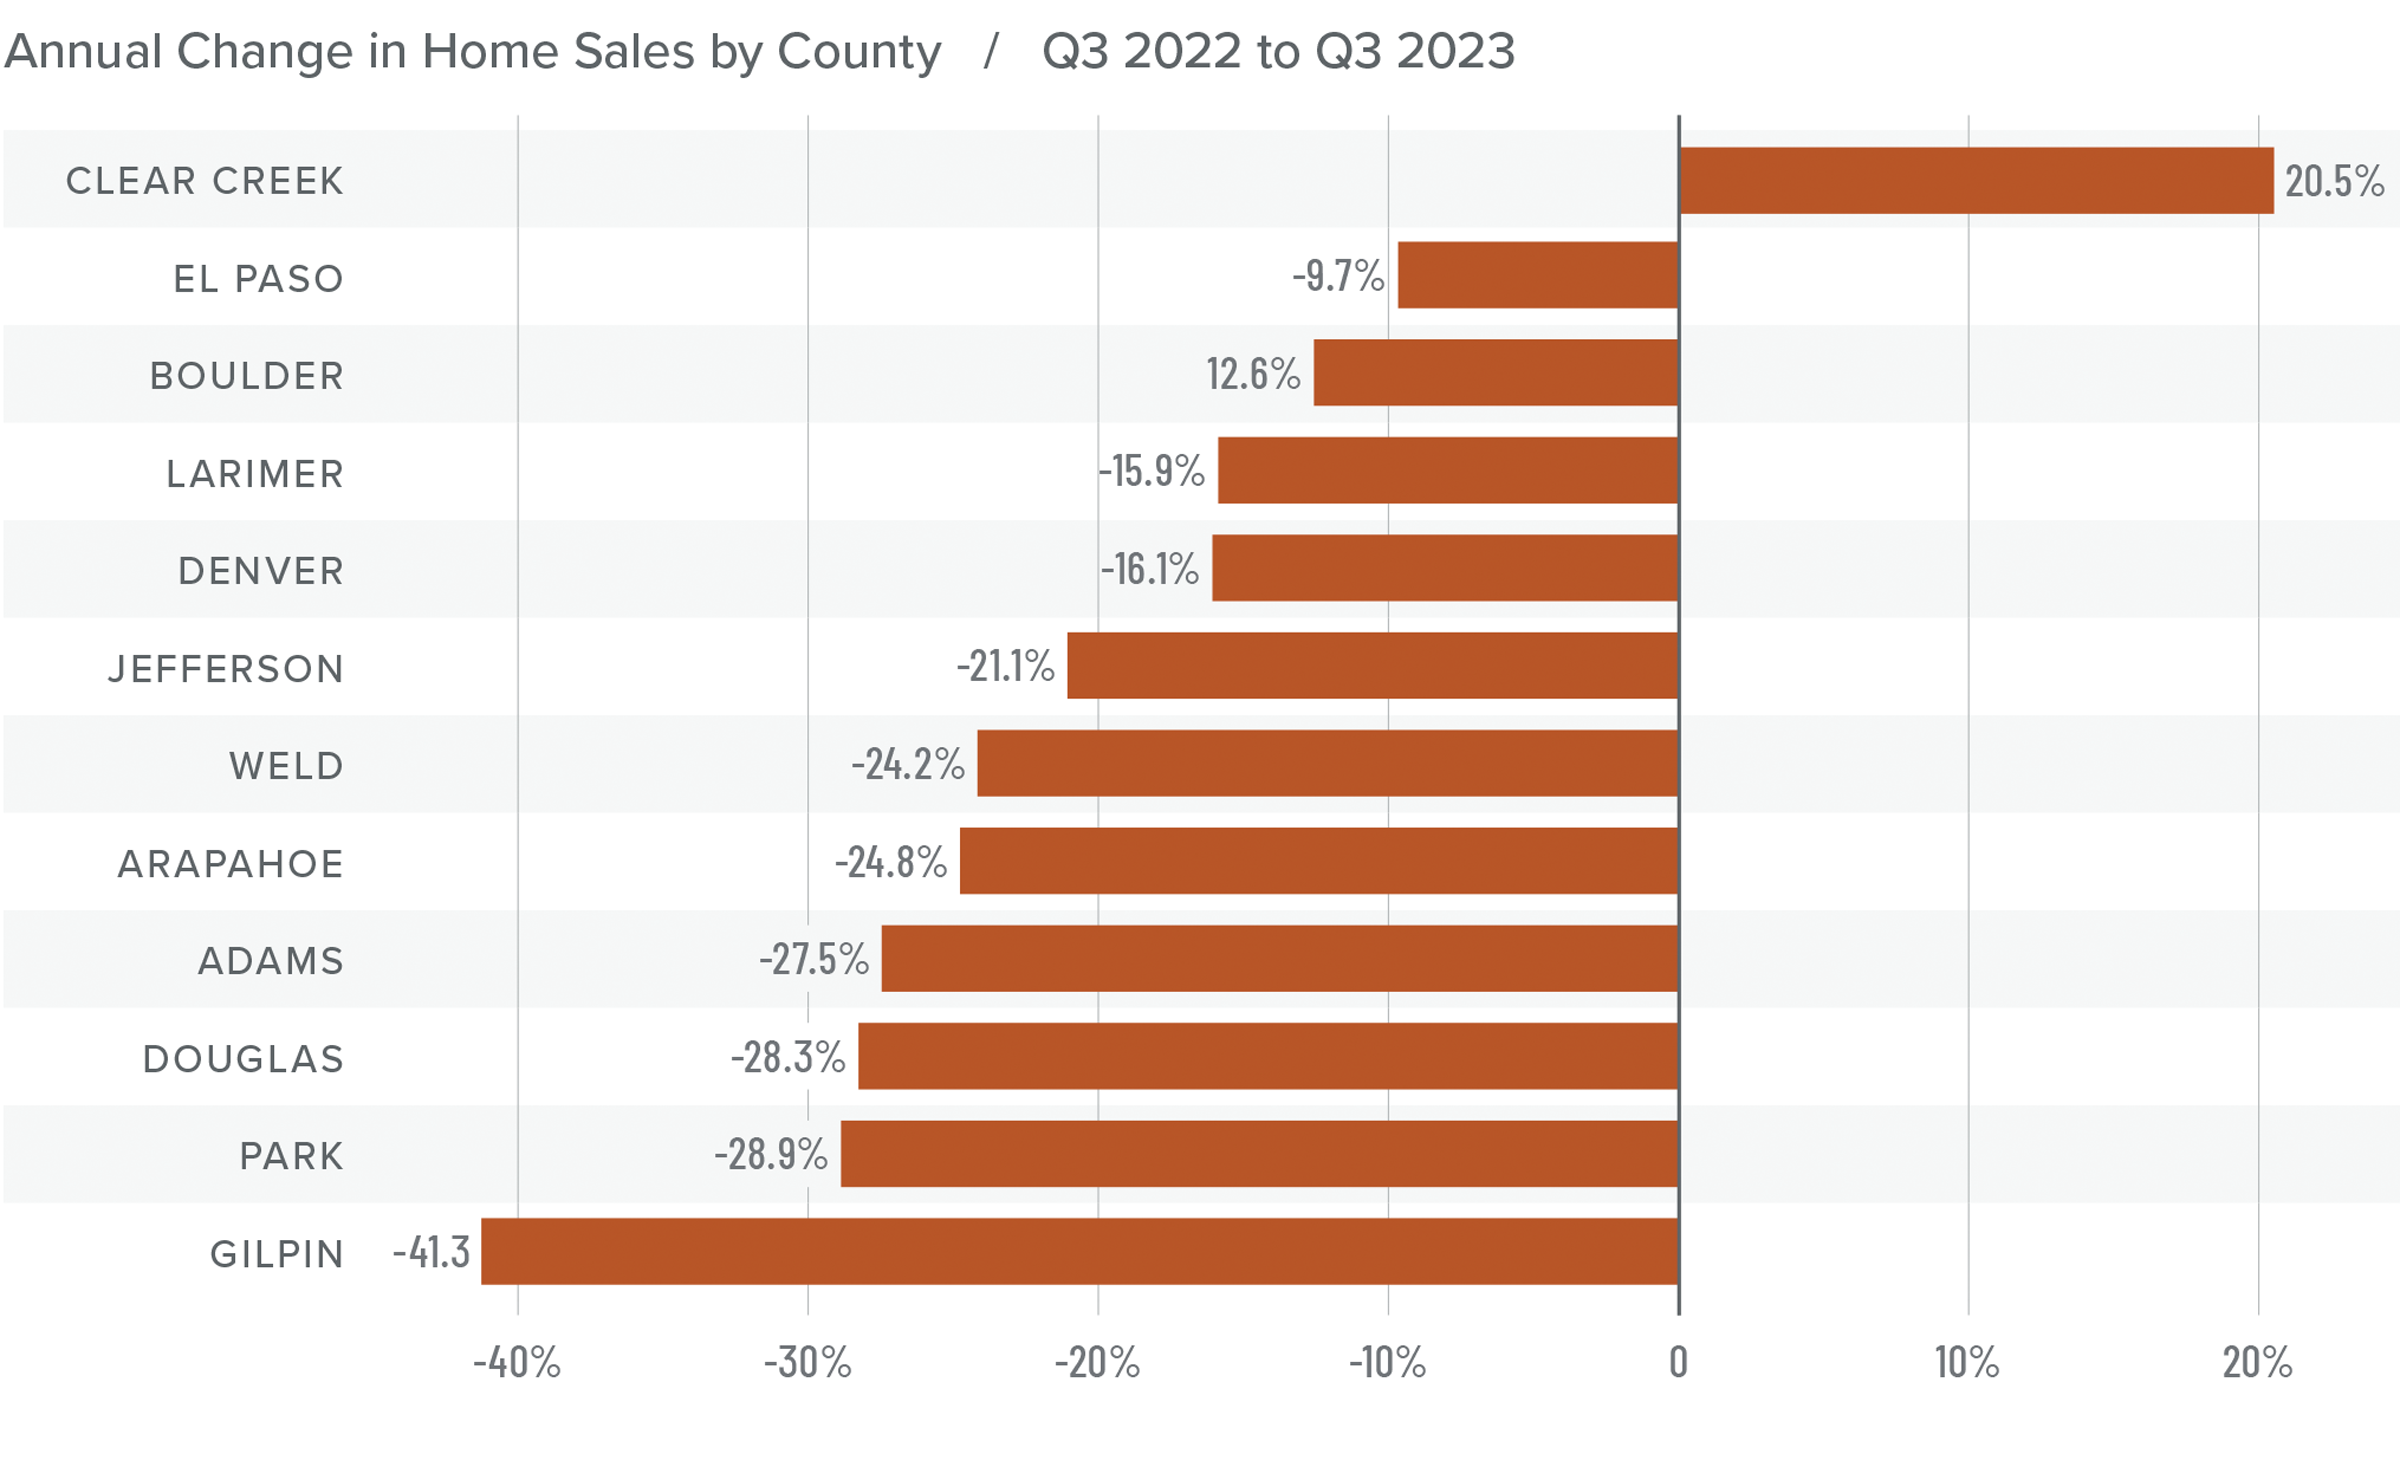
❱ In the third quarter of 2023, 8,597 homes sold, representing a drop of 20.9% from the same period in 2022. Sales were down 11.2% from the second quarter of this year.
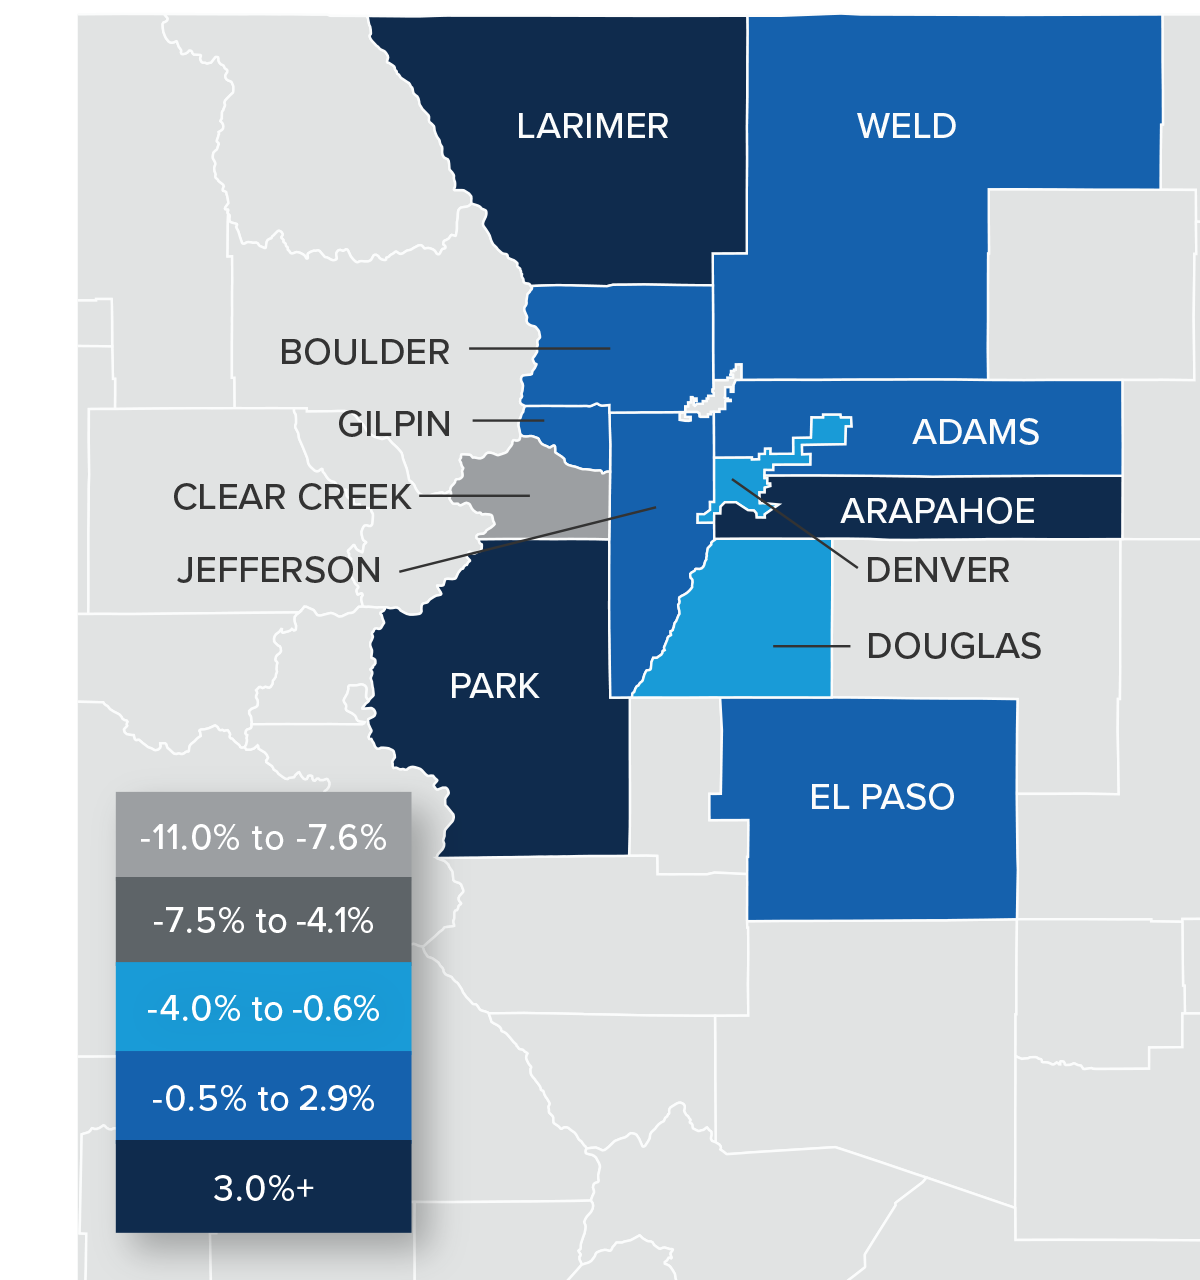
❱ Year over year, sales fell across all the markets covered by this report except for Clear Creek County. Compared to the second quarter of this year, sales fell in every county except Clear Creek and Gilpin.
❱ The year-over-year drop in sales is not a surprise given that mortgage rates are significantly higher today and inventory is lower. What is of some concern is that inventory was up more than 36% from the second quarter, yet sales still fell. It appears that higher mortgage rates are now having an impact on the market.
❱ Pending sales, which are an indicator of future closings, fell 14.3% from the second quarter, suggesting that sales may be lackluster in the final quarter of the year.
Colorado Home Prices
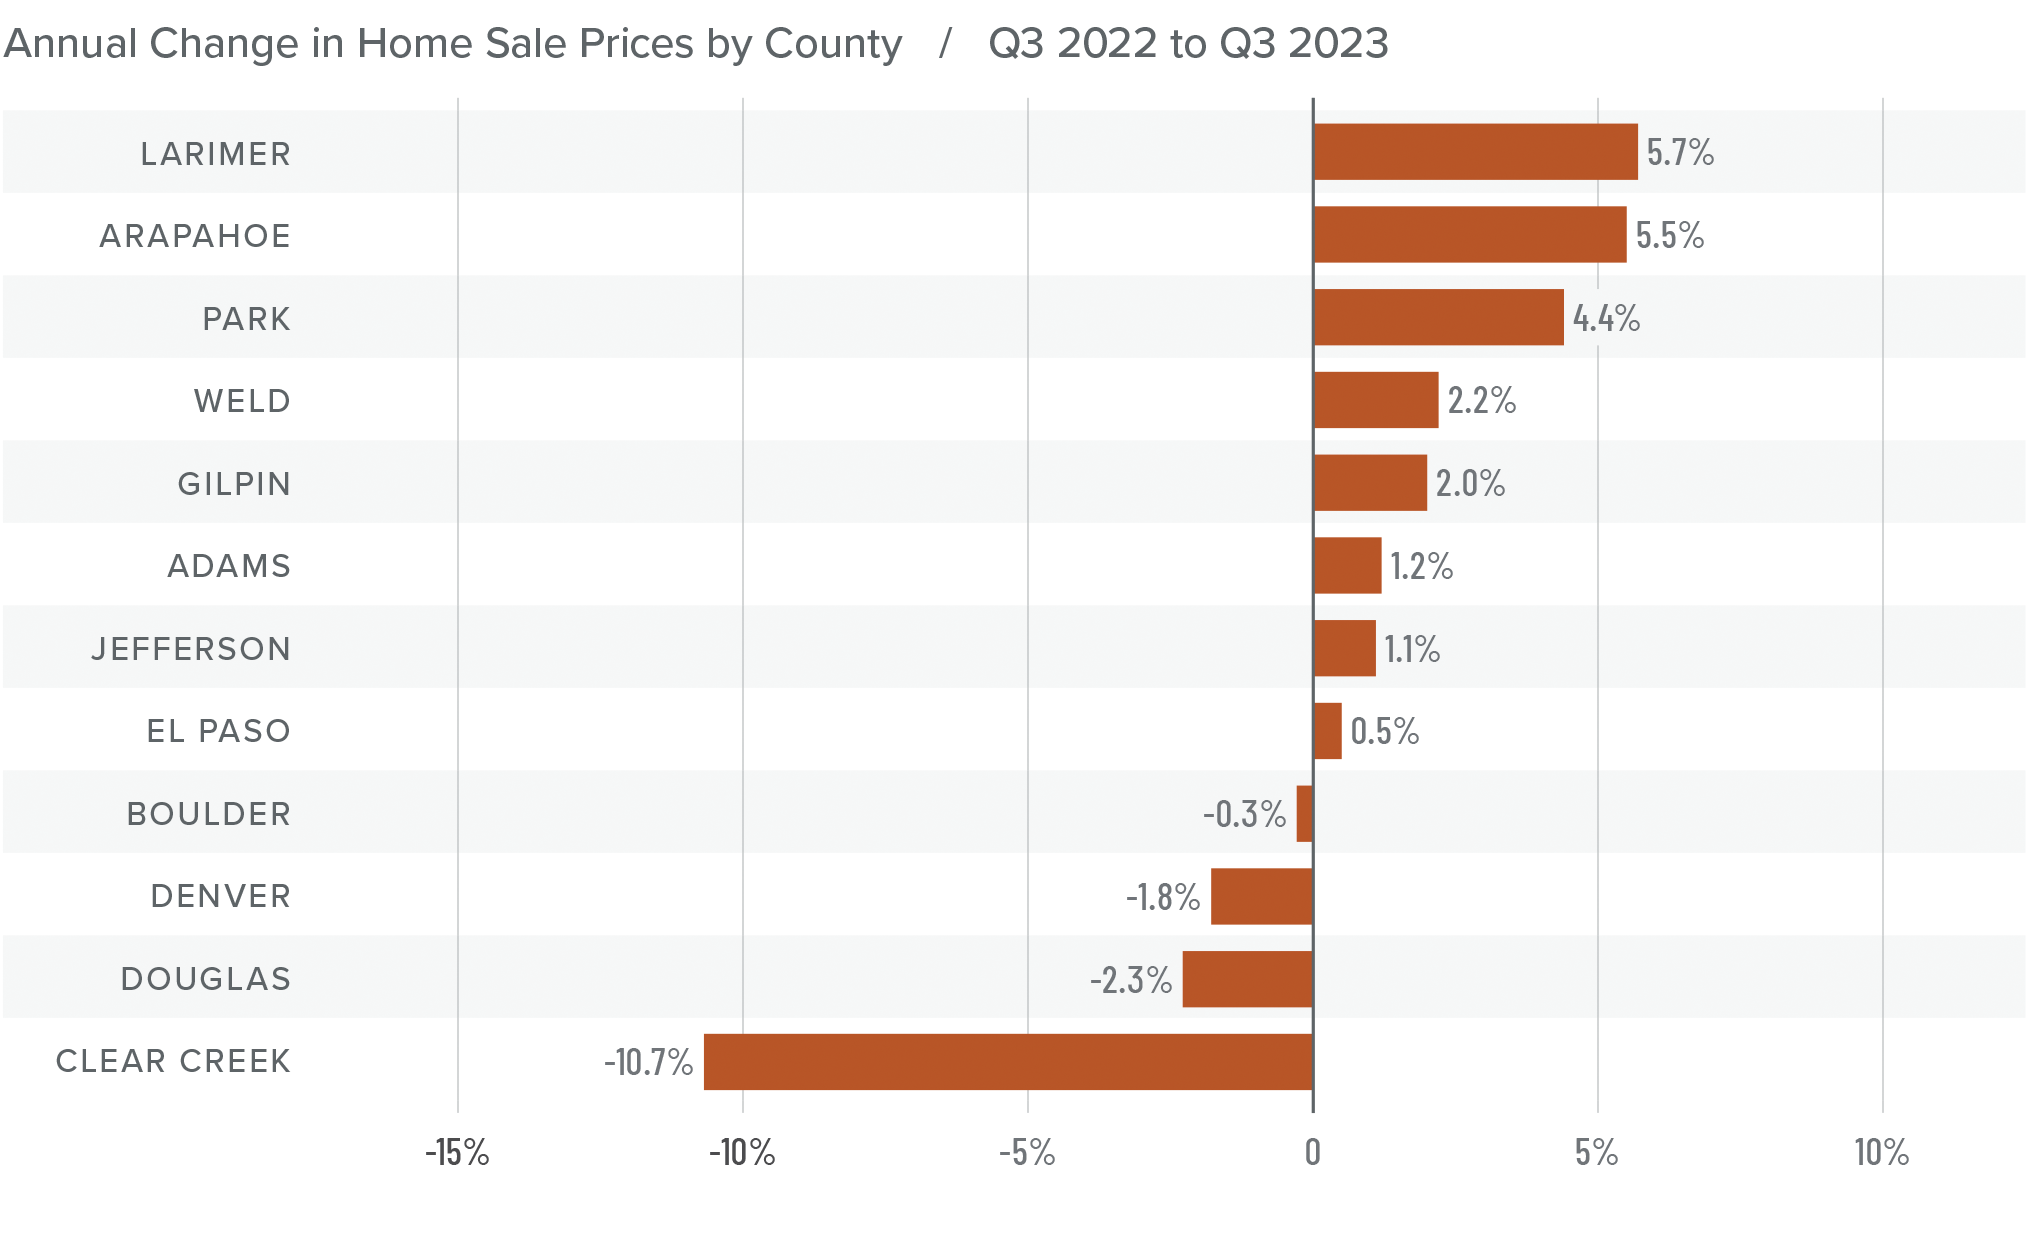
❱ The average home sale price rose 1.7% from the same period in 2022 to $665,725. Prices were 1.1% lower than in the second quarter of this year.
❱ Compared to the second quarter, prices rose in Adams, Larimer, Gilpin, and El Paso counties but fell in the balance of the market areas.
❱ Year over year, prices rose in eight counties and fell in four. Clear Creek County saw a significant drop but since very few home sales happen there, it’s not uncommon for prices to experience significant swings.
❱ List prices are a leading indicator that I follow closely, and given that they were lower in all markets except Weld County compared to the second quarter of this year, it appears that sellers have started reacting to higher mortgage rates. This will likely lead home prices to fall a little further as we move toward the end of the year.
Mortgage Rates
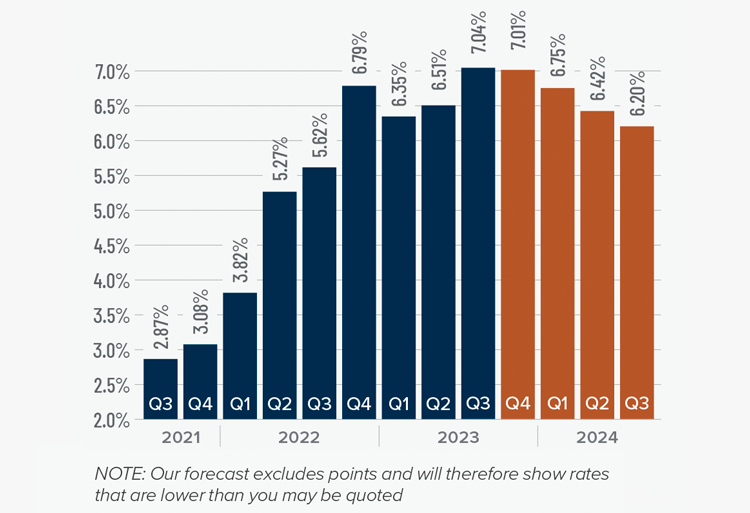
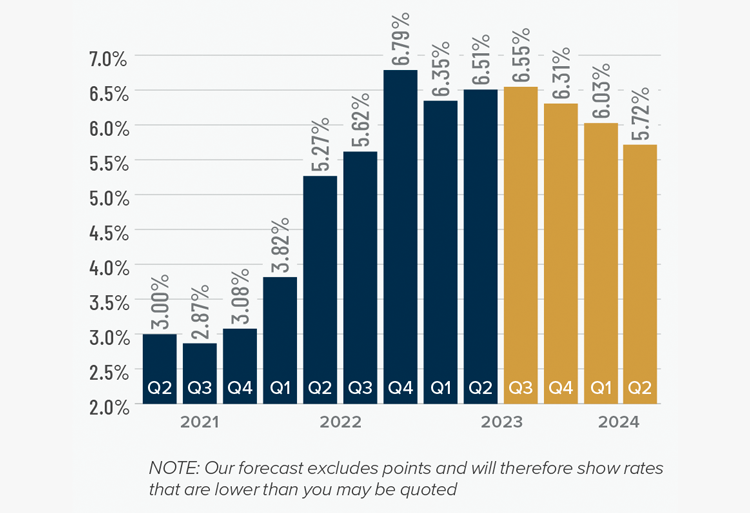
Mortgage rates continued trending higher in the third quarter of 2023 and are now at levels we have not seen since the fall of 2000. Mortgage rates are tied to the interest rate (yield) on 10-year treasuries, and they move in the opposite direction of the economy. Unfortunately for mortgage rates, the economy remains relatively buoyant, and though inflation is down significantly from its high, it is still elevated. These major factors and many minor ones are pushing Treasury yields higher, which is pushing mortgage rates up. Given the current position of the Federal Reserve, which intends to keep rates “higher for longer,” it is unlikely that home buyers will get much reprieve when it comes to borrowing costs any time soon.
With such a persistently positive economy, I have had to revise my forecast yet again. I now believe rates will hold at current levels before starting to trend down in the spring of next year.
Colorado Days on Market
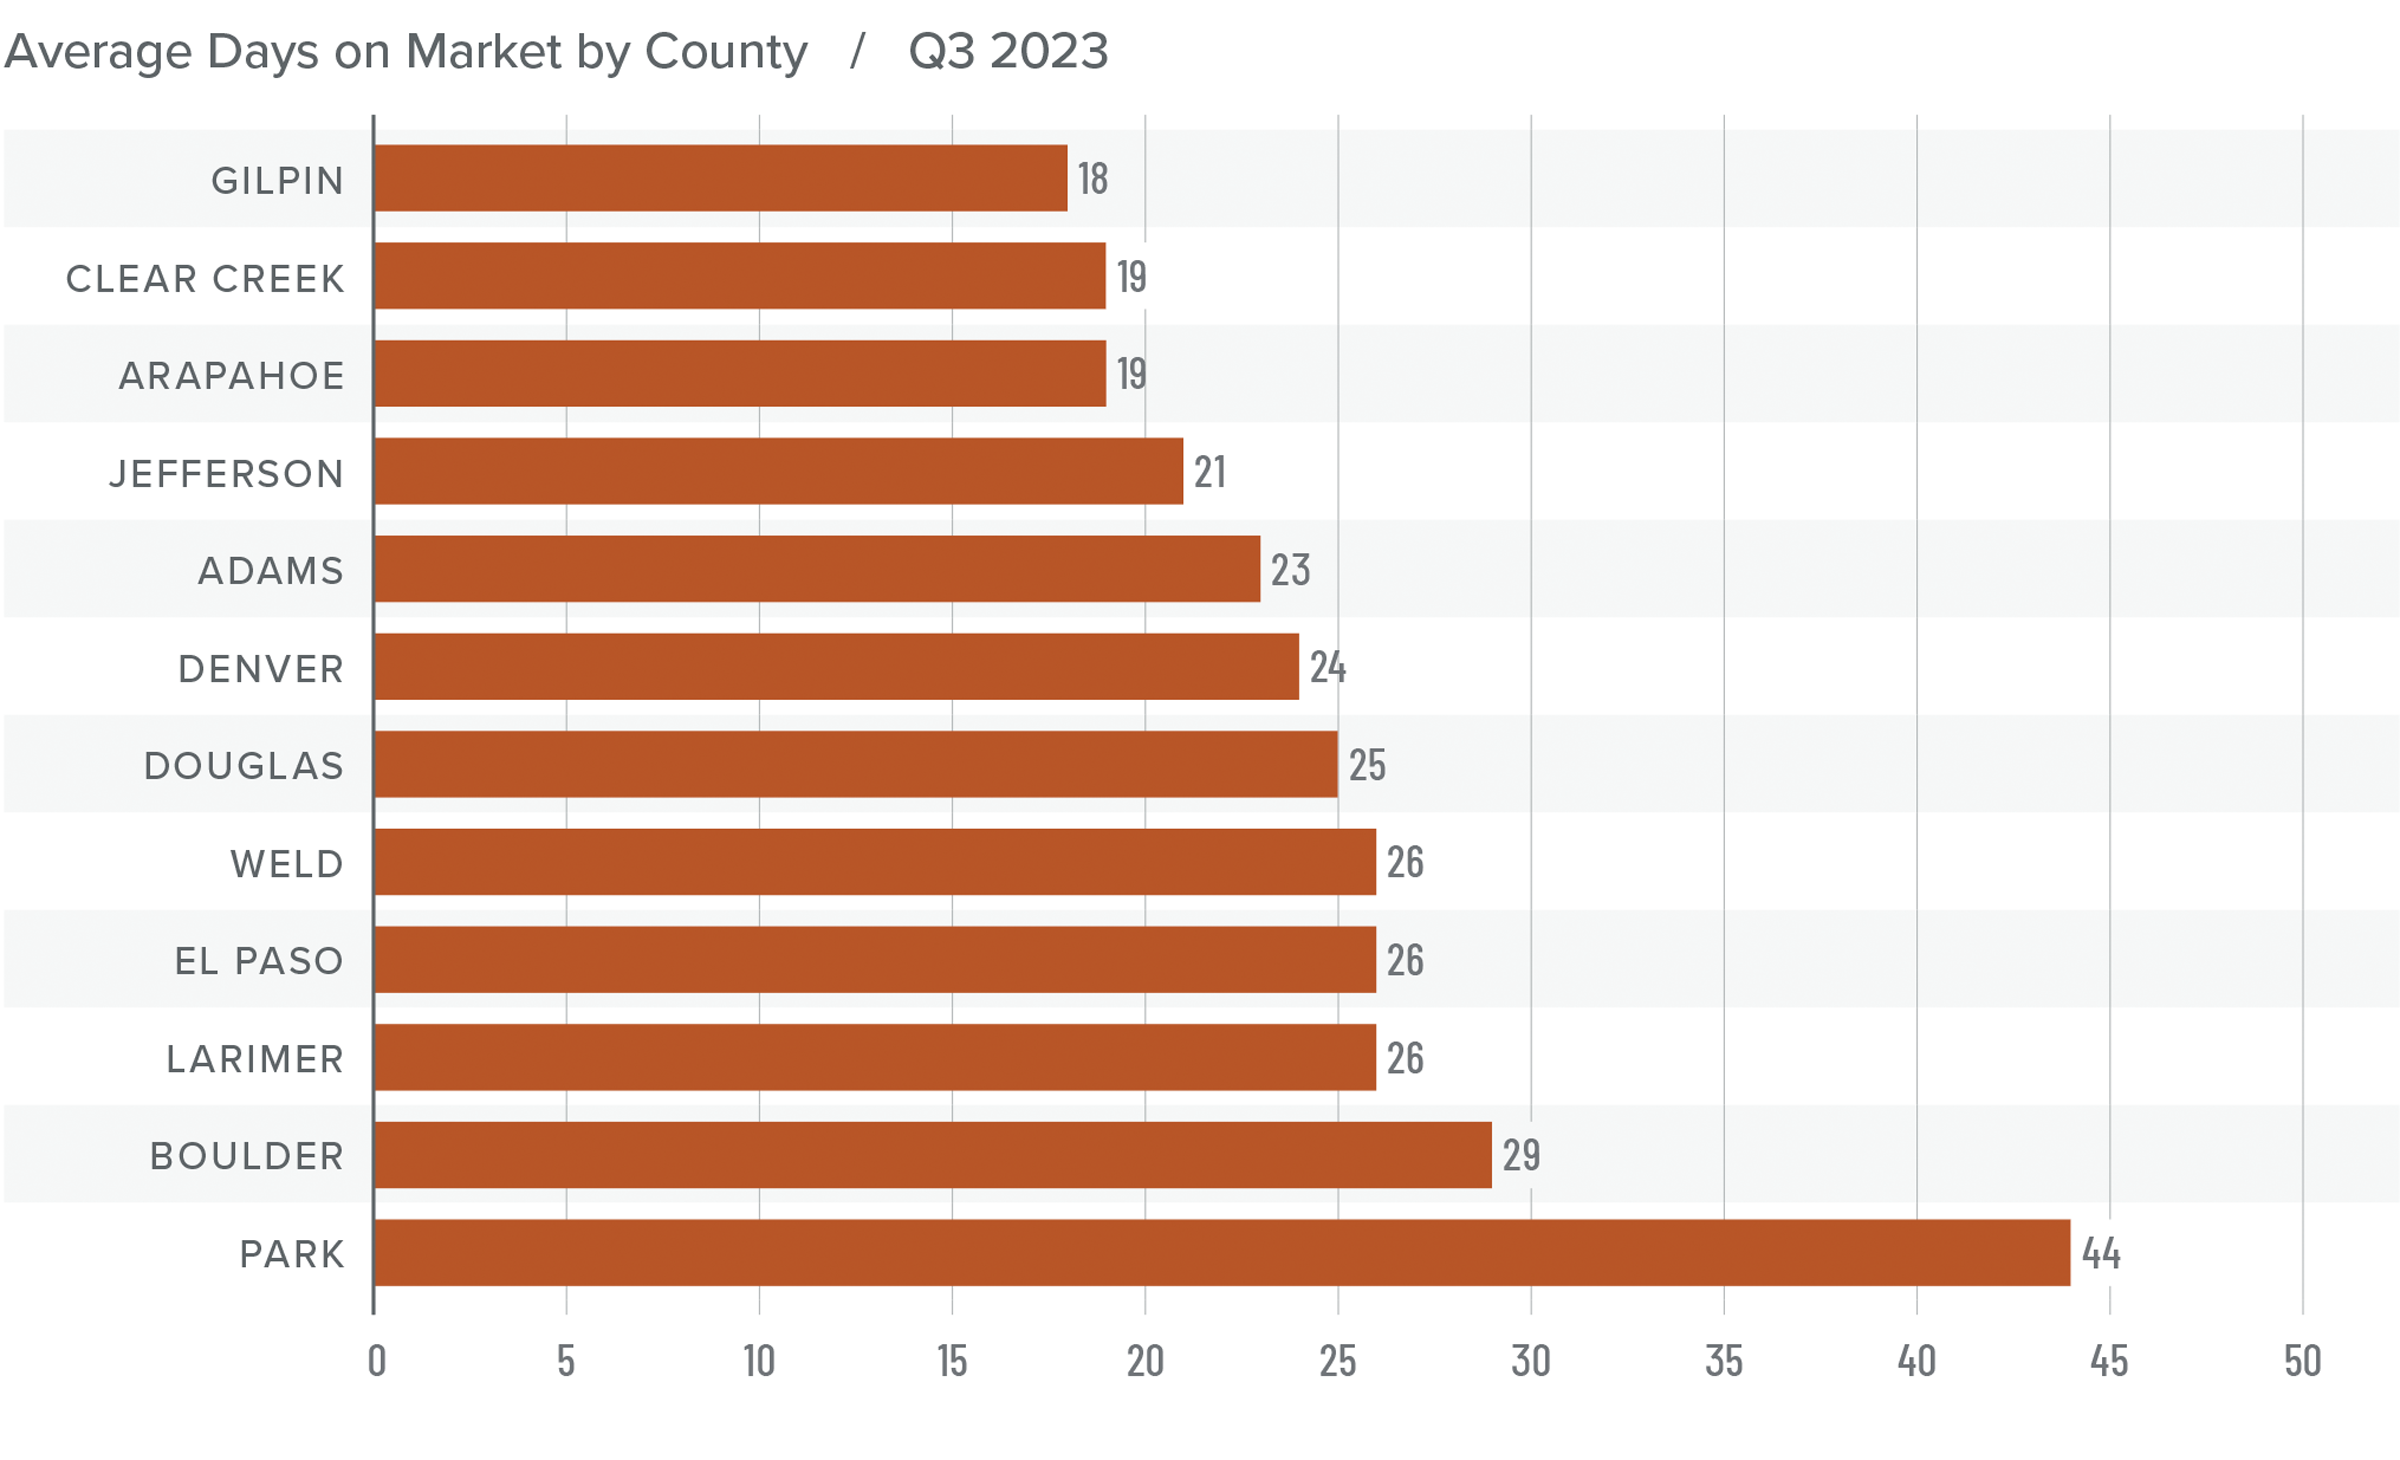
❱ The average time it took to sell a home in the markets contained in this report rose four days compared to the same period in 2022.
❱ The length of time it took to sell a home compared to the second quarter of this year fell in Boulder, Clear Creek, Gilpin, and Park counties, but rose across the rest of the market areas.
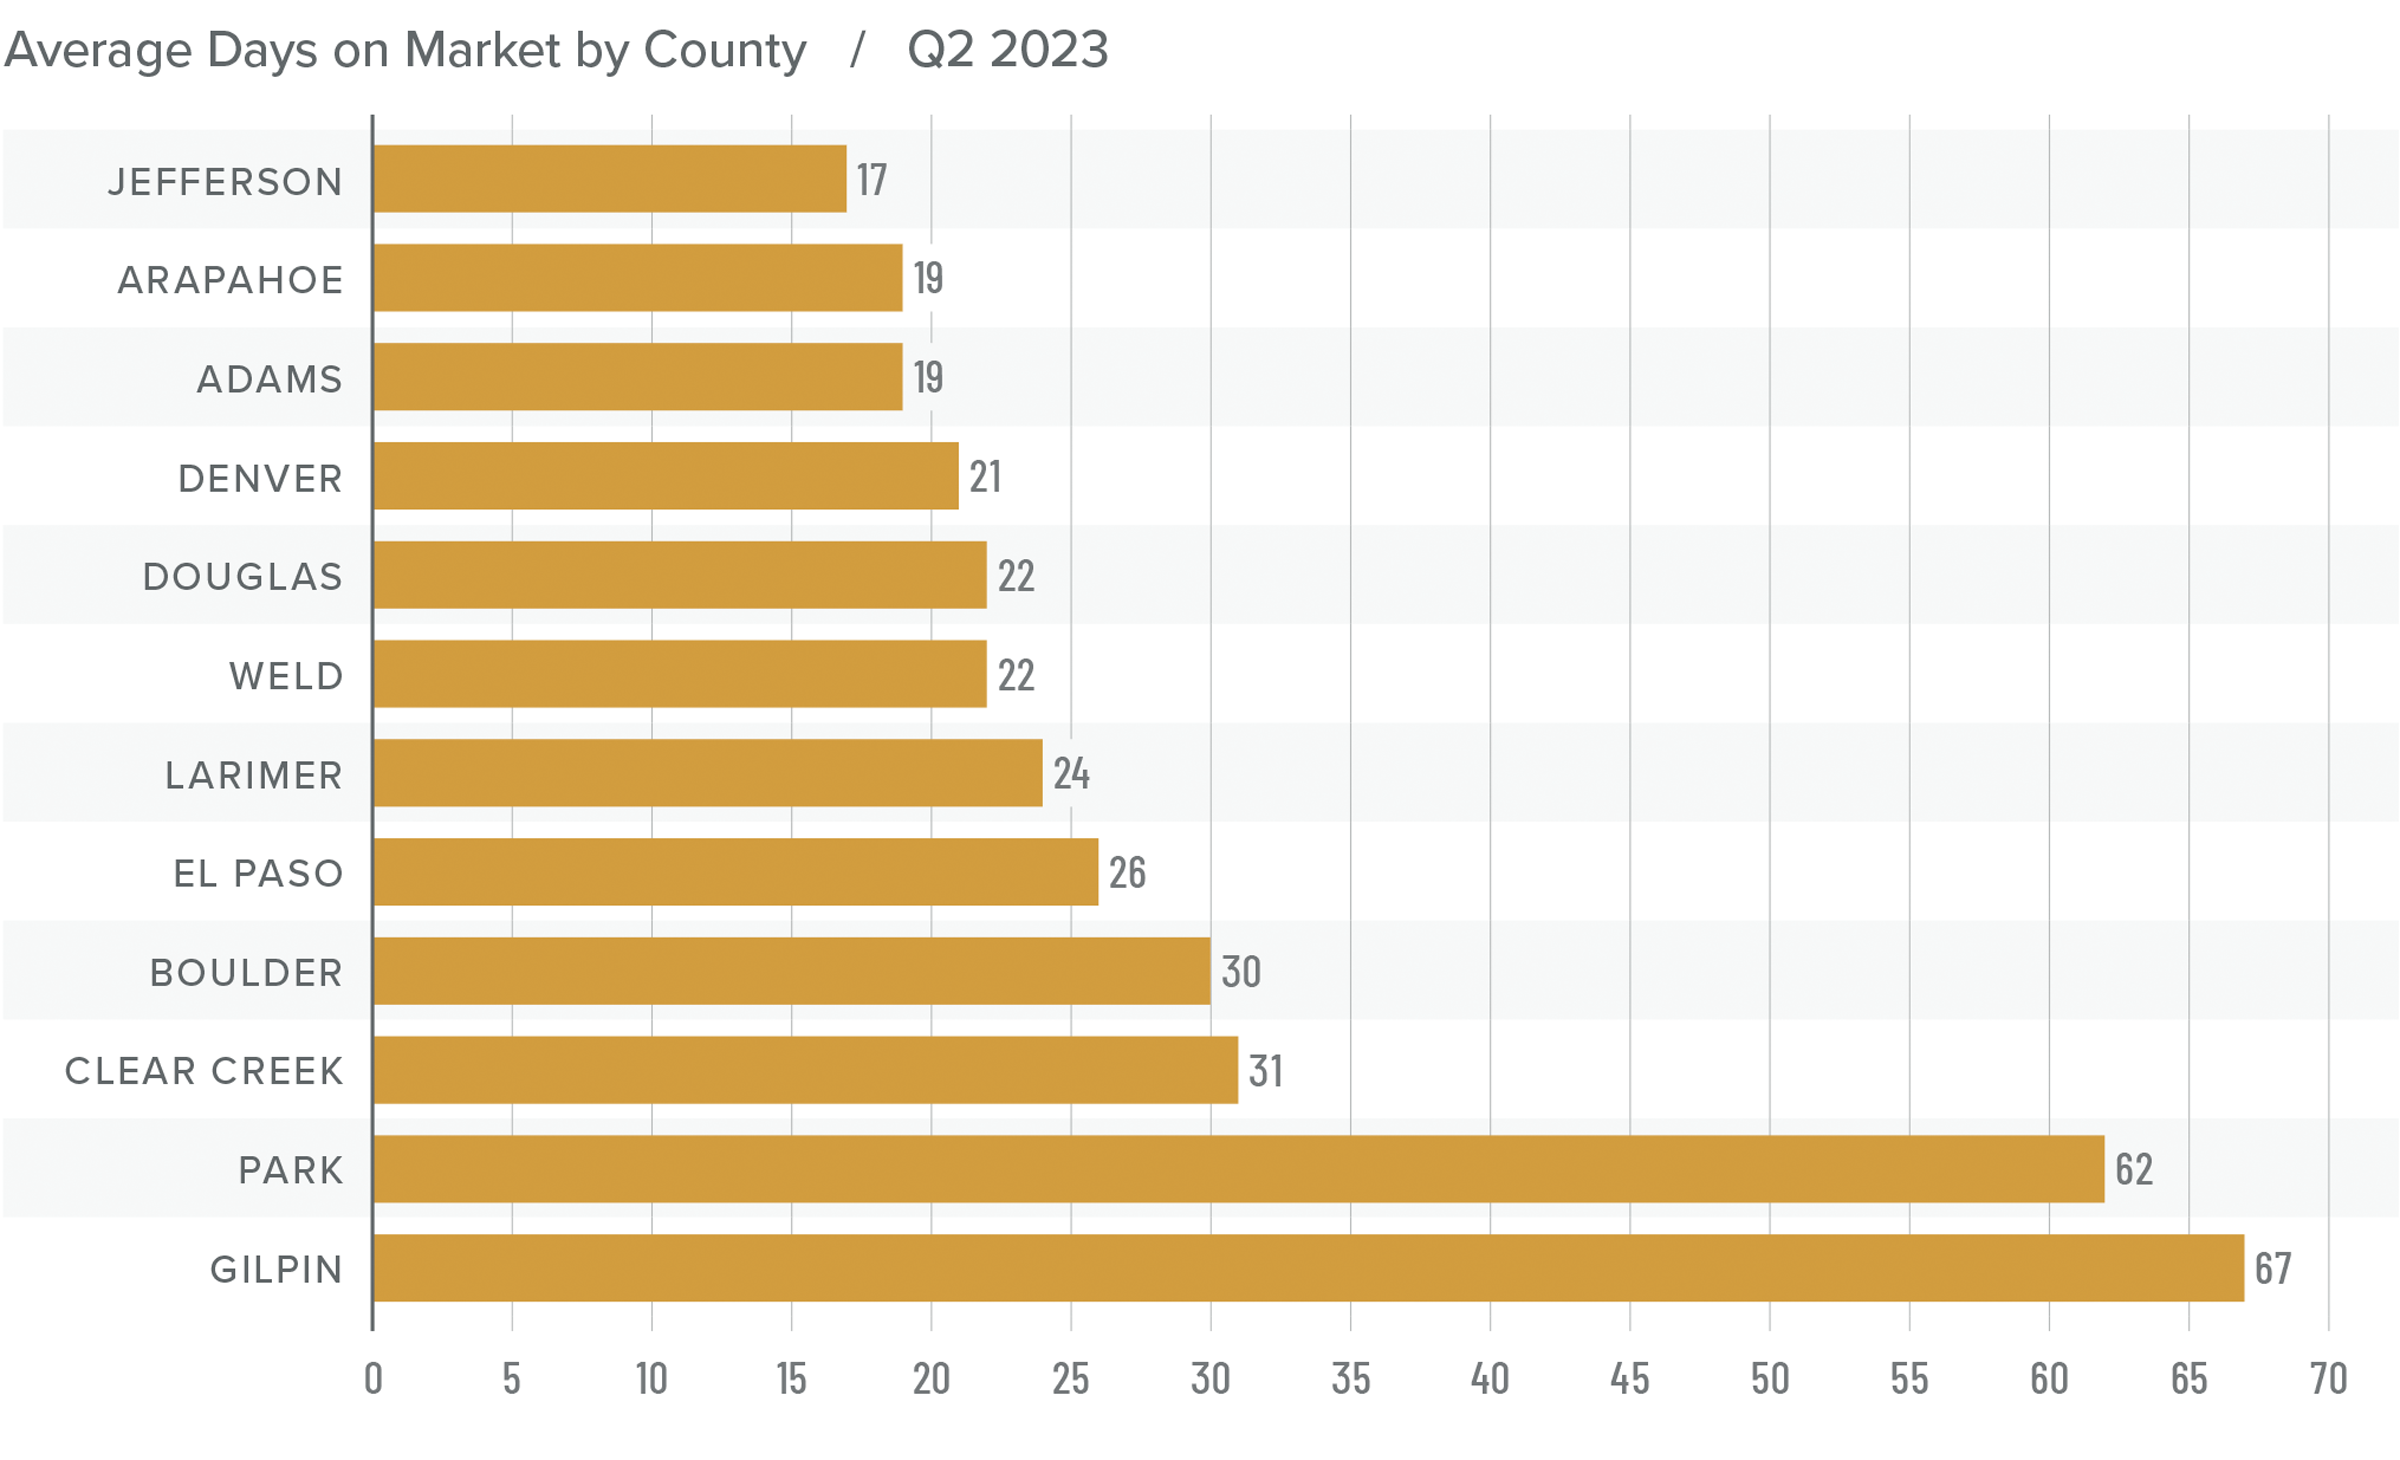
❱ It took an average of 25 days to sell a home in the region, which is five fewer days than in the second quarter of 2023.
❱ Despite having more choice in the market, buyers picked up the pace a little in the quarter. It remains to be seen whether this will continue given stubbornly high financing costs.
Conclusions
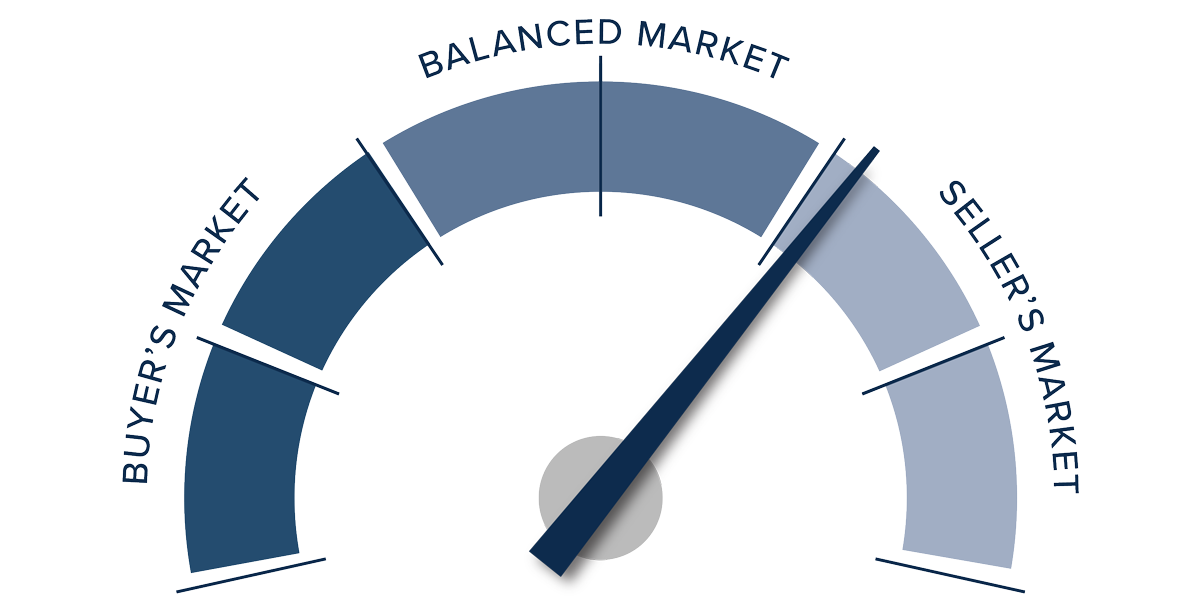
This speedometer reflects the state of the region’s real estate market using housing inventory, price gains, home sales, interest rates, and larger economic factors.
Job growth is still significantly slower than it has been over the past two years. A slowing economy and decades-high mortgage rates are a recipe for a sluggish housing market, but Colorado appears to be rather resilient.
That said, with rising inventories, slowing sales, and lower list prices, it can hardly be described as a traditional seller’s market. In last quarter’s market update it was said that sellers appeared to have the edge over buyers, but it’s now clear that the market is starting to respond to higher mortgage rates.

Although the market conditions described above favor home buyers, they’re not totally in the driver’s seat. As such, the needle moved into the balanced quadrant. As we move through the winter and into the spring of 2024, we hope that we will have more clarity on the direction of the housing market.
Q2 2023 Colorado Real Estate Market Update

The following analysis of select counties of the Colorado real estate market is provided by Windermere Real Estate Chief Economist Matthew Gardner. We hope that this information may assist you with making better-informed real estate decisions. For further information about the housing market in your area, please don’t hesitate to contact your Windermere Real Estate agent.
Regional Economic Overview
The slowdown in job gains in Colorado continued this spring. Although the state added 30,200 new jobs over the past year, this represents close to the lowest growth rate since 2011. Additionally, growth is now being driven by gains in government employment and not from increases in the private sector. Part of the reason that job growth has slowed so significantly is that the labor market remains extremely tight. Since the pandemic, the labor pool has only risen a bit under 37,000 over the past year, which is well below average. With a tight labor market, I’m not surprised that the unemployment rate in May was only 2.8%. Regionally, jobless rates ranged from a low of 2.5% in Fort Collins and Boulder to a high of 3.1% in the Grand Junction metropolitan area.
Colorado Home Sales
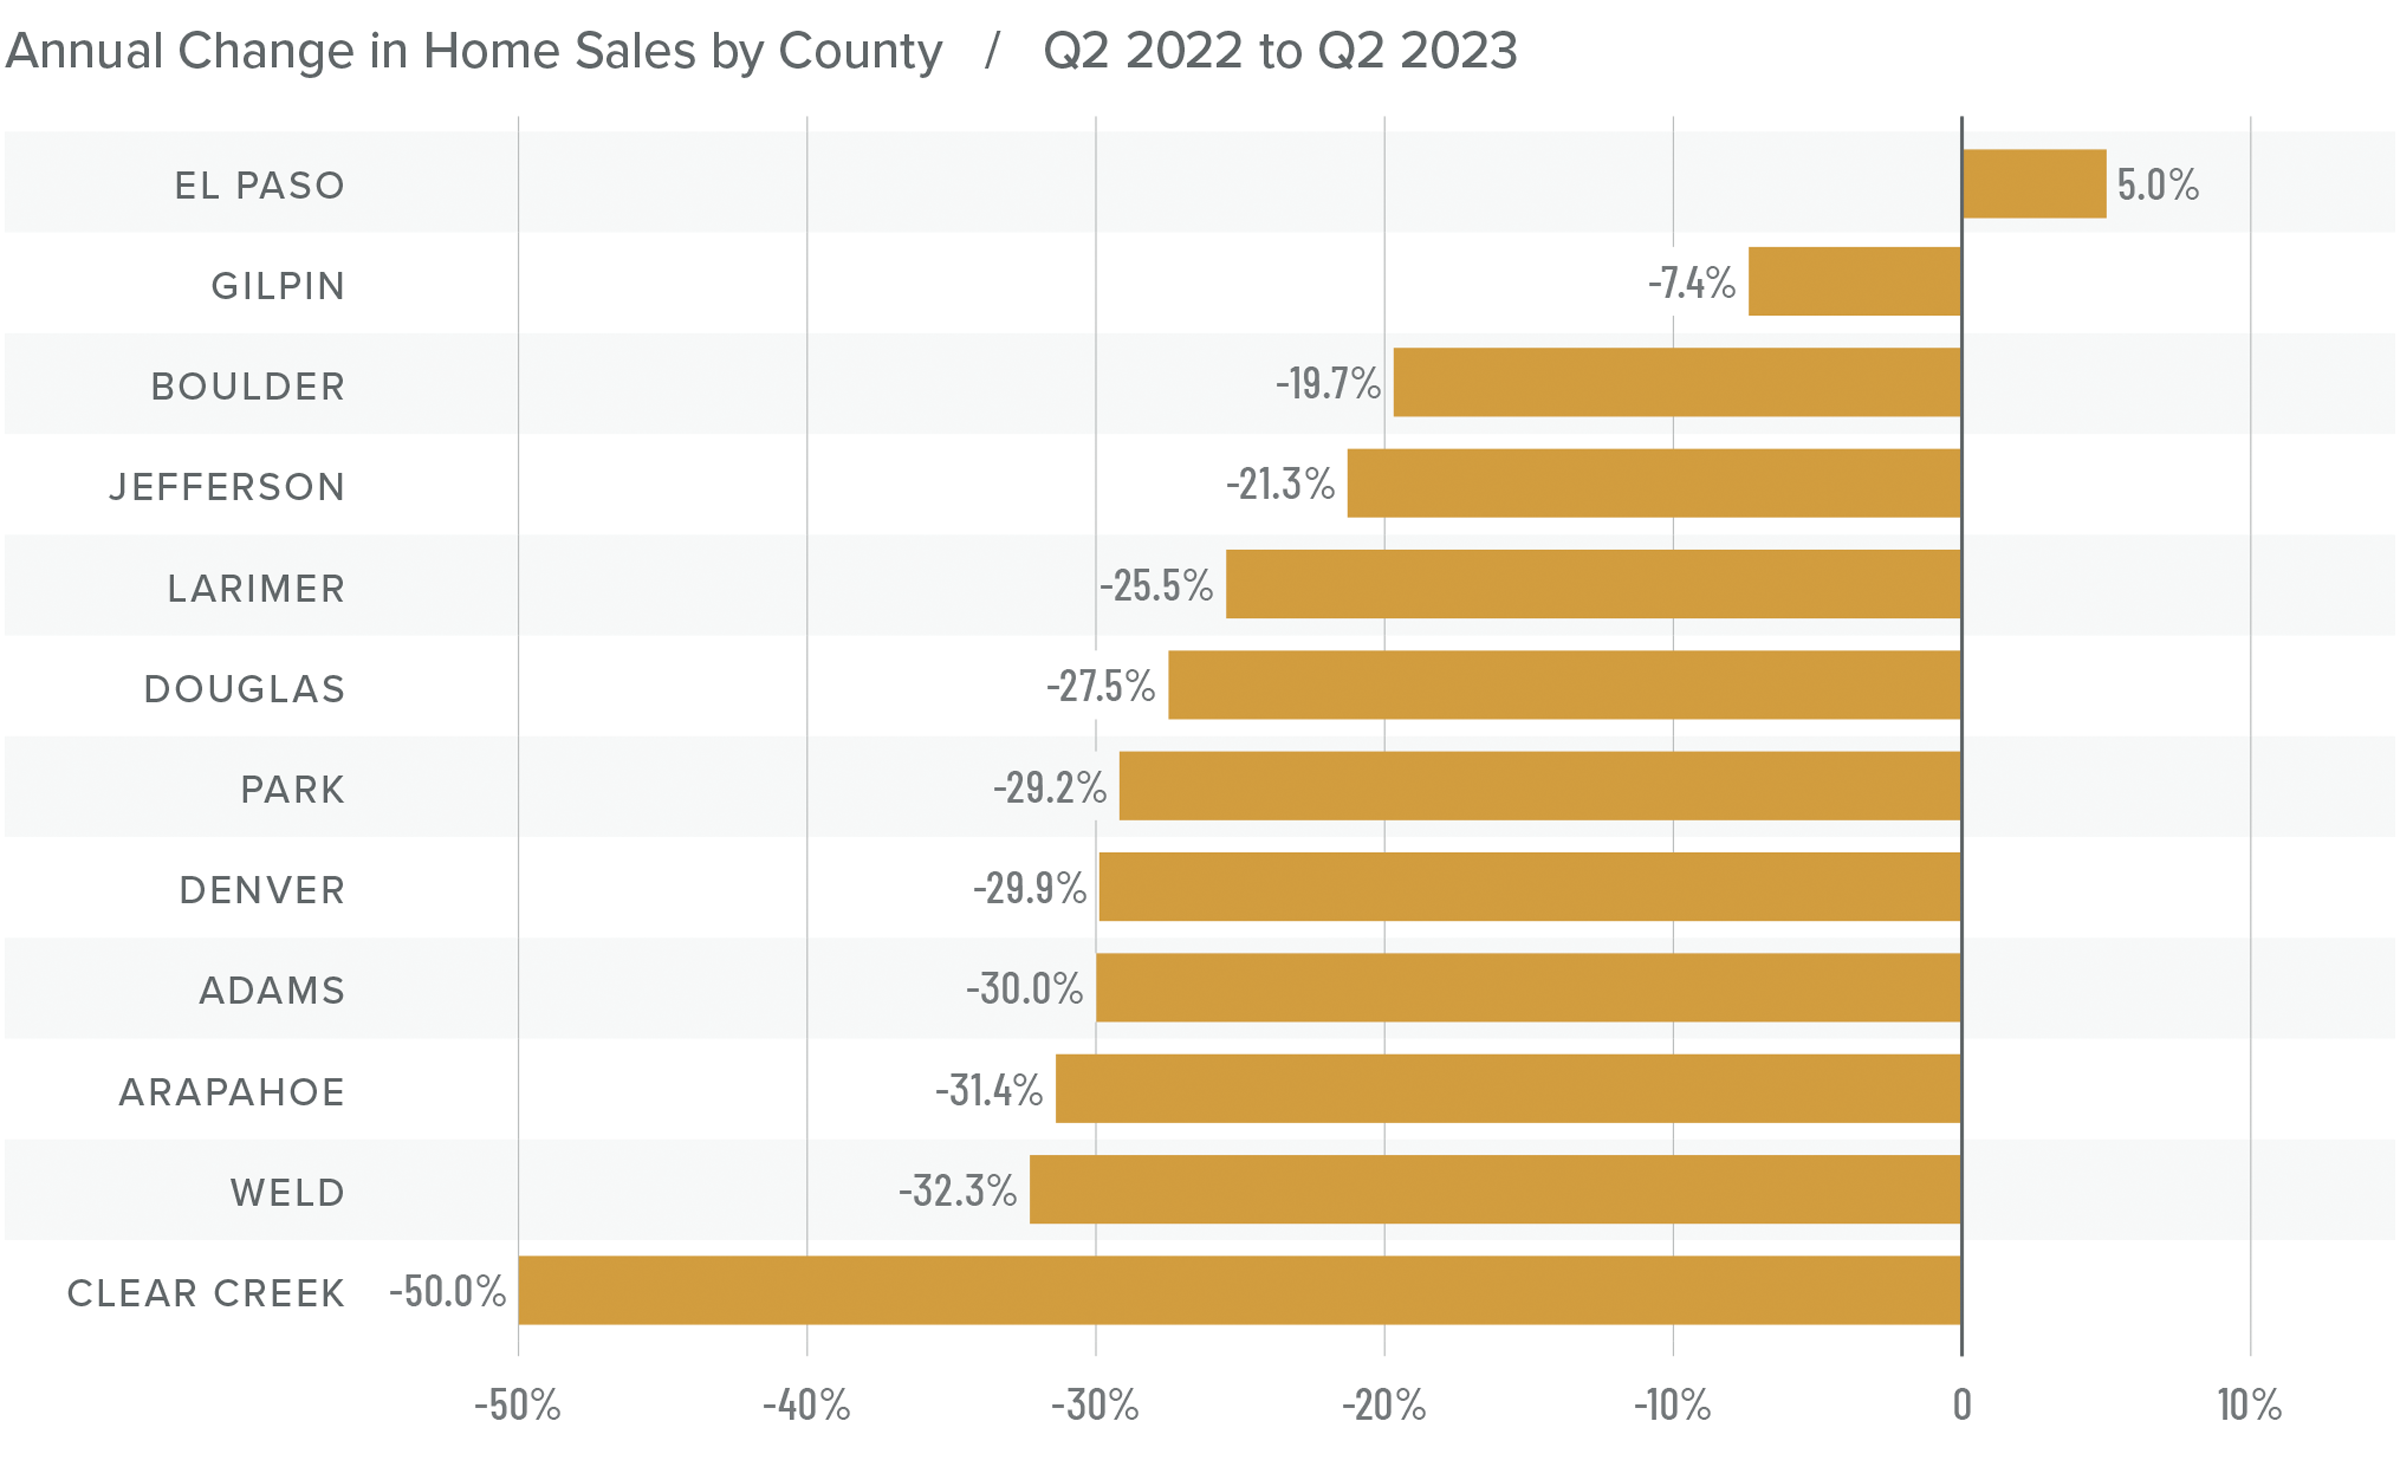
❱ In the second quarter of this year, 9,615 homes sold, which was a drop of 26% from the same period in 2022, but an increase of 45.6% from the first quarter of 2023.
❱ Year over year, sales fell in all the markets covered by this report except El Paso County. Compared to the first quarter of this year, sales rose across the board.
❱ The year-over-year drop in sales is not a surprise given that a year ago mortgage rates were starting to rise, so buyers were keen to lock in low rates while they could. I was pleased to see the significant jump in sales over the first quarter even with remarkably high financing costs.
❱ Pending sales, which are an indicator of future closings, jumped 25.8% from the first quarter. This suggests that sales will likely rise as we move through the summer.
Colorado Home Prices
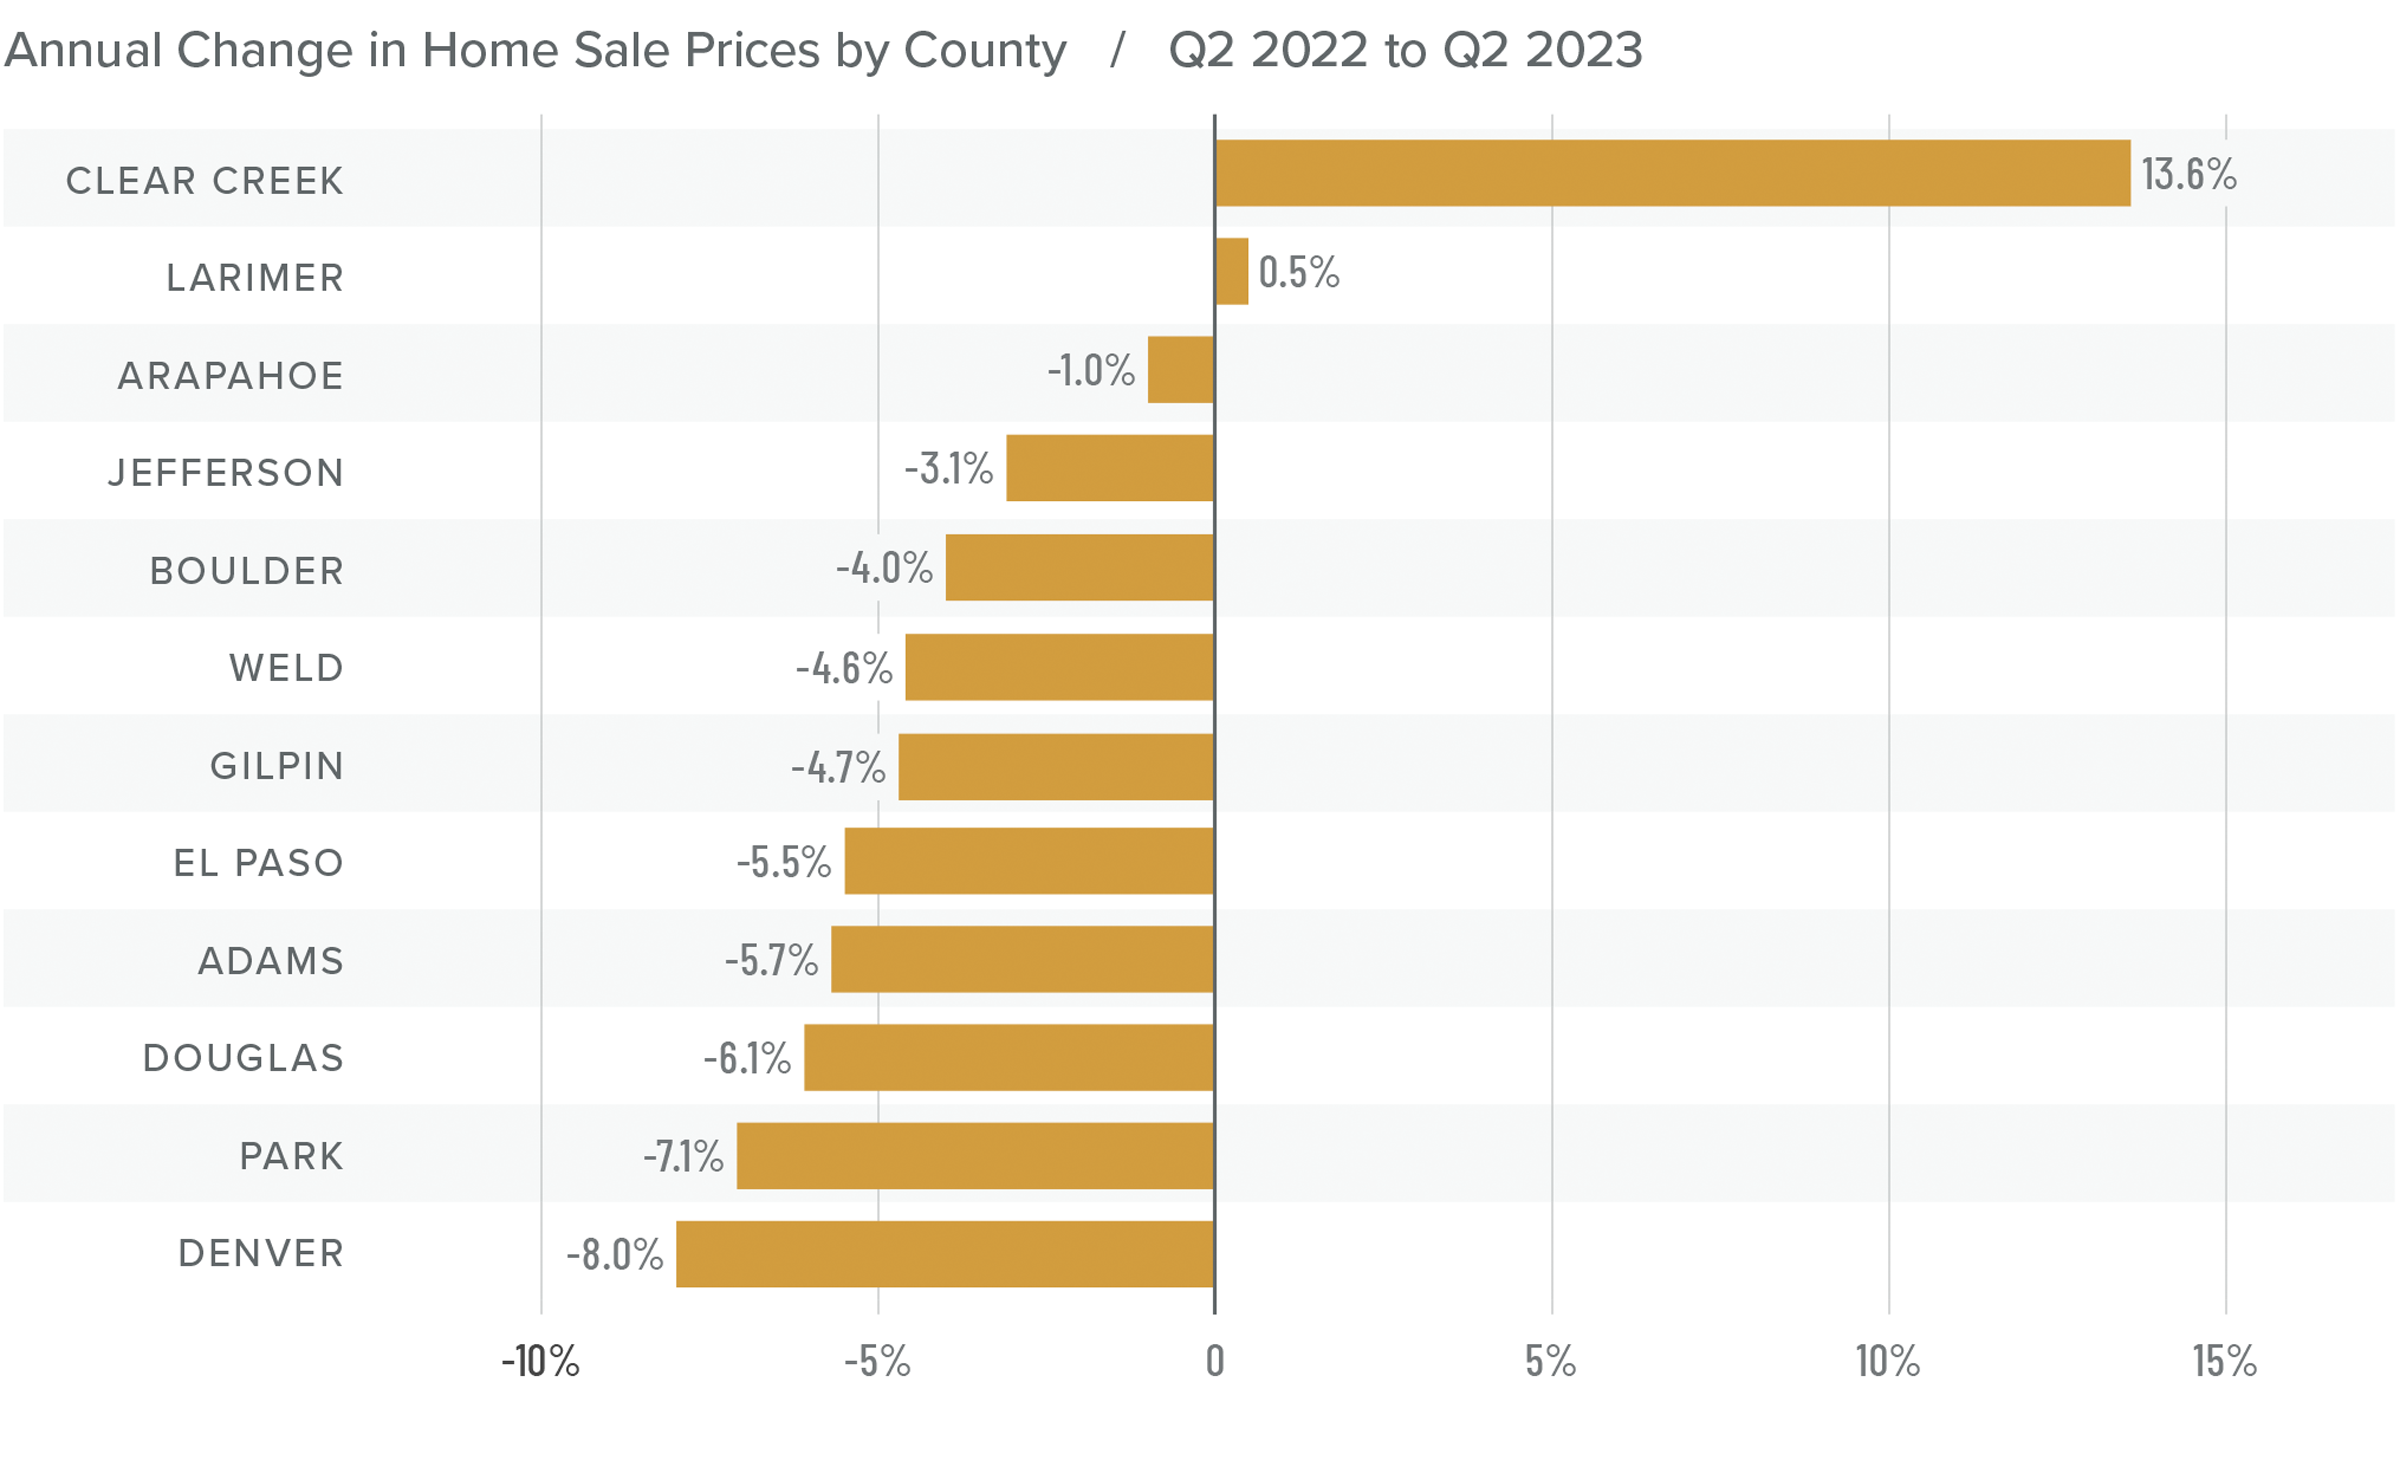
❱ Average sale prices fell 4% compared to the same period in 2022 to $672,864. Closed sale prices were 7.6% higher than in the first quarter of this year.
❱ Compared to the first quarter, prices rose in all counties other than Boulder and Gilpin. This may be because these are the two most expensive markets covered by this report.
❱ Year over year, prices rose in two counties but fell in the balance of the markets. Clear Creek County saw significant growth, but it is prone to significant swings because very few sales happen there.
❱ The median list price of a home for sale in the second quarter rose 1.9% from the first quarter of this year. In fact, every county except Clear Creek and Park saw list prices rise. Sellers appear to be confident about the market, regardless of mortgage rates.
Mortgage Rates
Although they were less erratic than the first quarter, mortgage rates unfortunately trended higher and ended the quarter above 7%. This was due to the short debt ceiling impasse, as well as several economic datasets that suggested the U.S. economy was not slowing at the speed required by the Federal Reserve.
While the June employment report showed fewer jobs created than earlier in the year, as well as downward revisions to prior gains, inflation has not sufficiently slowed. Until it does, rates cannot start to trend consistently lower. With the economy not slowing as fast as expected, I have adjusted my forecast: Rates will hold at current levels in third quarter and then start to trend lower through the fall. Although there are sure to be occasional spikes, my model now shows the 30-year fixed rate breaking below 6% next spring.
Colorado Days on Market
❱ The average time it took to sell a home in the markets contained in this report rose 20 days compared to the same period in 2022.
❱ The length of time it took to sell a home compared to the first quarter of this year fell across all markets except Gilpin County, where market time rose 31 days.
❱ It took an average of 30 days to sell a home in the counties covered by this report, which was down 17 days compared to the first quarter of 2023.
❱ Regardless of being faced with more choice in the market than they’ve had in a long time, buyers picked up the pace in the quarter. It will be interesting to see if this continues despite stubbornly high financing costs.
Conclusions
This speedometer reflects the state of the region’s real estate market using housing inventory, price gains, home sales, interest rates, and larger economic factors.
Although job growth has slowed significantly, and financing costs remain high, the market appears to have gained traction. Clearly, buyers do not expect prices to fall further. Even if borrowing costs remain high, it appears that buyers believe rates will come down at some point, which will allow them to refinance into a lower rate mortgage.
In last quarter’s Gardner Report, I stated that home prices had likely turned the corner and were going to start rising again, which has proved to be accurate. Listing activity has risen, but so have sales. List and sale prices are trending higher even as market time drops. All in all, the data points to a seller’s market. As such, I have moved the needle accordingly.
About Matthew Gardner

As Chief Economist for Windermere Real Estate, Matthew Gardner is responsible for analyzing and interpreting economic data and its impact on the real estate market on both a local and national level. Matthew has over 30 years of professional experience both in the U.S. and U.K.
In addition to his day-to-day responsibilities, Matthew sits on the Washington State Governors Council of Economic Advisors; chairs the Board of Trustees at the Washington Center for Real Estate Research at the University of Washington; and is an Advisory Board Member at the Runstad Center for Real Estate Studies at the University of Washington where he also lectures in real estate economics.
Q1 2023 Colorado Real Estate Market Update

The following analysis of select counties of the Colorado real estate market is provided by Windermere Real Estate Chief Economist Matthew Gardner. We hope that this information may assist you with making better-informed real estate decisions. For further information about the housing market in your area, please don’t hesitate to contact your Windermere Real Estate agent.
Regional Economic Overview
The pace of employment growth in Colorado continues to slow. Though this is not totally unexpected, I will be keeping an eye on it as annual job growth has now fallen below the long-term trend. Over the past year, the region added 46,700 jobs, which is the slowest annual pace since 2012. Part of the reason job growth has slowed so significantly is that the labor market remains extremely tight; the unemployment rate in February was only 2.9%. Regionally, jobless rates ranged from a low of 2.7% in Fort Collins and Boulder to a high of 3.4% in the Grand Junction metropolitan area.
Colorado Home Sales
❱ In the first quarter of 2023, 6,545 homes sold, representing a fall of 23.9% from the same period in 2022. Sales were down 8.4% from the final quarter of 2022.
❱ Year over year, sales fell across all the markets covered by this report except El Paso. Compared to the fourth quarter of 2022, sales fell in all markets except Douglas County, where they rose 2.7%.
❱ The year-over-year decline in sales is not surprising given that mortgage rates started to rise in early 2022, causing a flood of buyers to lock in historically low rates while they could. The quarter-over-quarter sales decline was likely due to the 38.9% drop in active listings, as well as seasonal factors. The market remains tight.
❱ Pending sales, which are an indicator of future closings, jumped 31.8% from the fourth quarter of 2022, suggesting that sales may improve in the second quarter.
Colorado Home Prices
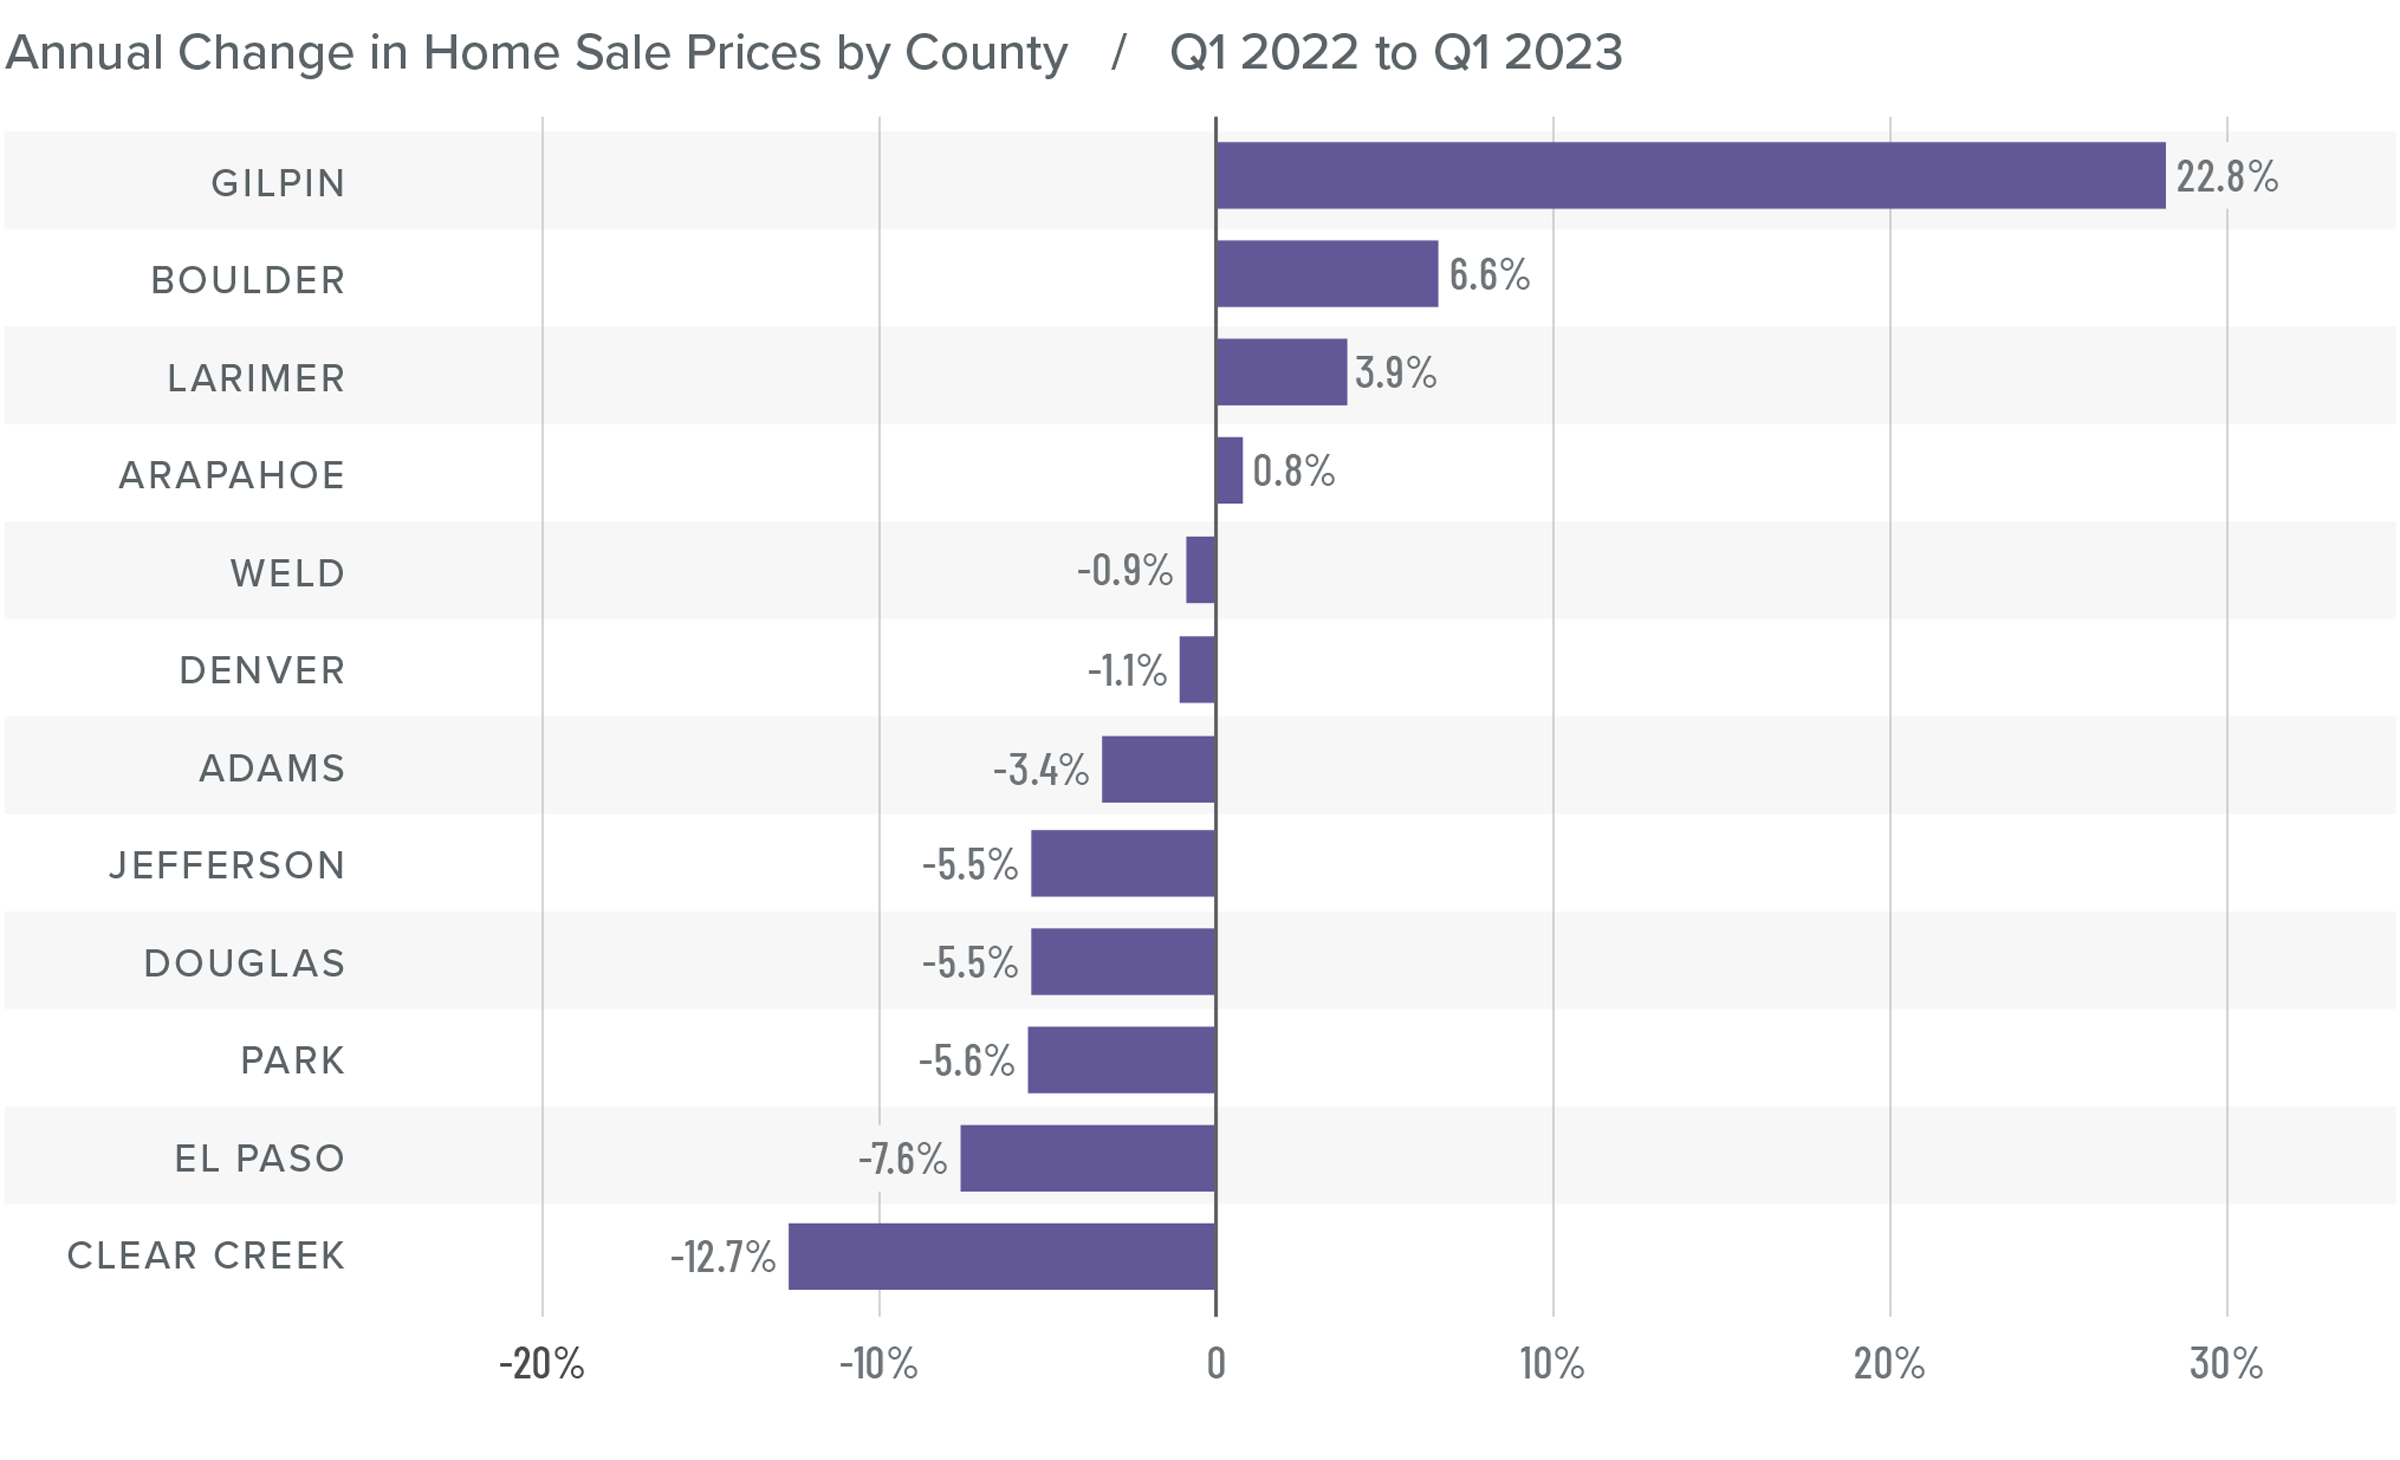
❱ The average home price fell 1.8% from the same period in 2022 to $625,213. Prices were .4% lower than in the fourth quarter of 2022.
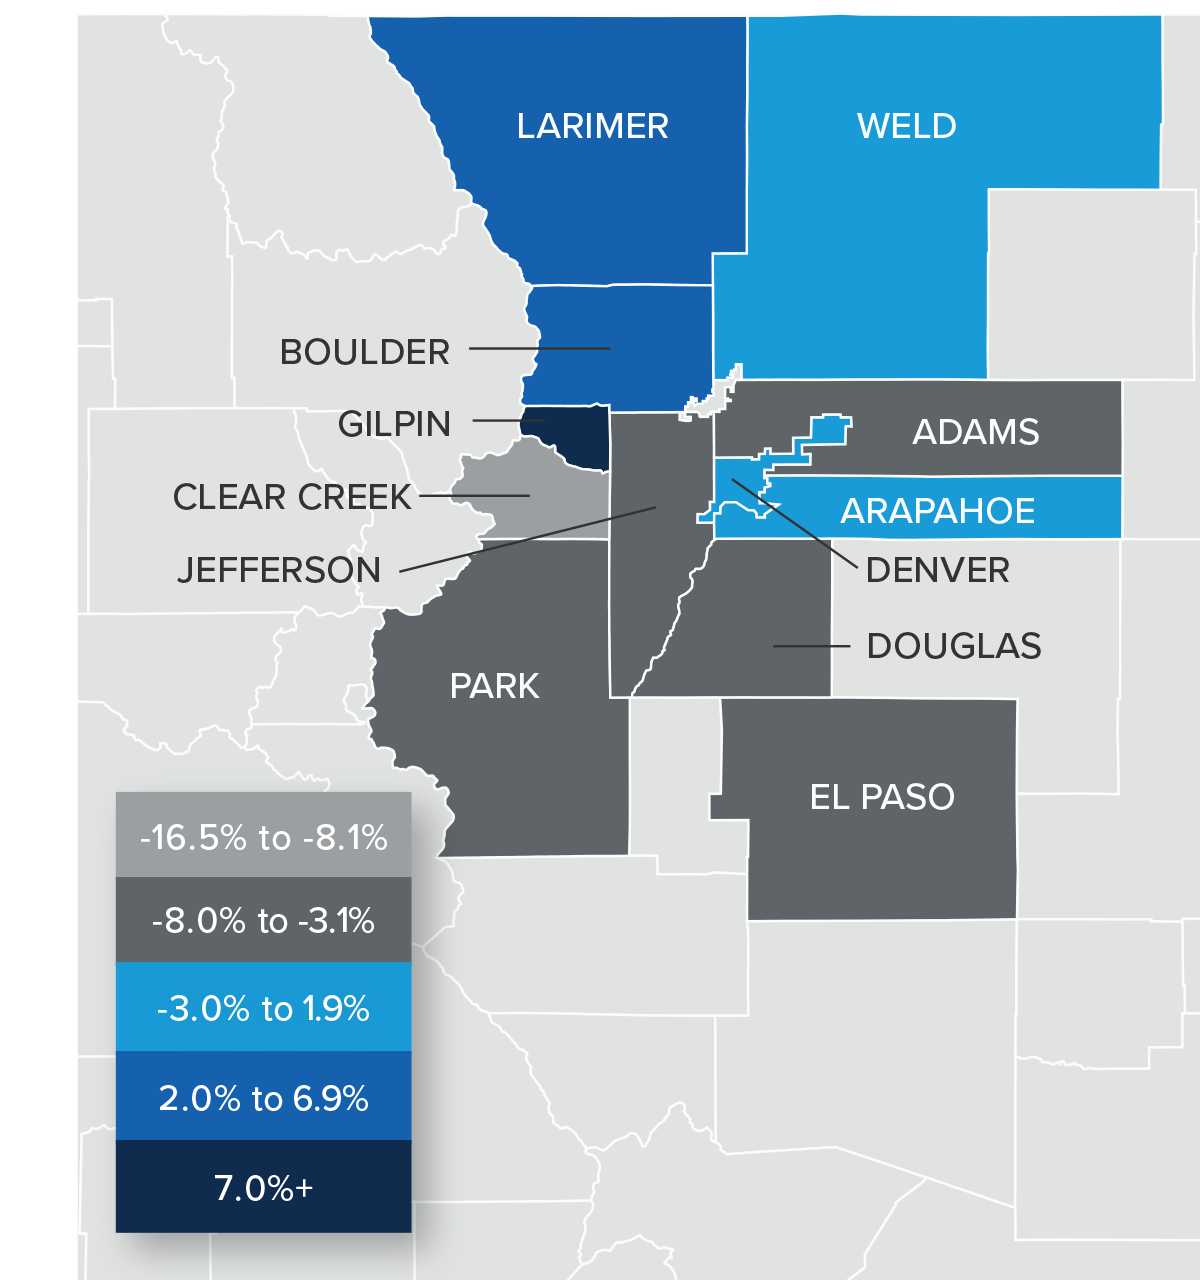
❱ Compared to the final quarter of 2022, prices rose in Jefferson, Arapahoe, Boulder, Larimer, Gilpin, and Park counties, but fell in the other market areas.
❱ Year over year, prices rose in four counties, but fell in the rest of the markets. Home prices in Gilpin County rose dramatically, but the small size of this market makes it prone to significant swings.
❱ Median listing prices rose 3% compared to the fourth quarter of 2022, suggesting that sellers are not overly concerned by higher financing costs. The fact that both listing prices and sale prices are not falling tells me that the price correction that followed the jump in mortgage rates is likely coming to an end.
Mortgage Rates
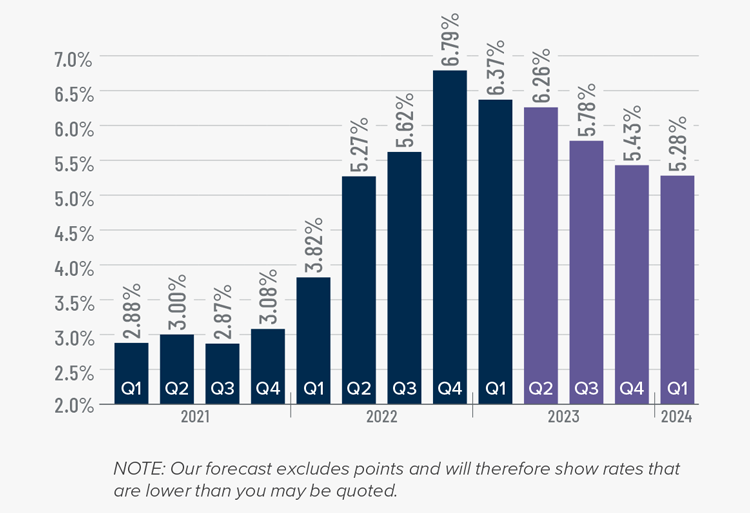
Rates in the first quarter of 2023 were far less volatile than last year, even with the brief but significant impact of early March’s banking crisis. It appears that buyers are jumping in when rates dip, which was the case in mid-January and again in early February.
Even with the March Consumer Price Index report showing inflation slowing, I still expect the Federal Reserve to raise short-term rates one more time following their May meeting before pausing rate increases. This should be the catalyst that allows mortgage rates to start trending lower at a more consistent pace than we have seen so far this year. My current forecast is that rates will continue to move lower with occasional spikes, and that they will hold below 6% in the second half of this year.
Colorado Days on Market
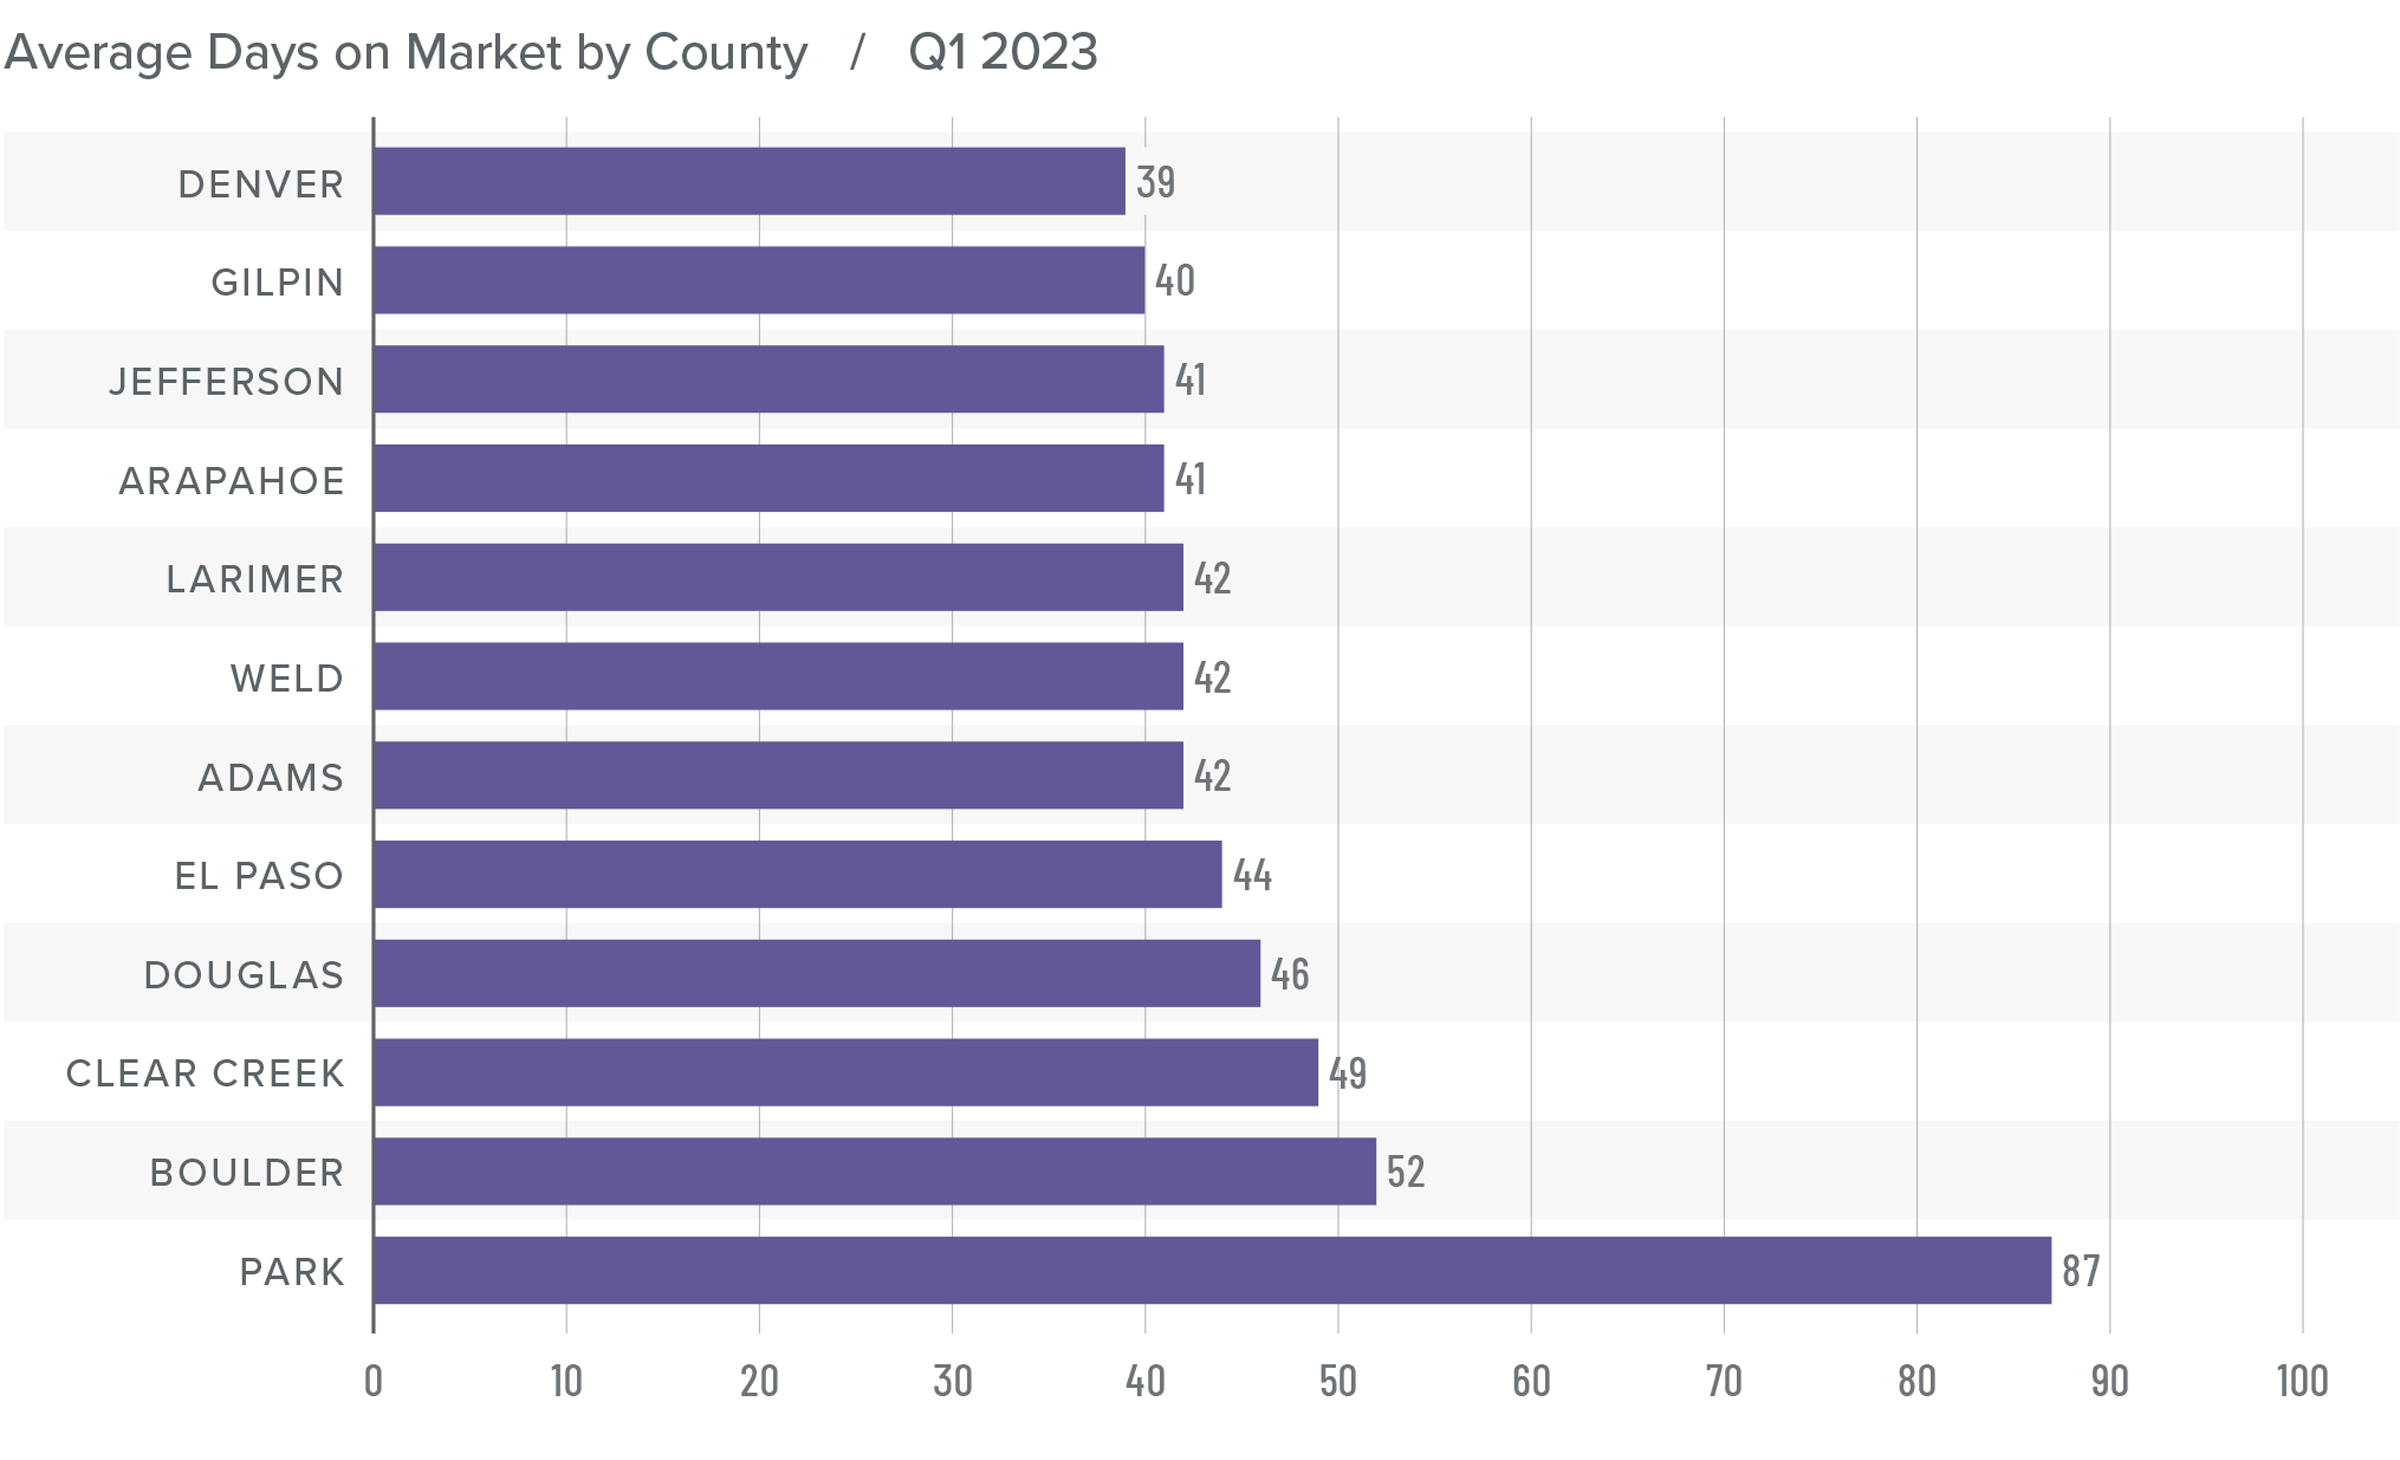
❱ The average time it took to sell a home in the markets contained in this report rose 27 days compared to the same period in 2022.
❱ The length of time it took to sell a home rose across all markets compared to the fourth quarter of 2022 with the exception of Clear Creek County, where market time fell 13 days.
❱ It took an average of 47 days to sell a home in the region, which is an increase of 9 days compared to the fourth quarter of 2022.
❱ Even with limited choice in the market, buyers are being selective and taking their time. It will be interesting to see if the pace of sales picks up as we move further into the spring buying season.
Conclusions
This speedometer reflects the state of the region’s real estate market using housing inventory, price gains, home sales, interest rates, and larger economic factors.
Slowing job growth, the potential for a mild recession this year, and higher financing costs are all impediments to the housing market. However, the market appears to be taking things in stride. Regular readers will be aware that I have been forecasting home prices to soften given all the above factors, which has proved to be accurate. There are signs we may be turning the corner, but we will need to see data from the spring market to confirm if this is the case.
As it stands today, inventory levels, listing prices, pending sales, modestly lower interest rates, and the absorption rate all favor home sellers. However, the number of closed sales, prices, and market time are favoring home buyers. Considering all the data, I do not see the market firmly in favor of either buyers or sellers. However, I see a slight bias in favor of home buyers, so I’ve tipped the needle very slightly in their direction.
About Matthew Gardner
As Chief Economist for Windermere Real Estate, Matthew Gardner is responsible for analyzing and interpreting economic data and its impact on the real estate market on both a local and national level. Matthew has over 30 years of professional experience both in the U.S. and U.K.
In addition to his day-to-day responsibilities, Matthew sits on the Washington State Governors Council of Economic Advisors; chairs the Board of Trustees at the Washington Center for Real Estate Research at the University of Washington; and is an Advisory Board Member at the Runstad Center for Real Estate Studies at the University of Washington where he also lectures in real estate economics.
Q4 2022 Colorado Real Estate Market Update

The following analysis of select counties of the Colorado real estate market is provided by Windermere Real Estate Chief Economist Matthew Gardner. We hope that this information may assist you with making better-informed real estate decisions. For further information about the housing market in your area, please don’t hesitate to contact your Windermere Real Estate agent.
Regional Economic Overview
Although employment in the region is still expanding, the pace of growth continues to slow. Over the past year, 103,400 jobs were added, which is the slowest annual pace since the 12-month period ending in July 2022. The unemployment rate in November stood at a very respectable 3.5%. Regionally, unemployment rates ranged from a low of 2.8% in Boulder to a high of 4% in the Grand Junction metropolitan area.
Colorado Home Sales
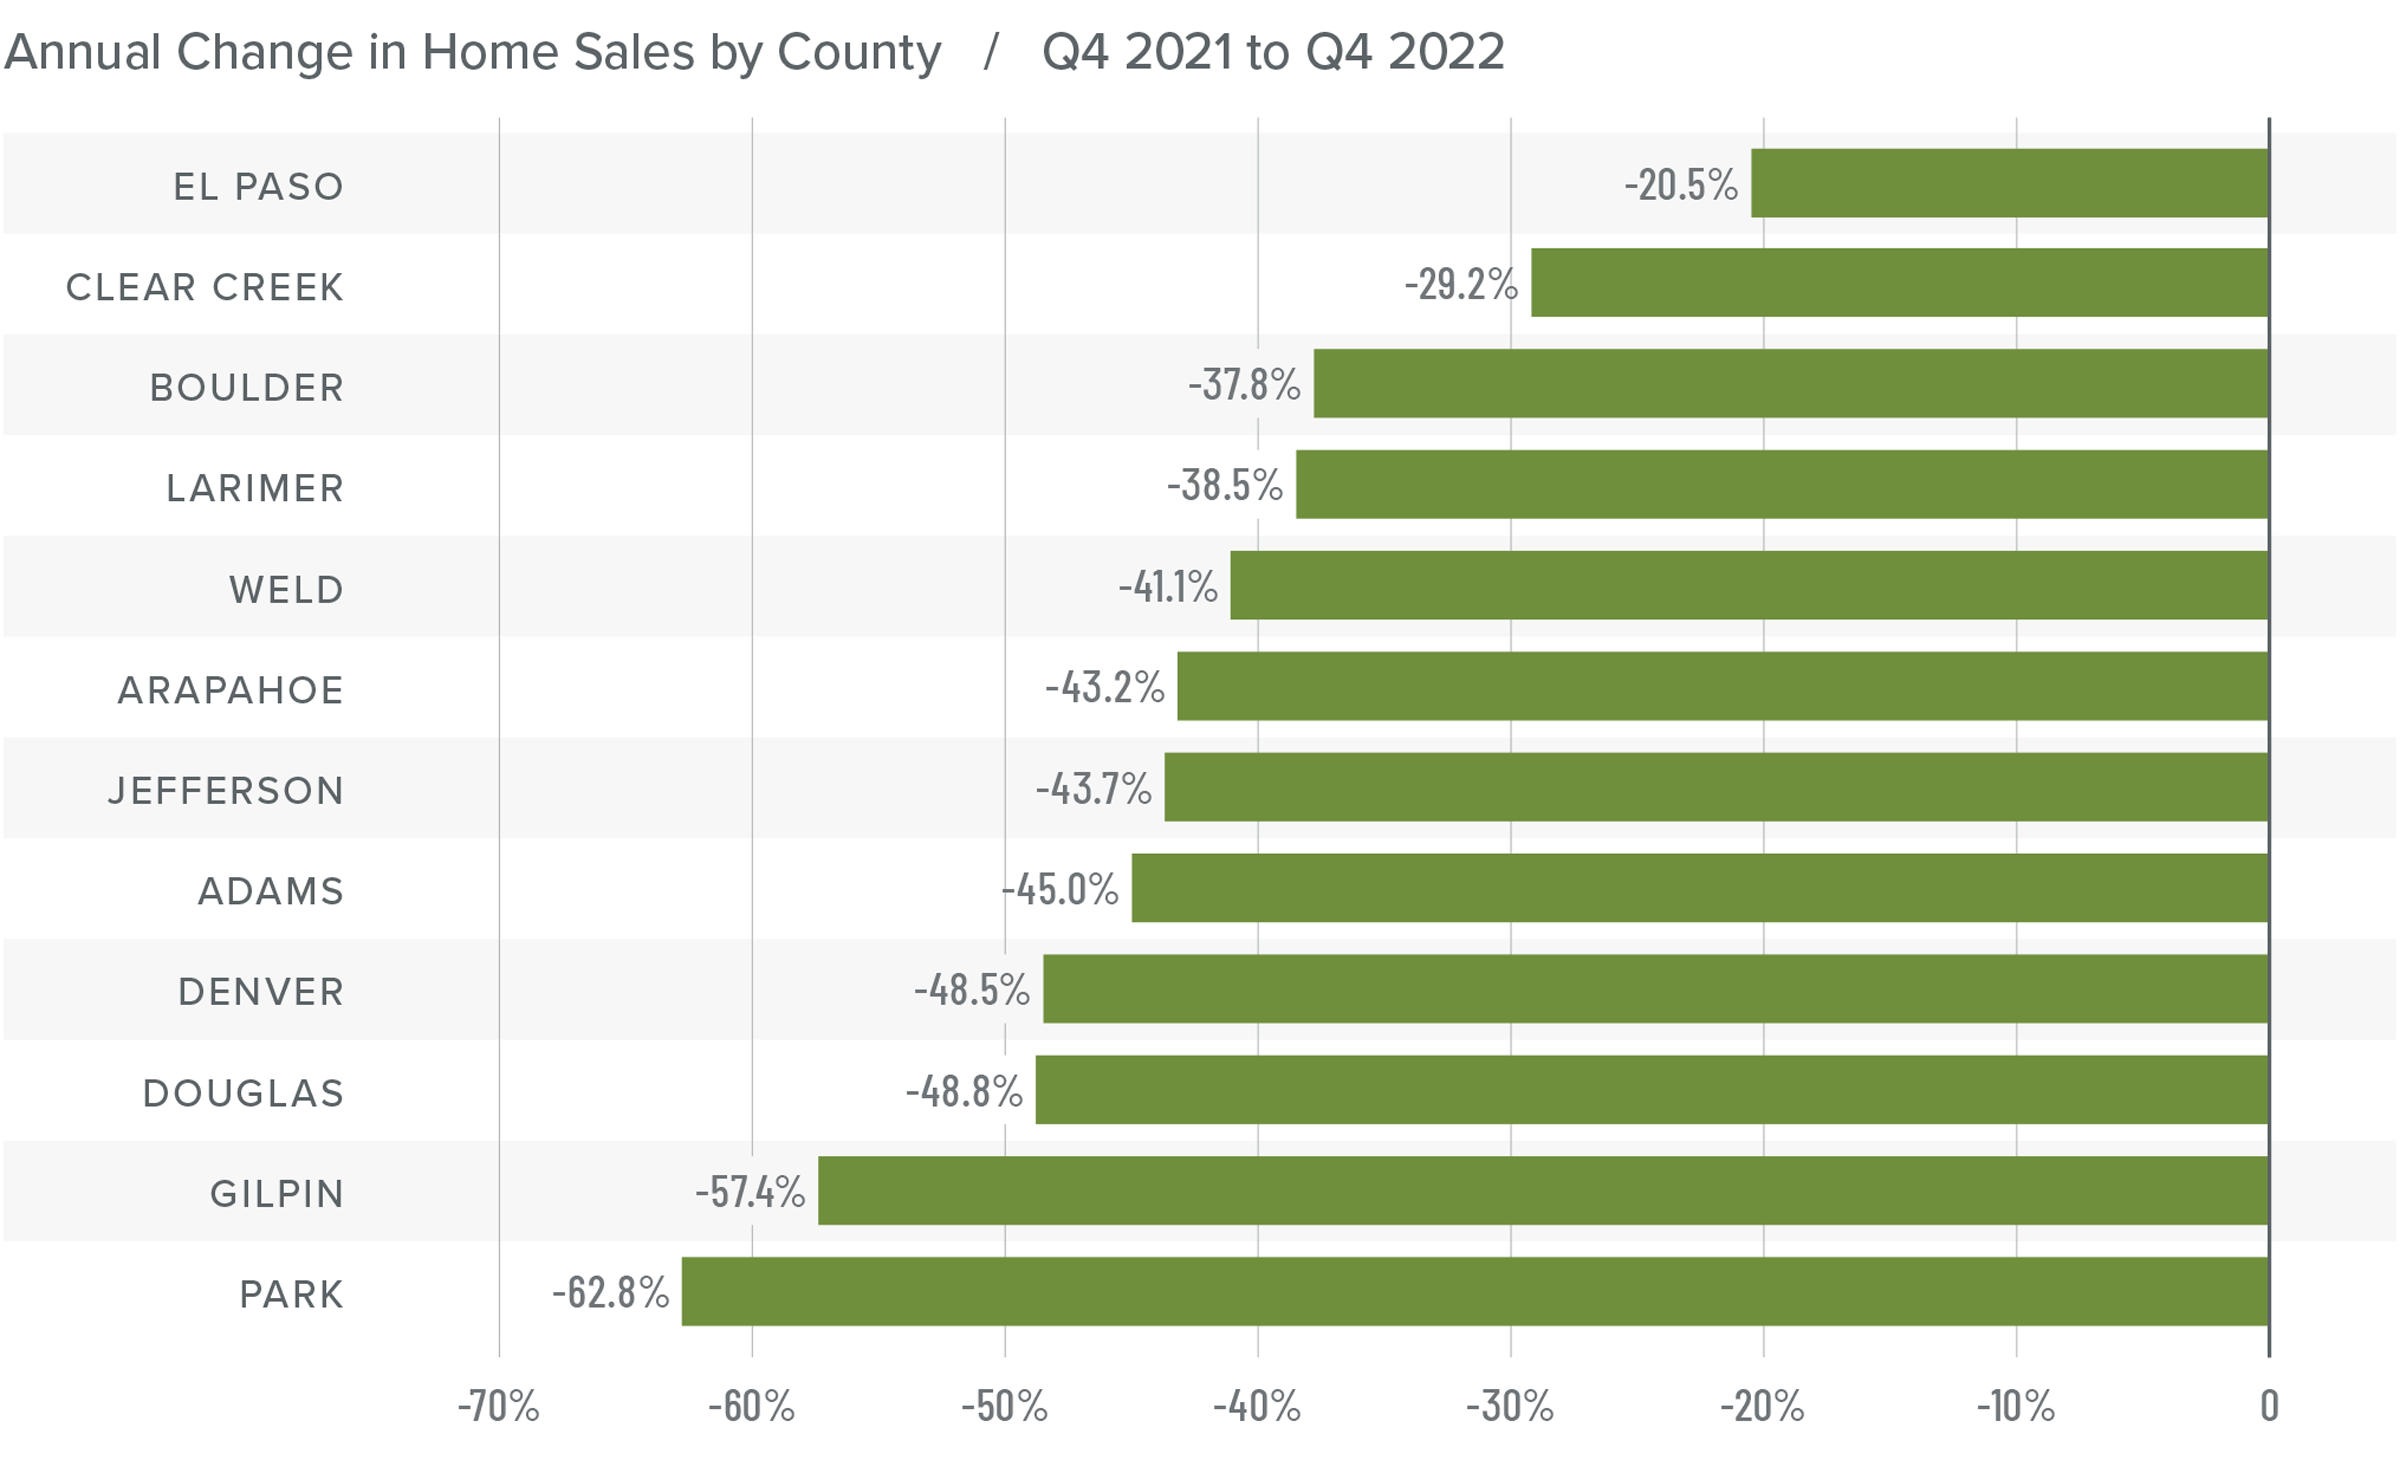
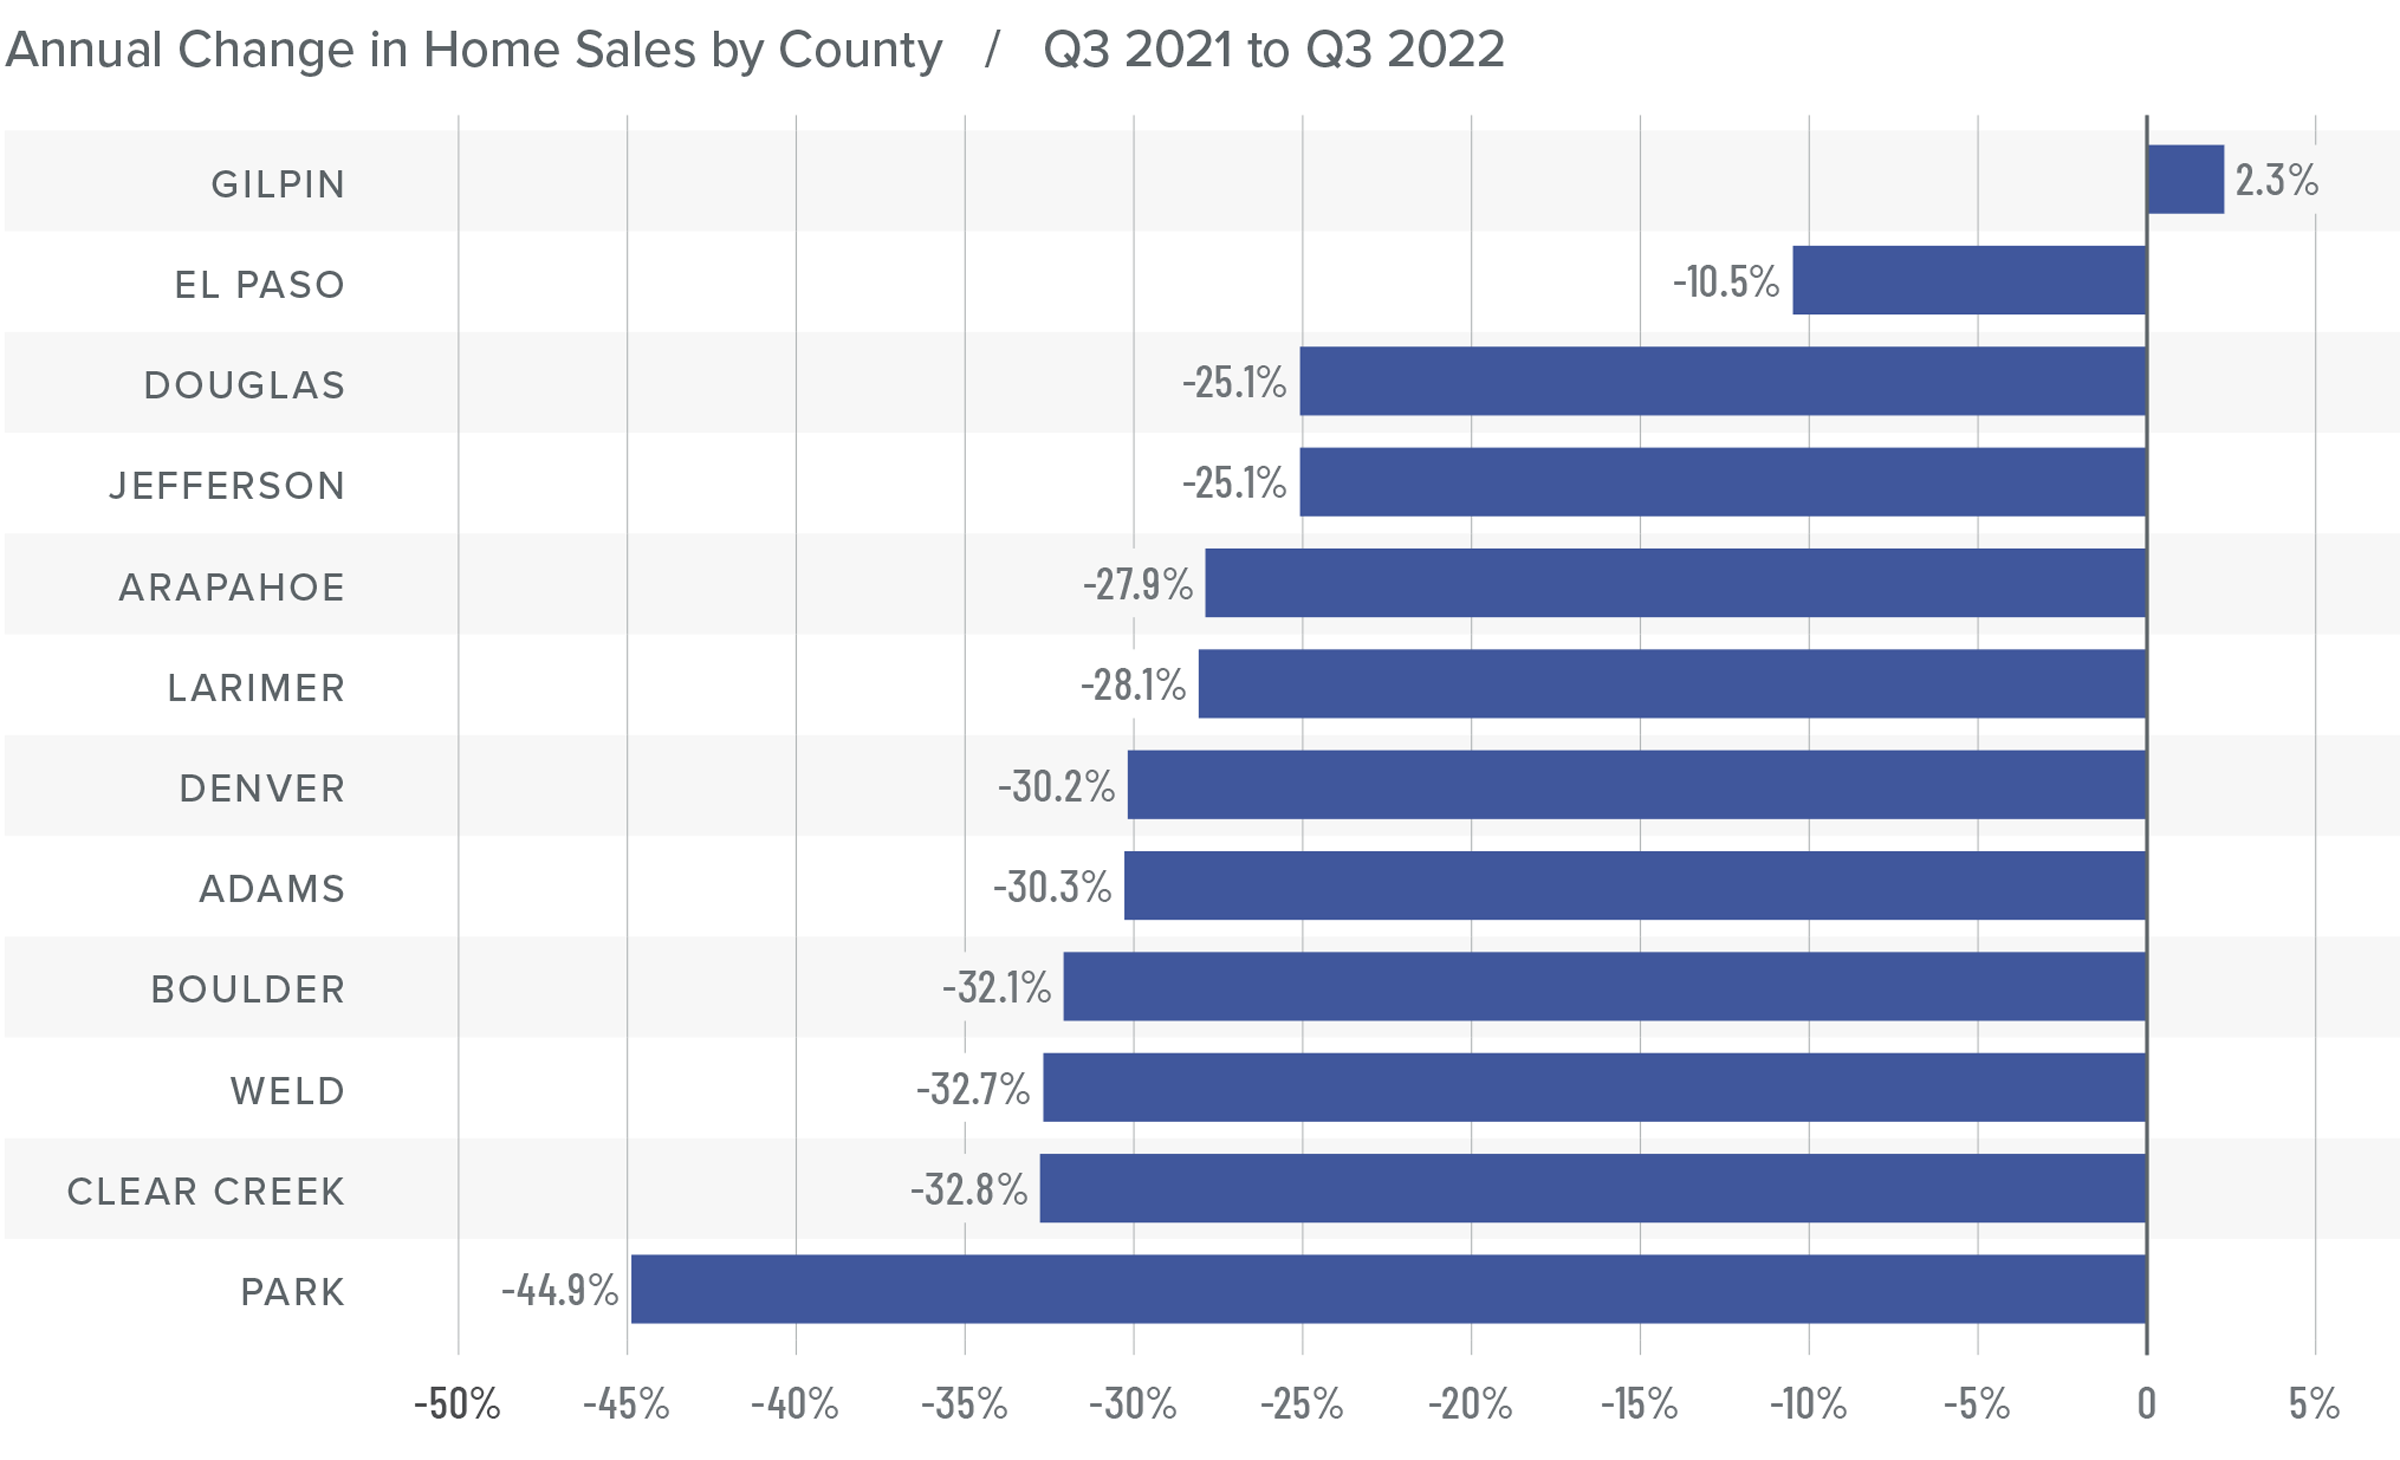
❱ In the fourth quarter of 2022, 7,097 homes sold, which was 43% fewer sales than in the fourth quarter of 2021 and 34% lower than in the third quarter of 2022.
❱ Sales fell across all of the markets covered by this report compared to the same period the year prior and the third quarter of 2022.
❱ Normal seasonal shifts in the market led the number of homes for sale to drop 20.1% compared to the third quarter. However, inventory levels were up by a very significant 164.6% from the fourth quarter of 2021.
❱ Pending sales (an indicator of future closings) dropped 40.1% from the third quarter, which suggests that the market is likely to see little, if any, growth in the early spring of 2023.
Colorado Home Prices
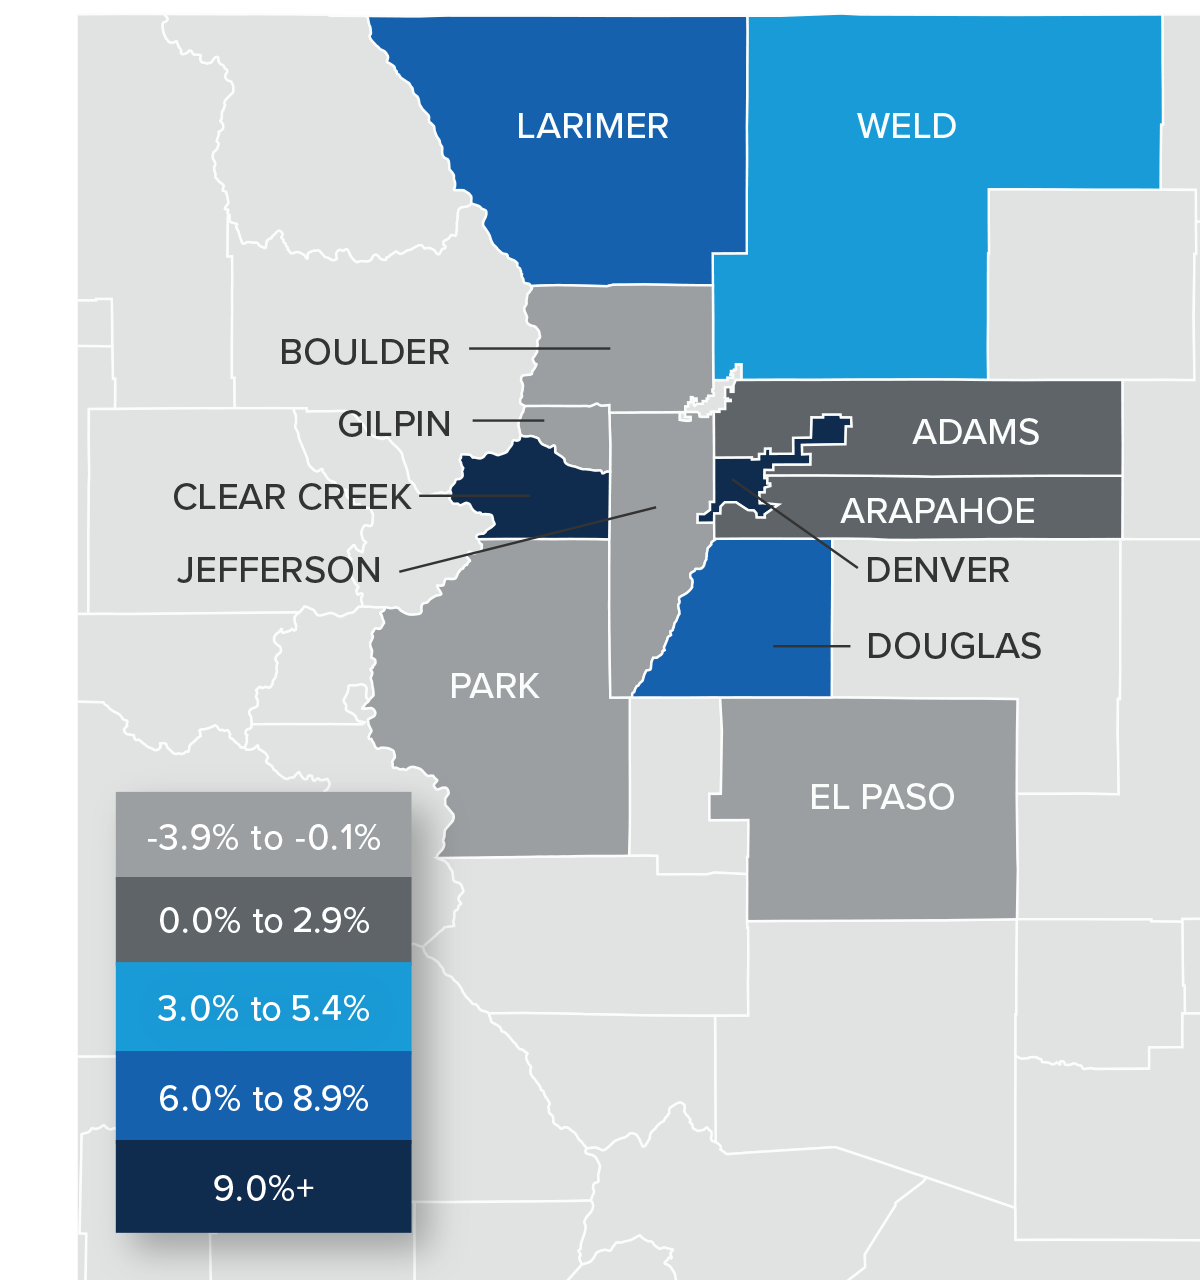
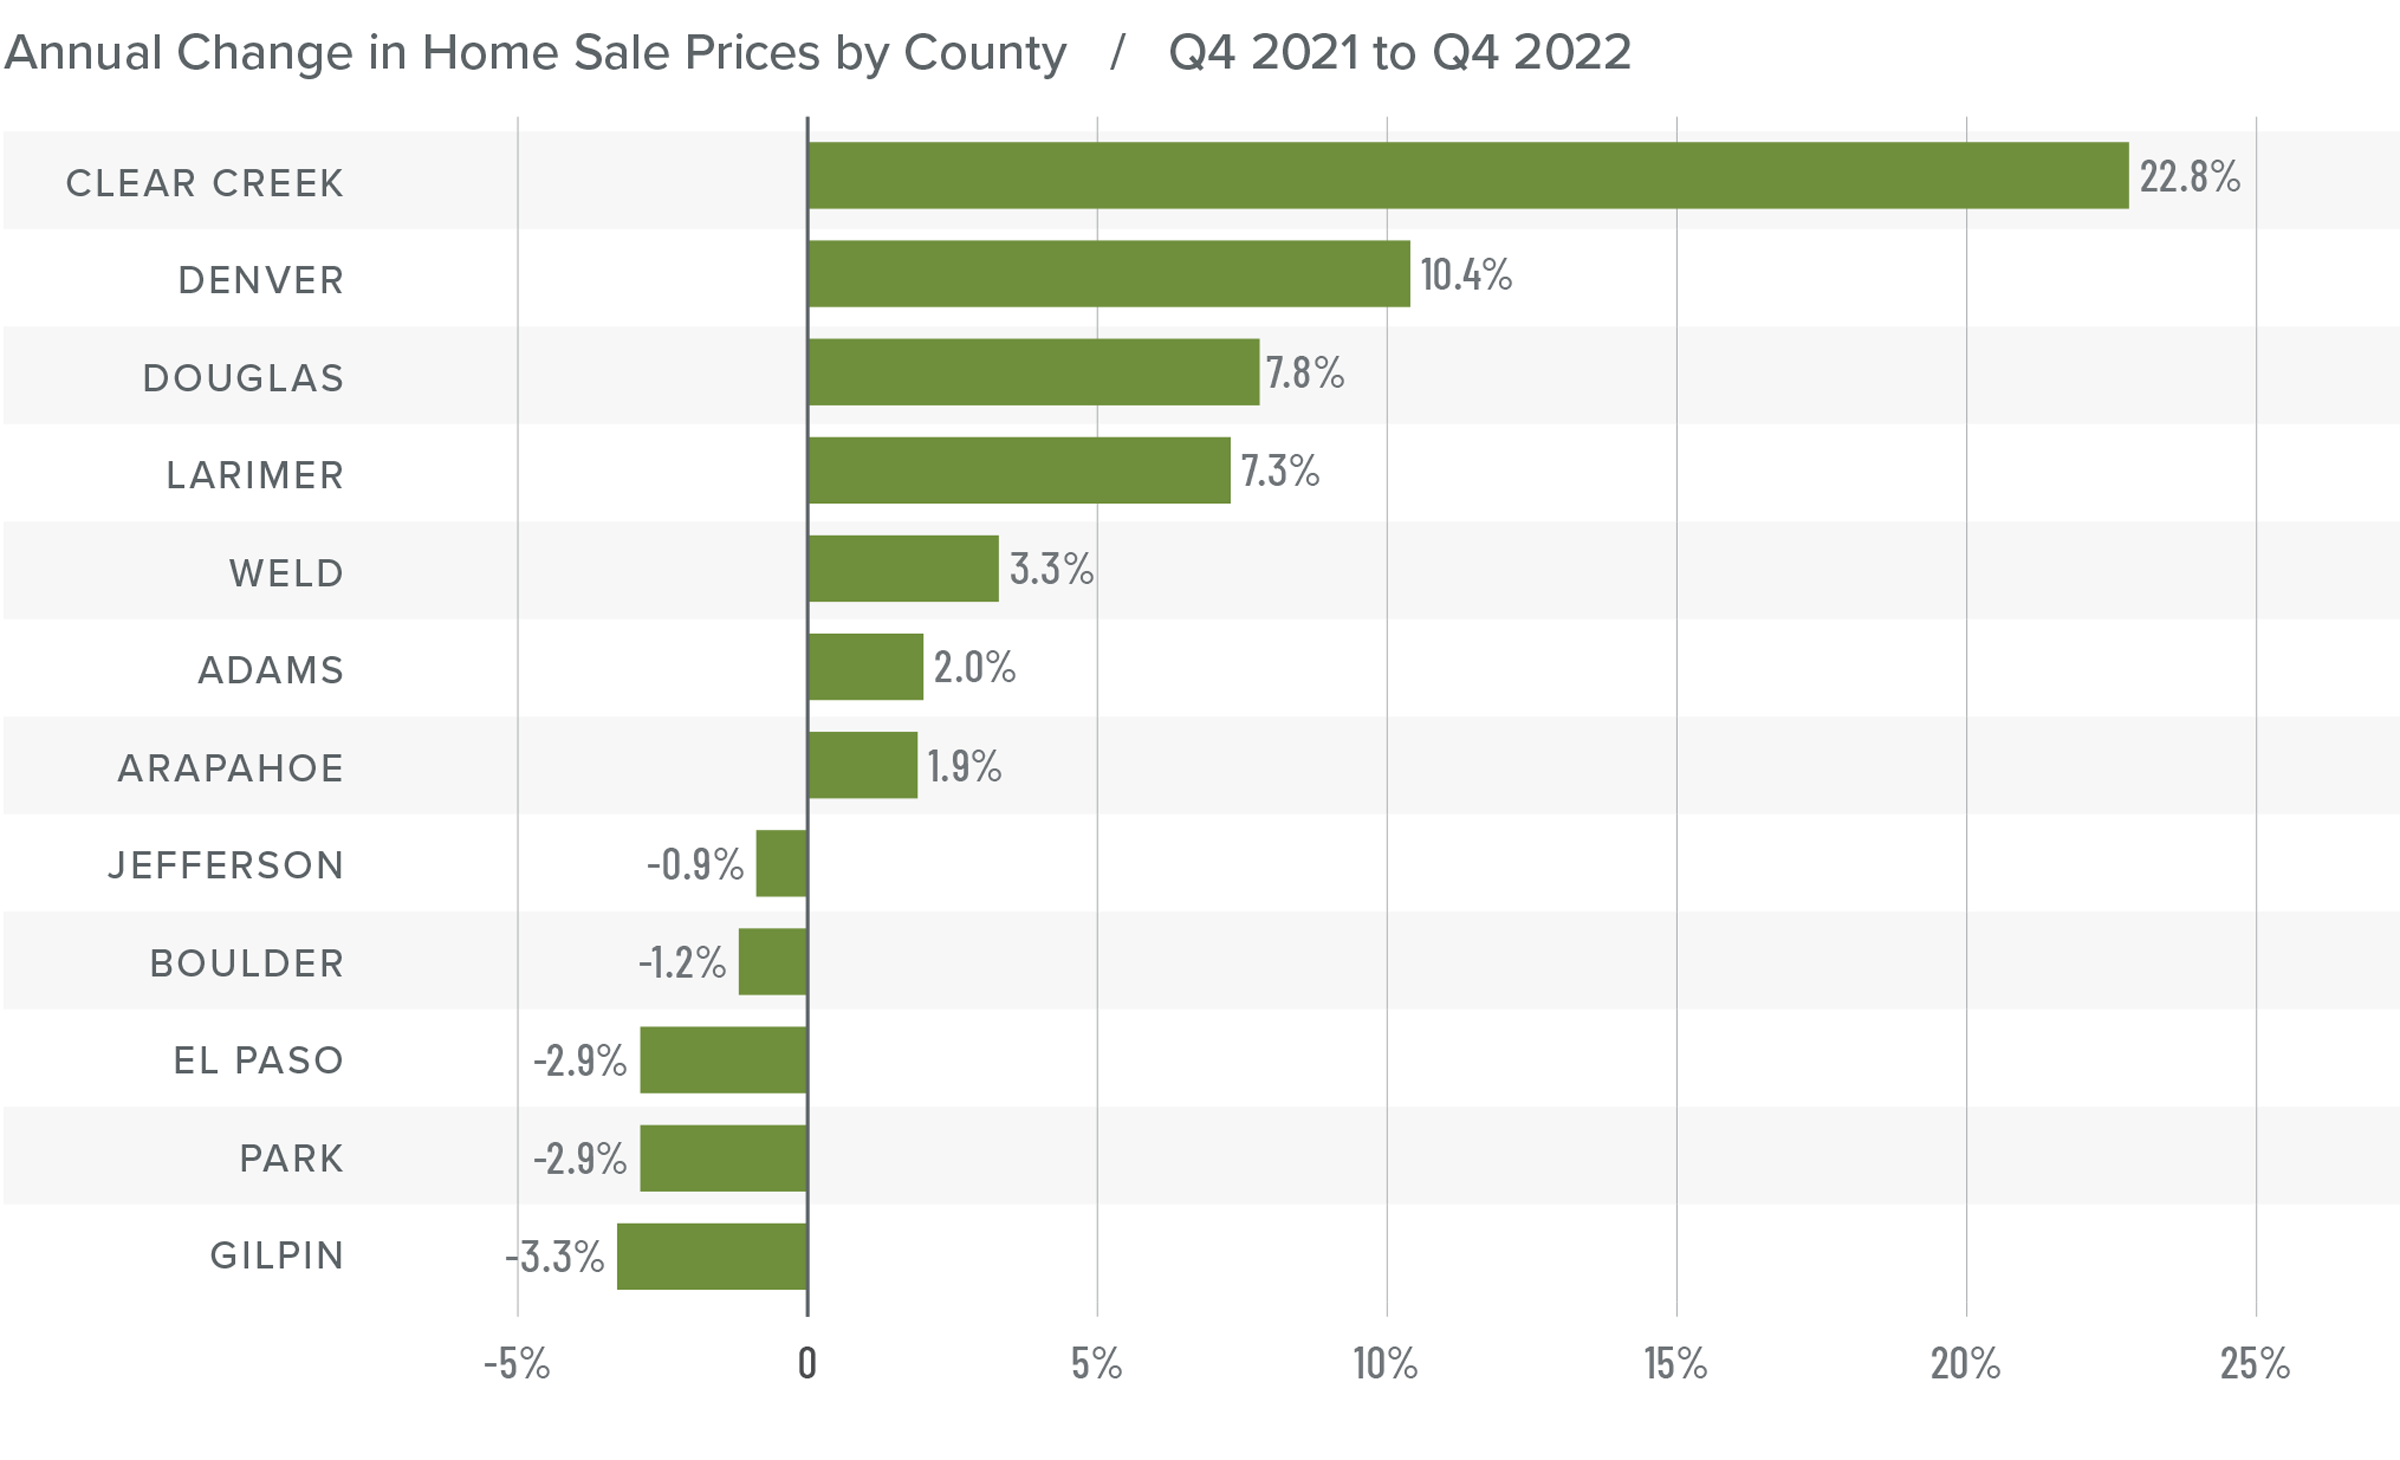
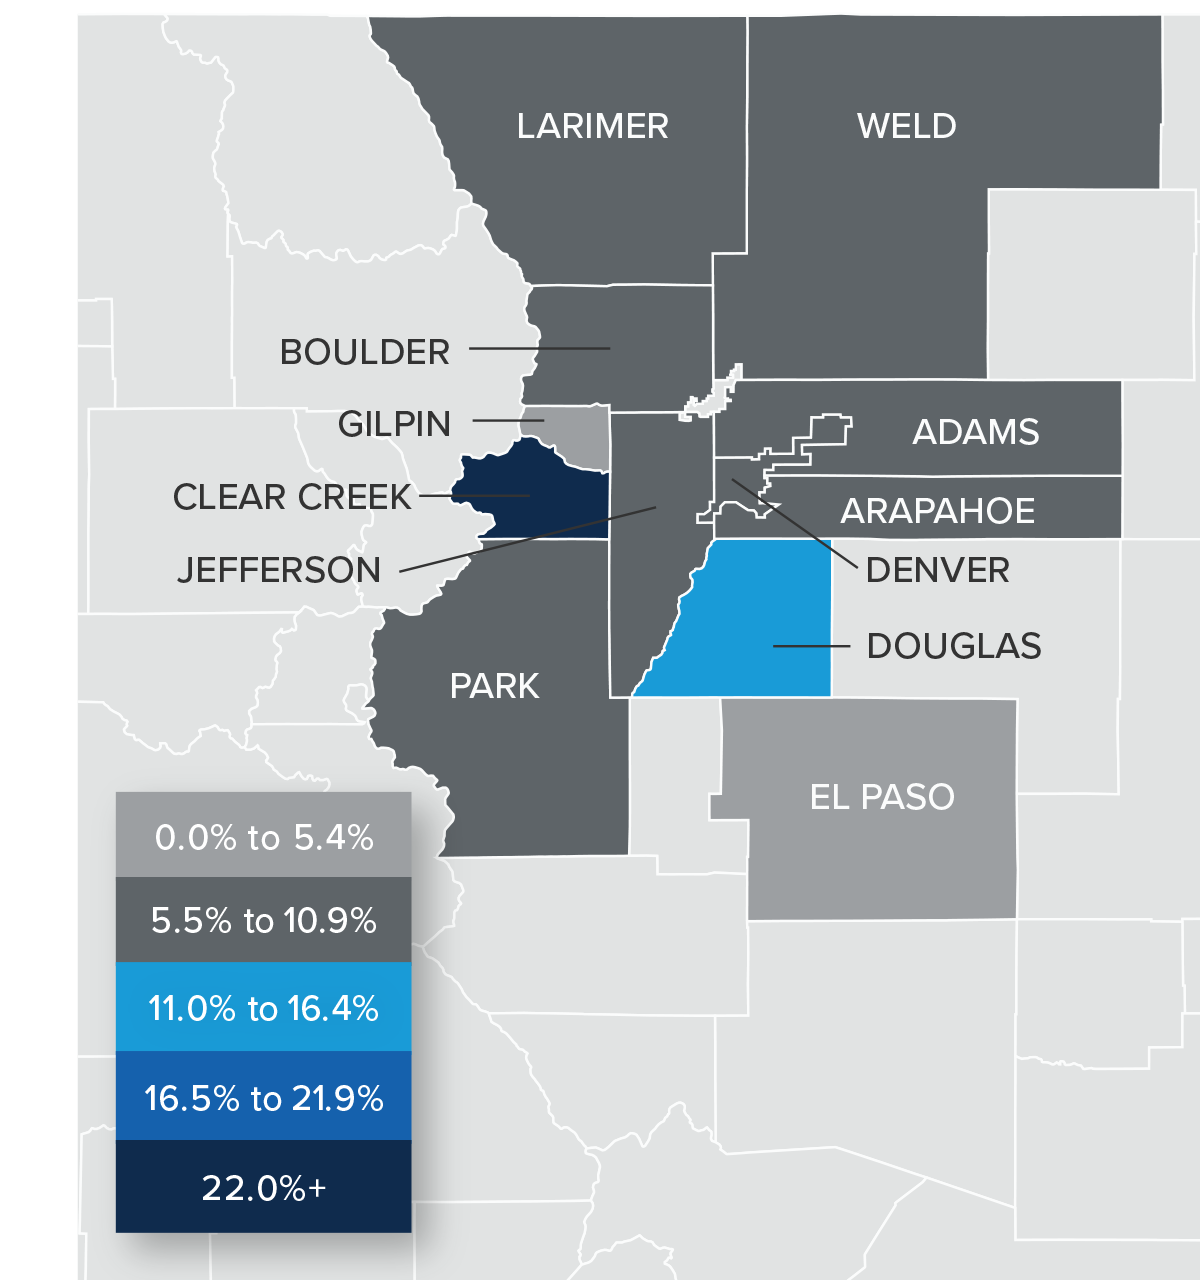
❱ Home prices rose 3.4% from the same period in 2021 to $628,373. However, prices were 4% lower than in the third quarter in 2022.
❱ Compared to the third quarter, prices fell in all counties other than Larimer, which rose .4%. Listing prices were down in every county other than Clear Creek and Gilpin.
❱ Year over year, prices rose by double digits in Clear Creek and Denver counties. Annual price growth was negative in five of the other ten counties covered by this report.
❱ Home prices rose at an unsustainable pace during the pandemic but rising mortgage rates, higher inventory levels, and lower affordability are now having an impact. Home sale prices will likely continue to pull back as we enter the spring, but the correction should halt during the summer as mortgage rates continue falling.
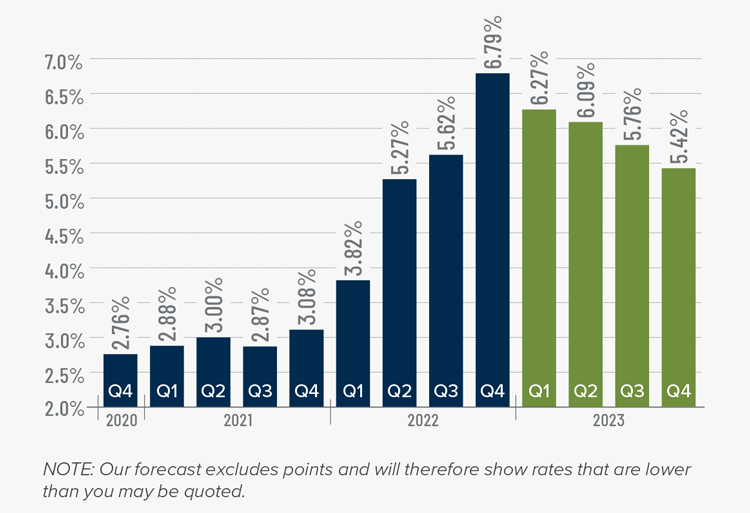
Mortgage Rates
Rates rose dramatically in 2022, but I believe that they have now peaked. Mortgage rates are primarily based on the prices and yields of bonds, and while bonds take cues from several places, they are always impacted by inflation and the economy at large. If inflation continues to fall, as I expect it will, rates will continue to drop.
My current forecast is that mortgage rates will trend lower as we move through the year. While this may be good news for home buyers, rates will still be higher than they have become accustomed to. Even as the cost of borrowing falls, home prices in expensive markets will probably fall a bit more to compensate for rates that will likely hold above 6% until early summer.
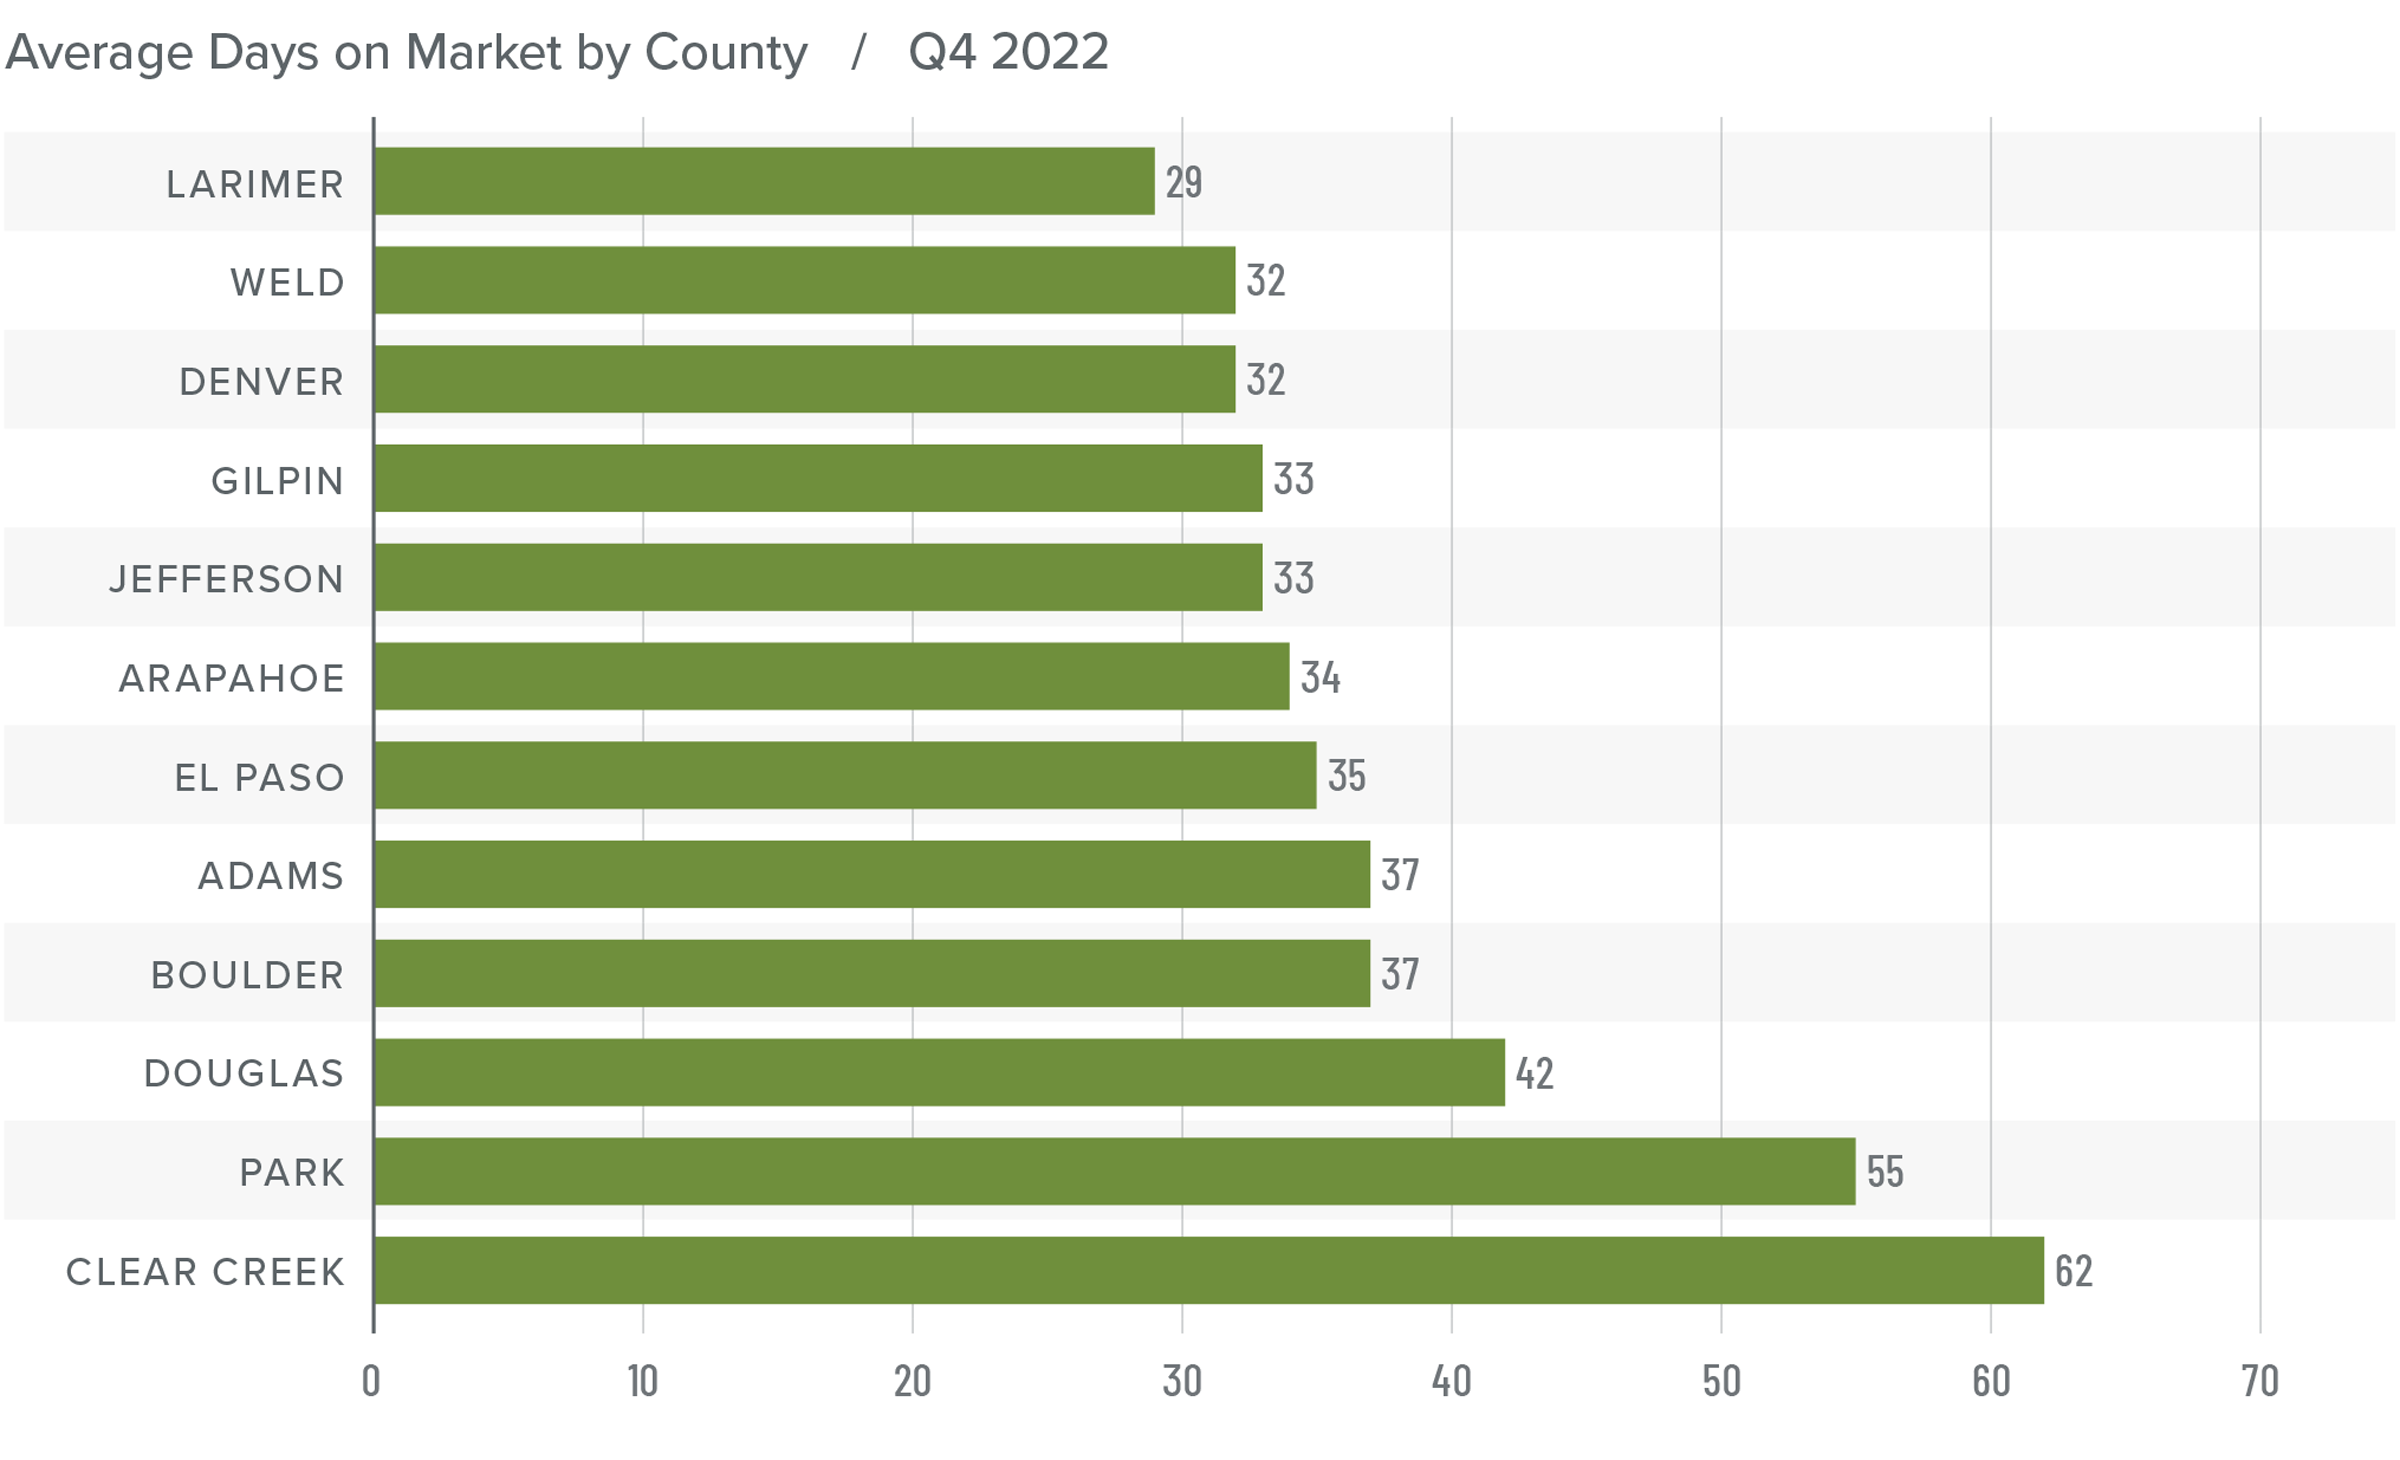
Colorado Days on Market
❱ It took an average of 38 days to sell a home in the region.
❱ The average time it took to sell a home in the markets contained in this report rose 18 days compared to the same period in 2021 and the third quarter of 2022.
❱ Year over year, the length of time it took to sell a home rose across the board.
❱ Buyers have a lot more choice in the market than they have been used to. In addition, uncertainty about the direction of mortgage rates and home prices is likely keeping some buyers sidelined.
Conclusions
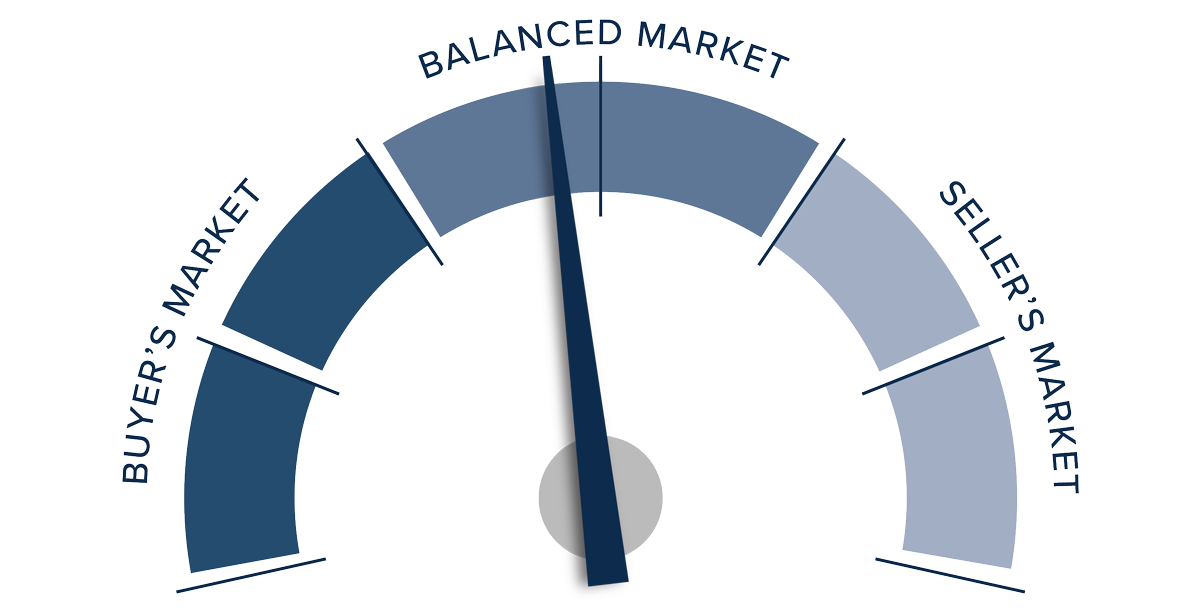
This speedometer reflects the state of the region’s real estate market using housing inventory, price gains, home sales, interest rates, and larger economic factors.
Slowing job growth, the possibility of a mild recession in 2023, and higher financing costs are all weighing on the housing market. I suggested in the third quarter Gardner Report that the market was likely to continue slowing until prices became more realistic given higher mortgage rates; I am holding to this theory. I still anticipate many markets will see negative annual price growth this year, but prices will only pull back to 2021 levels. In other words, there is no significant cause for concern.

Prices are likely to fall a little further in the first half of the year before starting to rise again in the second half. All things considered, I have moved the needle to a neutral position, favoring neither buyers nor sellers.
About Matthew Gardner
As Chief Economist for Windermere Real Estate, Matthew Gardner is responsible for analyzing and interpreting economic data and its impact on the real estate market on both a local and national level. Matthew has over 30 years of professional experience both in the U.S. and U.K.
In addition to his day-to-day responsibilities, Matthew sits on the Washington State Governors Council of Economic Advisors; chairs the Board of Trustees at the Washington Center for Real Estate Research at the University of Washington; and is an Advisory Board Member at the Runstad Center for Real Estate Studies at the University of Washington where he also lectures in real estate economics.
Q3 2022 Colorado Real Estate Market Update

The following analysis of select counties of the Colorado real estate market is provided by Windermere Real Estate Chief Economist Matthew Gardner. We hope that this information may assist you with making better-informed real estate decisions. For further information about the housing market in your area, please don’t hesitate to contact your Windermere Real Estate agent.
Regional Economic Overview
Though statewide job growth continues to taper in Colorado, more than 108,000 jobs have been added over the past 12 months, representing an annual growth rate of 3.9%. The unemployment rate in August stood at a healthy 3.4%. Regionally, unemployment rates ranged from a low of 2.6% in Boulder to a high of 3.7% in the Grand Junction and Greeley metropolitan areas.
Colorado Home Sales
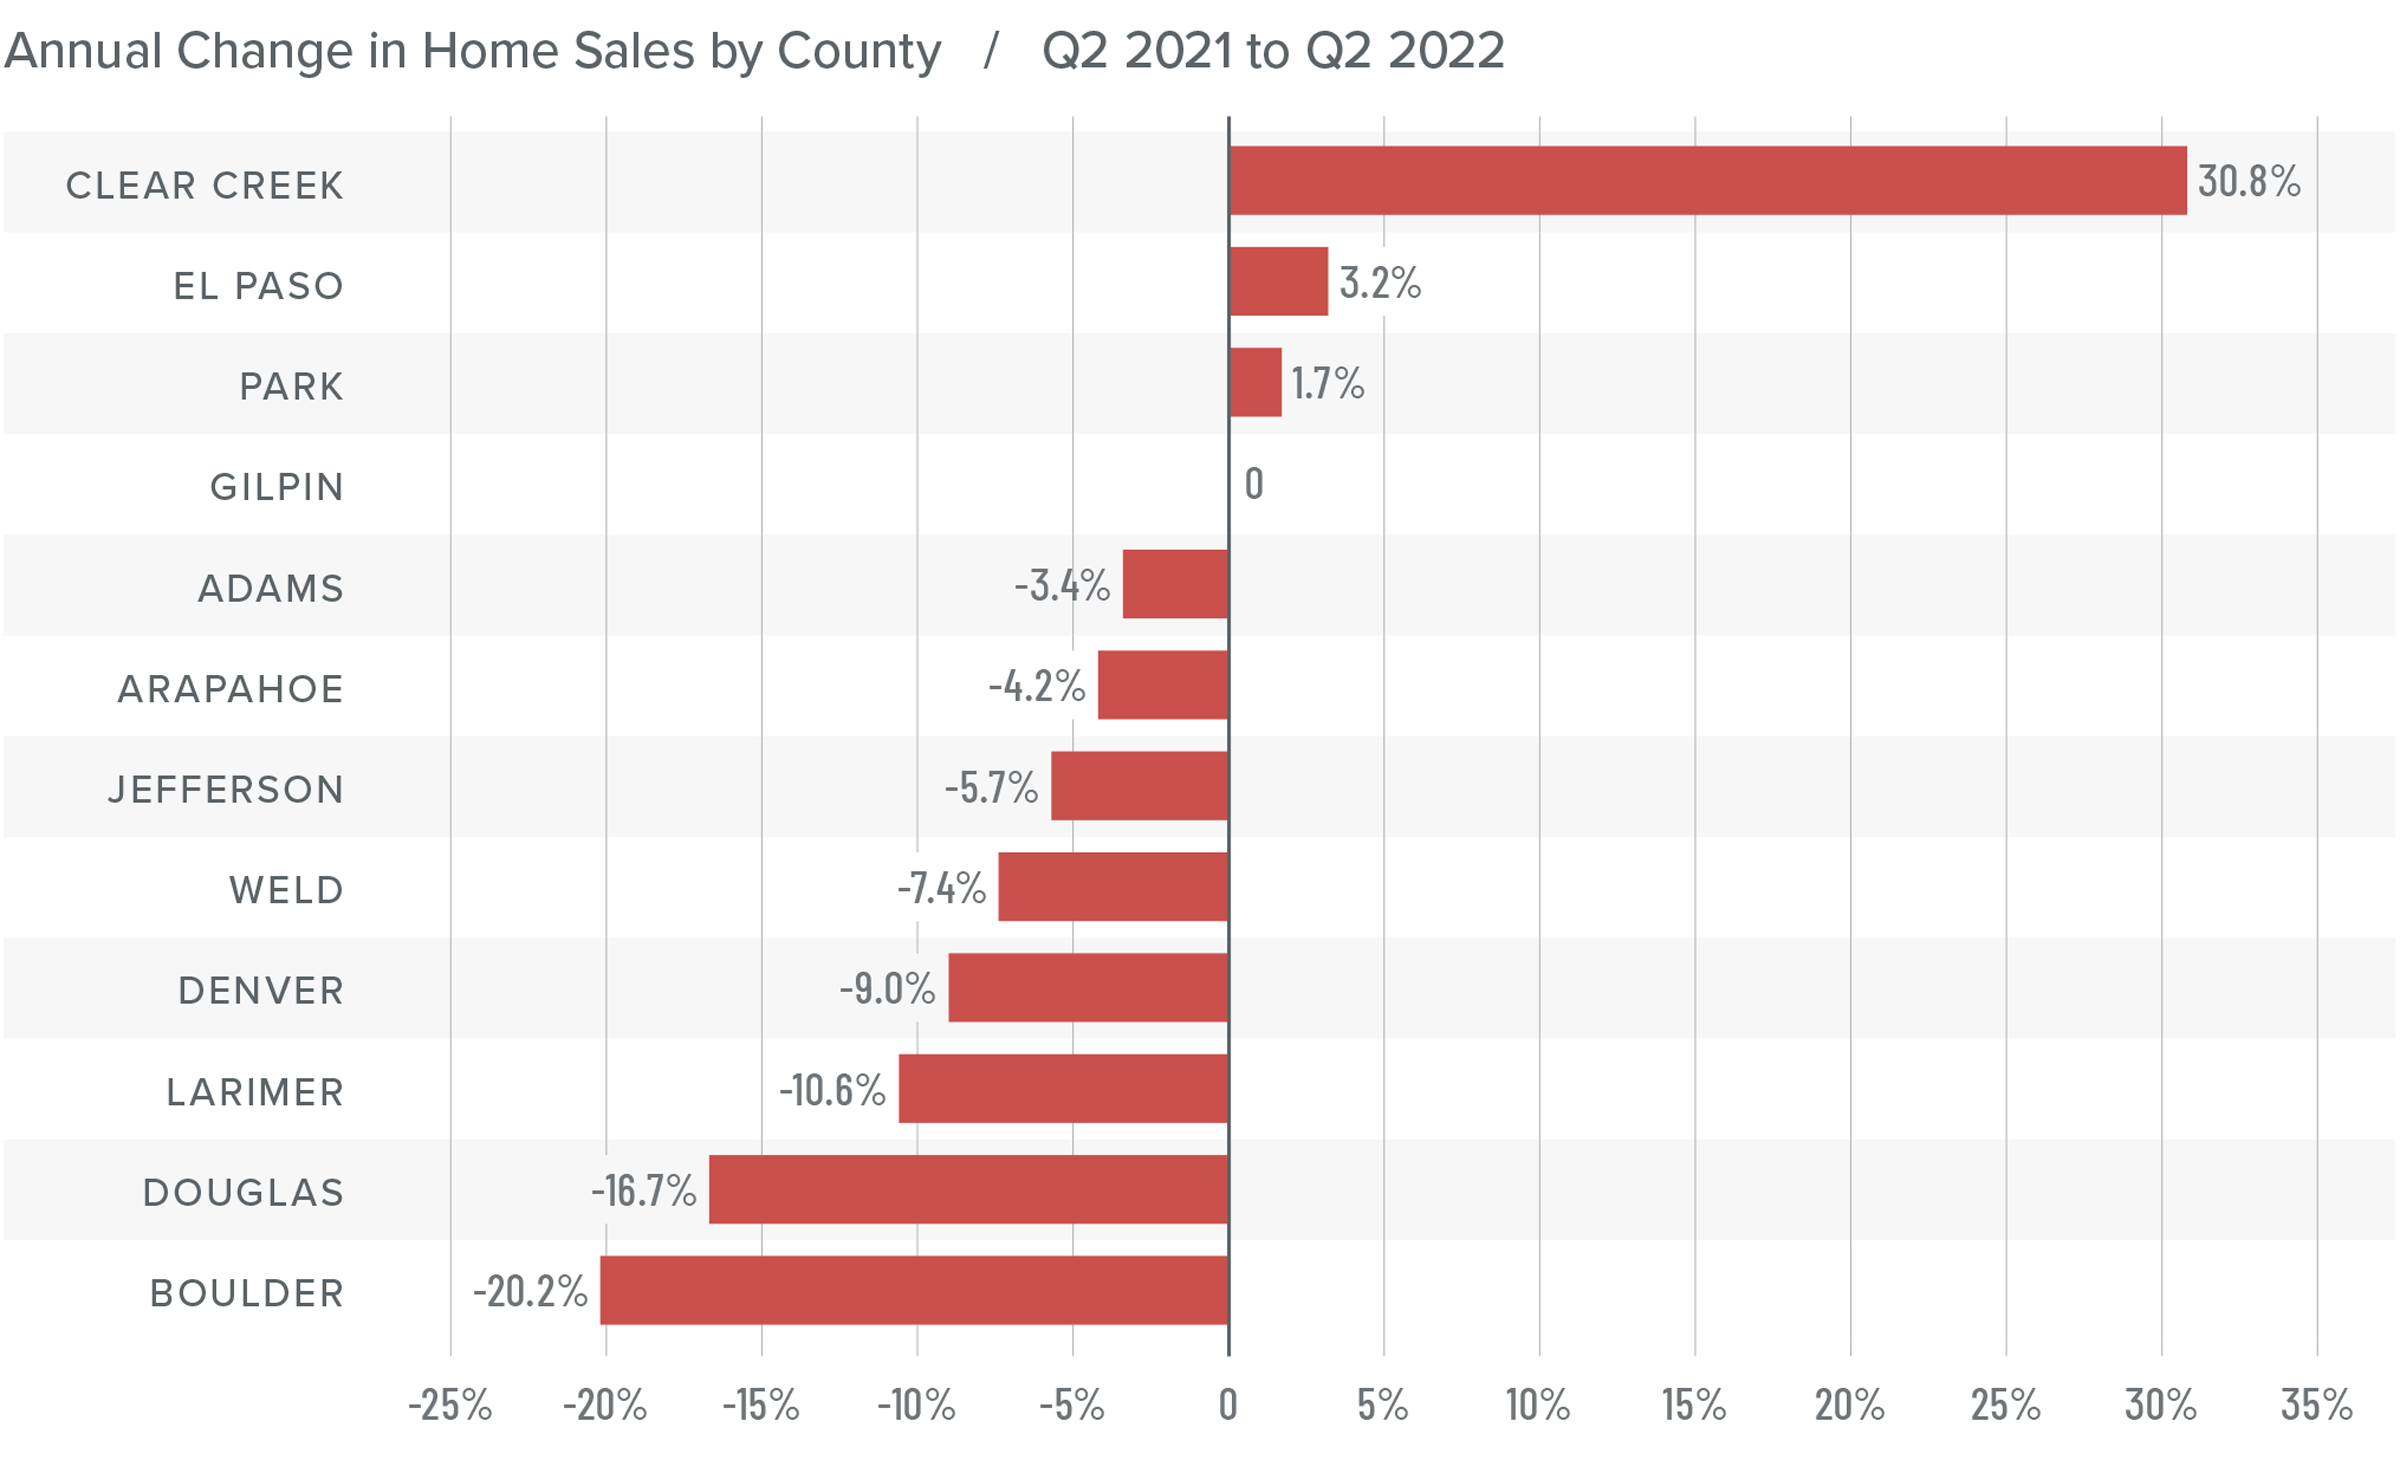
❱ In the third quarter, 10,749 homes were sold, which is a drop of 27.8% from a year ago. Sales were 16.3% lower than in the second quarter of 2022.
❱ Year over year, sales rose in Gilpin County but fell in the balance of the region. Sales increased in Gilpin, Clear Creek, and El Paso counties over the second quarter.
❱ Inventory levels jumped 73.1% in the third quarter, which is significant even though it is a slower pace of growth than occurred between the first and second quarters.
❱ Pending sales, which are an indicator of future closings, dropped 22.3% from the second quarter. Placed alongside rising inventory levels and lower sales activity, this clearly suggests that the market is pulling back rather quickly following the remarkably buoyant period between 2020 and 2021.
Colorado Home Prices
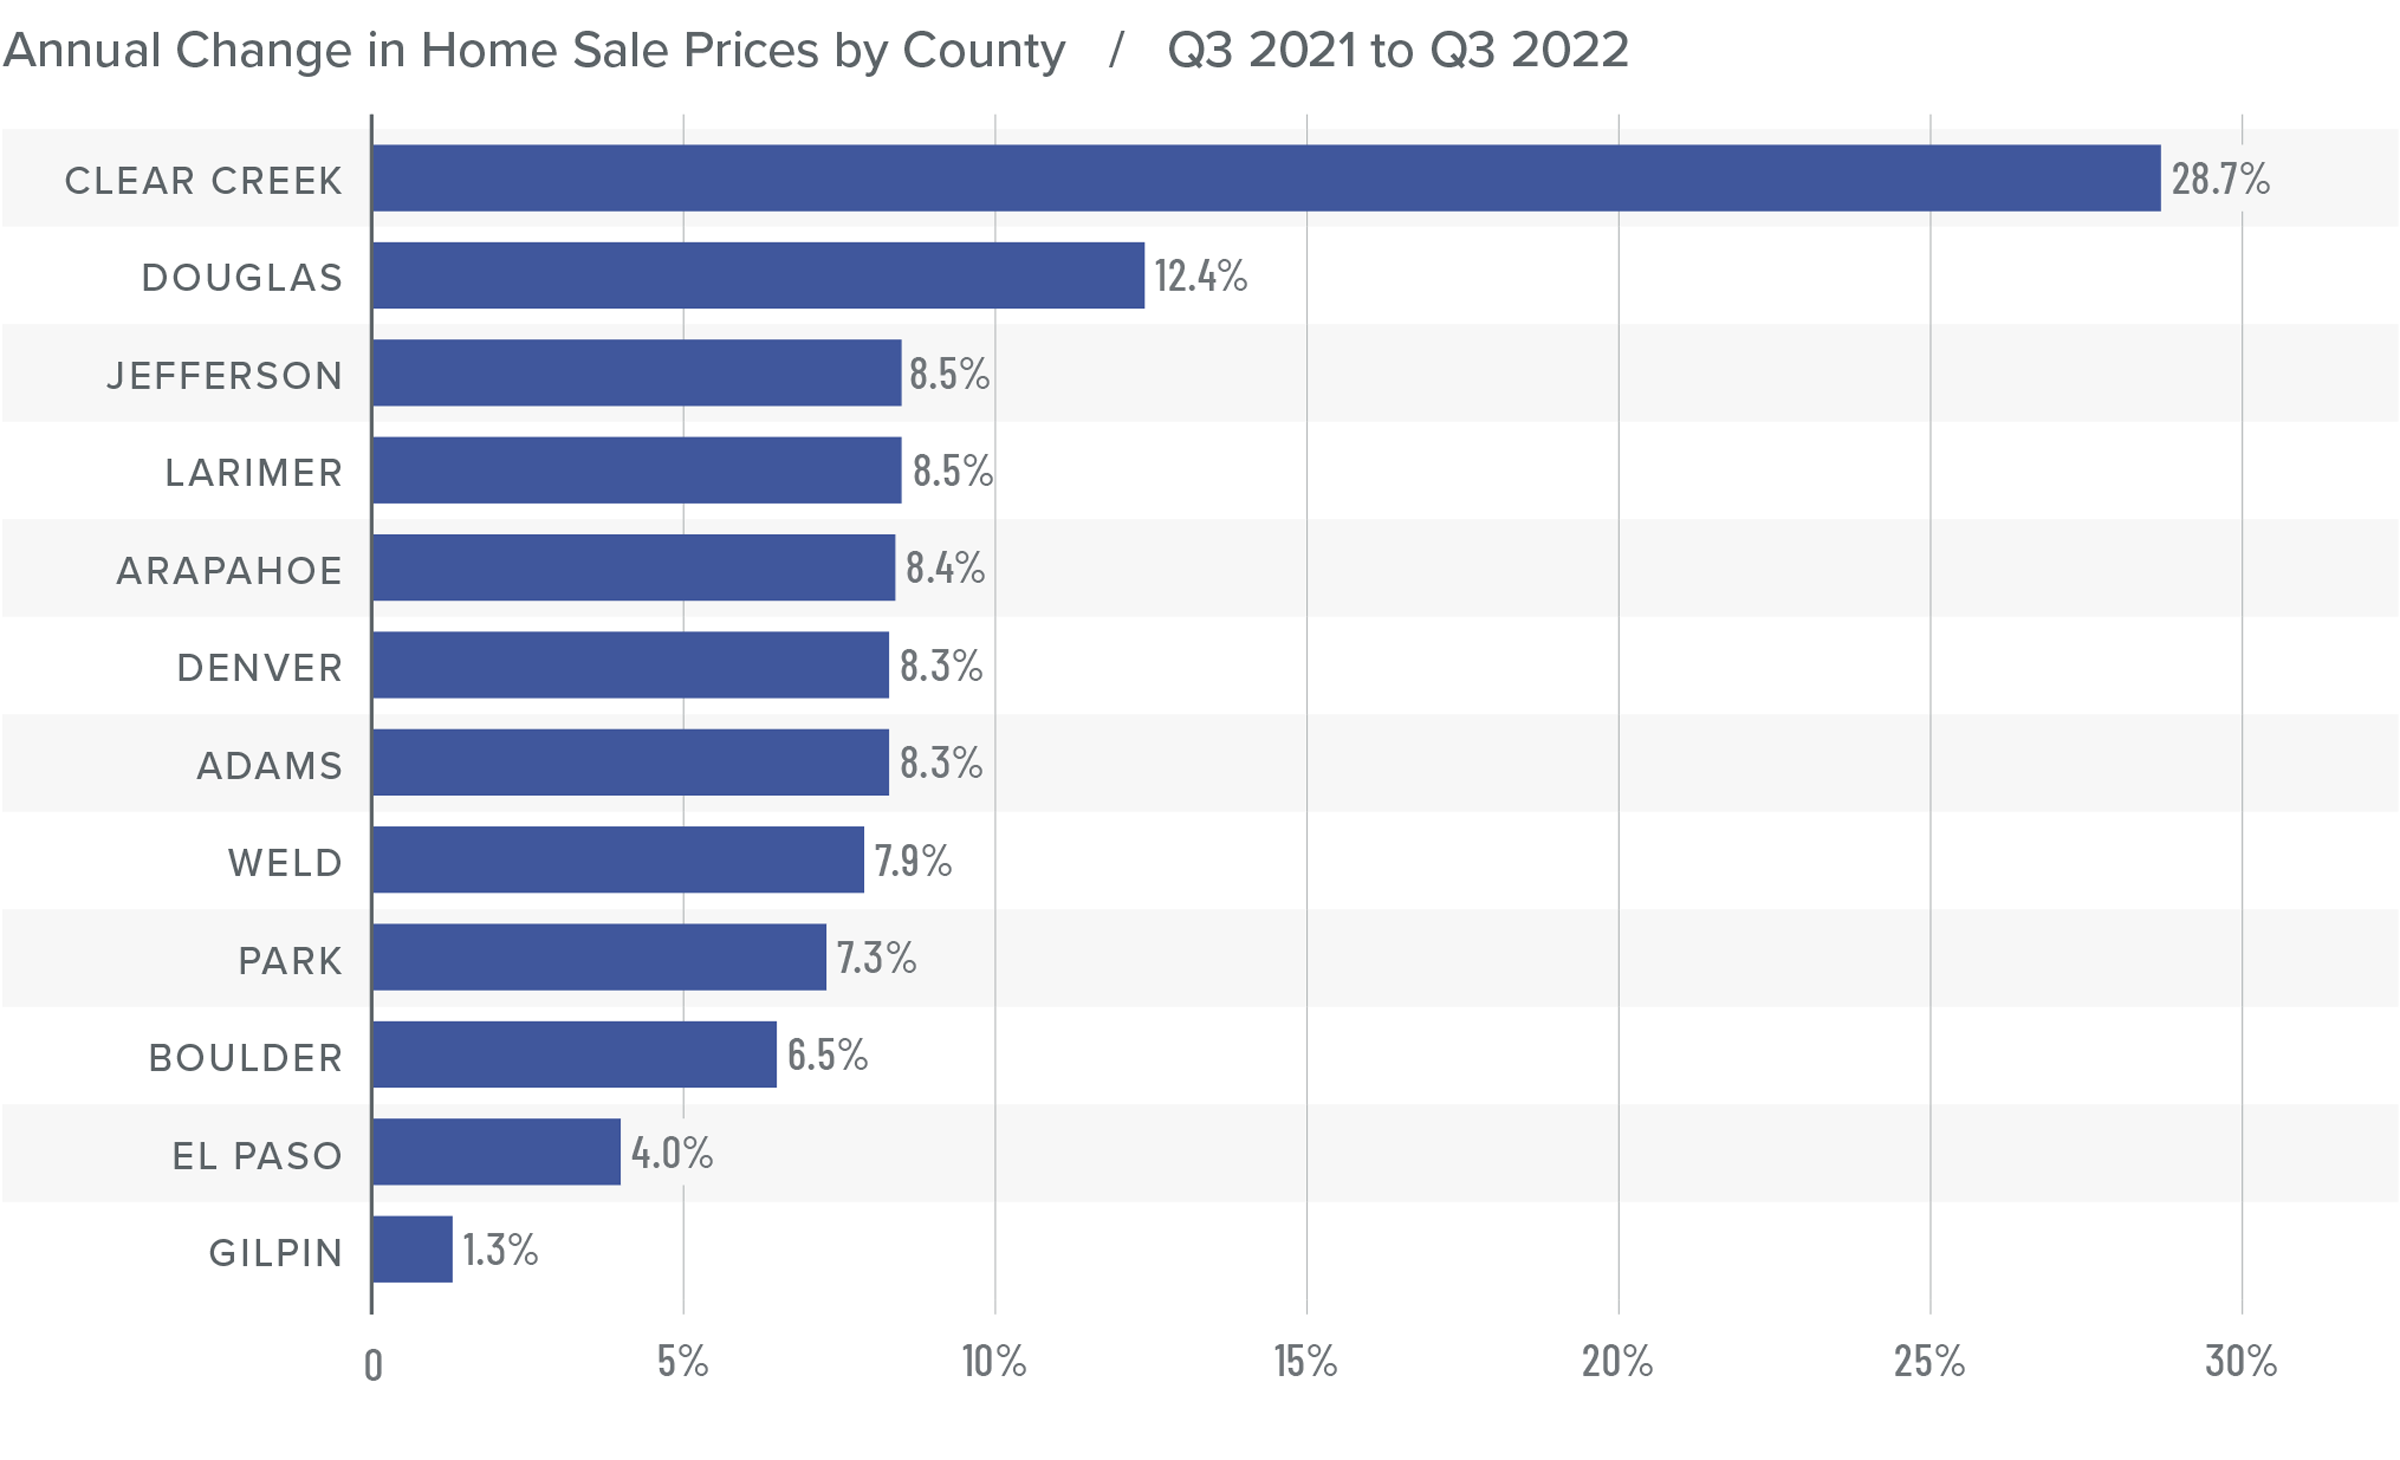
❱ The average home sale price rose 8.3% from the same period in 2021 to $654,425. However, prices were 6.6% lower than in the second quarter.
❱ Compared to the second quarter, listing prices dropped in all counties except Clear Creek and Gilpin, suggesting that sellers are starting to realize that the market has shifted.
❱ Year over year, prices rose by double digits in Clear Creek and Douglas counties and rose by single digits in the rest of the market areas.
❱ Rising mortgage rates and inventory levels are now impacting the region’s housing market. As stated in the second quarter Gardner Report, any palpable drop in listing prices is an indication that the market is softening, which has proven to be the case.
Mortgage Rates
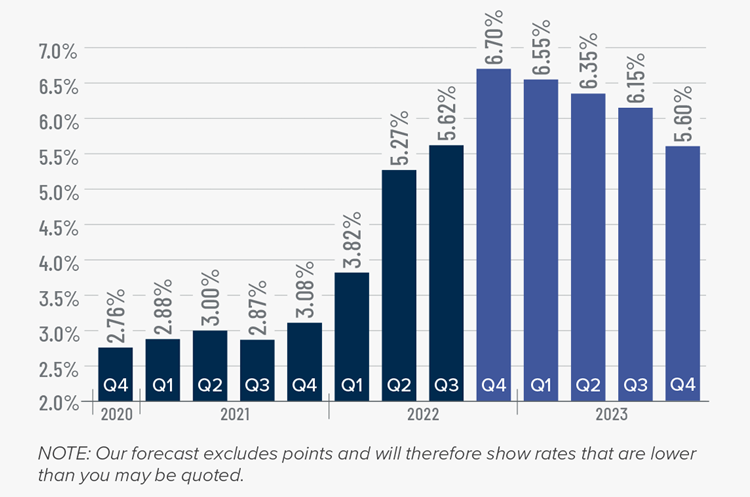
This remains an uncertain period for mortgage rates. When the Federal Reserve slowed bond purchases in 2013, investors were accused of having a “taper tantrum,” and we are seeing a similar reaction today. The Fed appears to be content to watch the housing market go through a period of pain as they throw all their tools at reducing inflation.
As a result, mortgage rates are out of sync with treasury yields, which not only continues to push rates much higher, but also creates violent swings in both directions. My current forecast calls for rates to peak in the fourth quarter of this year before starting to slowly pull back. That said, they will remain in the 6% range until the end of 2023.
Colorado Days on Market
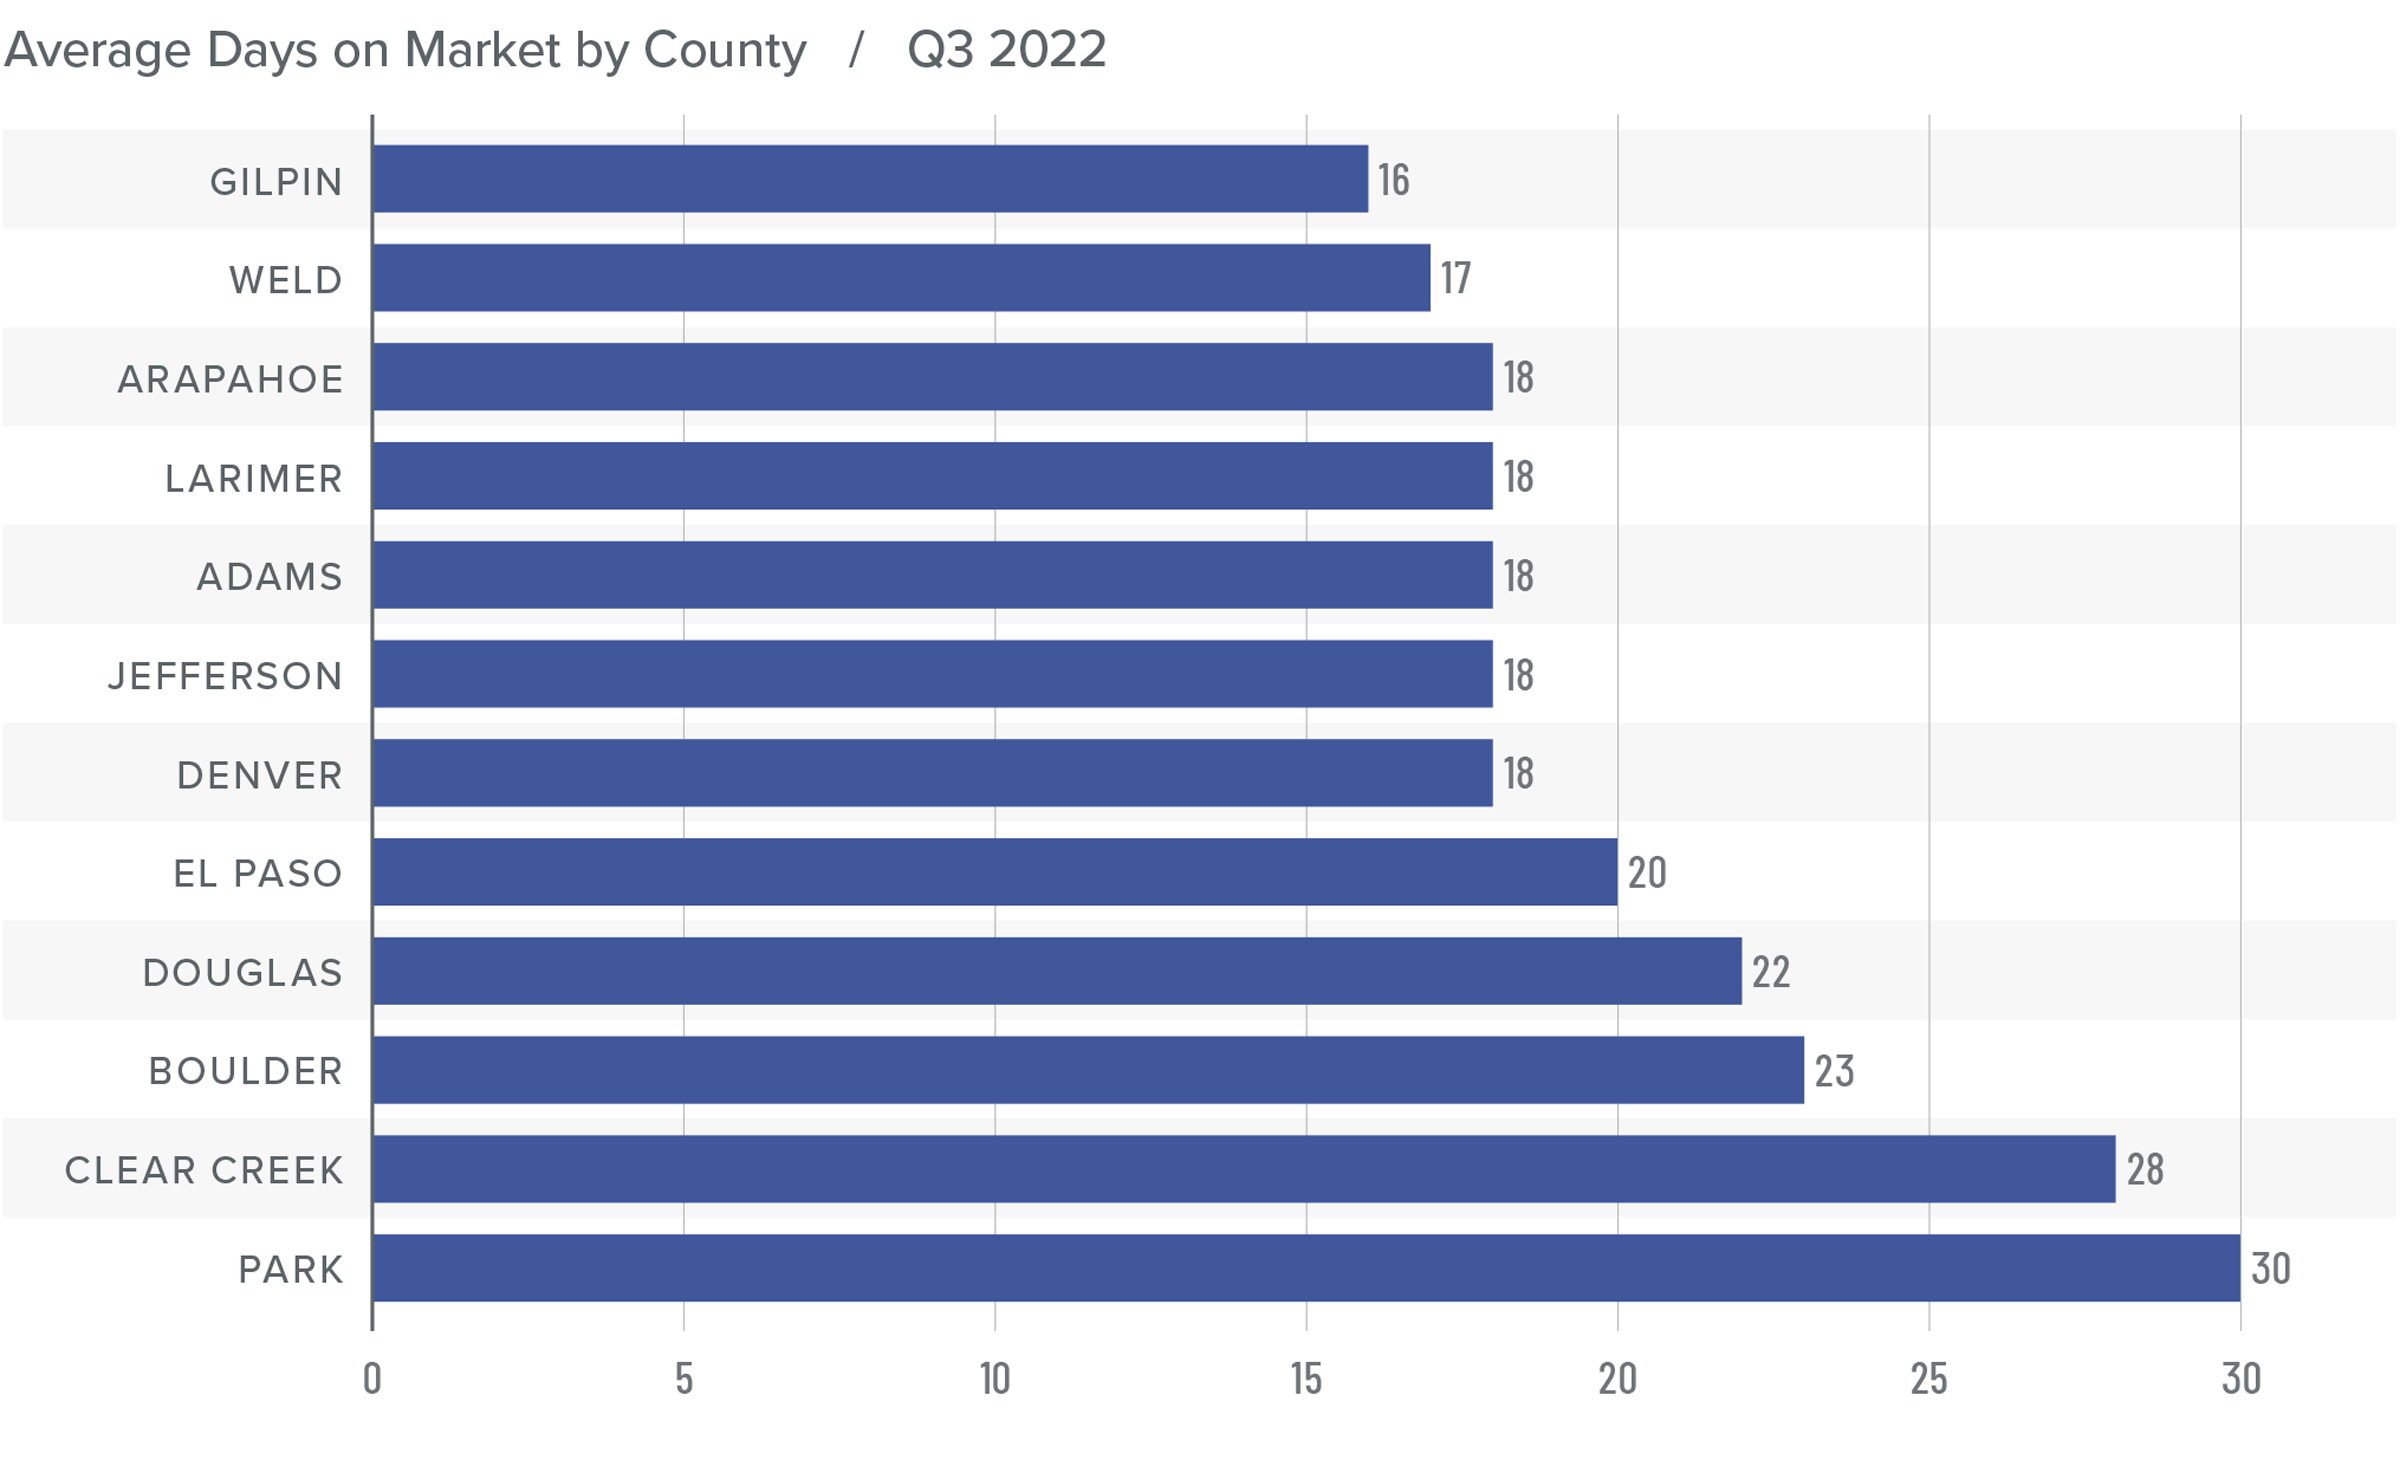
❱ The average number of days it took to sell a home in the markets contained in this report rose eight days compared to the same period in 2021.
❱ The length of time it took to sell a home rose across the board compared to the same quarter a year ago.
❱ It took an average of 20 days to sell a home in the region, which is up 11 days compared to the second quarter of the year.
❱ Although market time has risen significantly, it is worth noting that the average time it took for a home to sell in the quarter was still ten fewer days than in the third quarter of 2019.
Conclusions
This speedometer reflects the state of the region’s real estate market using housing inventory, price gains, home sales, interest rates, and larger economic factors.
Although all jobs that were lost during the pandemic have now returned and 54,700 new jobs have been added, this has not saved the housing market from cooling. Some are suggesting that we are heading into a period similar to the bursting of the housing bubble in the mid-2000s, but I don’t agree. Through the pandemic, the housing market was artificially inflated by historically low mortgage rates, not by underqualified buyers, but such favorable financing could not carry on forever.

I expect the market will continue to slow until it gets to a sustainable level of growth. Some markets will see annual price growth turn negative. Given that 57% of Colorado homeowners with a mortgage have more than 50% equity, a modest drop in values is nothing to be concerned about. With more supply and list prices pulling back, I am moving the needle more toward balance. This will favor buyers, but the market is still far from being totally in their favor.
About Matthew Gardner
As Chief Economist for Windermere Real Estate, Matthew Gardner is responsible for analyzing and interpreting economic data and its impact on the real estate market on both a local and national level. Matthew has over 30 years of professional experience both in the U.S. and U.K.
In addition to his day-to-day responsibilities, Matthew sits on the Washington State Governors Council of Economic Advisors; chairs the Board of Trustees at the Washington Center for Real Estate Research at the University of Washington; and is an Advisory Board Member at the Runstad Center for Real Estate Studies at the University of Washington where he also lectures in real estate economics.
Q2 2022 Colorado Real Estate Market Update

The following analysis of select counties of the Colorado real estate market is provided by Windermere Real Estate Chief Economist Matthew Gardner. We hope that this information may assist you with making better-informed real estate decisions. For further information about the housing market in your area, please don’t hesitate to contact your Windermere Real Estate agent.
Regional Economic Overview
Colorado continues to add jobs, but the pace of growth has slowed, albeit modestly. At the time of writing this report, the state’s employment had increased by 124,600 jobs over the past 12 months, which represents an annual growth rate of 4.6%. The state unemployment rate in May was 3.5%. Regionally, unemployment rates ranged from a low of 2.4% in Boulder to a high of 3.4% in the Grand Junction and Greeley metropolitan areas.
Colorado Home Sales
❱ In the second quarter, 12,839 homes sold, a drop of 8% compared to a year ago but 57% higher than in the first quarter of this year.
❱ Year over year, sales rose in only three counties covered by this report and fell in the rest of the region. That said, there was a palpable increase in sales across the board compared to the first quarter of 2022.
❱ The significant jump in sales from the first quarter can likely be attributed to the fact that inventory levels spiked, rising more than 190% from the first quarter.
❱ Pending sales (an indicator of future closings) rose 39% from the first quarter, signifying that the third quarter may show further growth in sales activity.
Colorado Home Prices
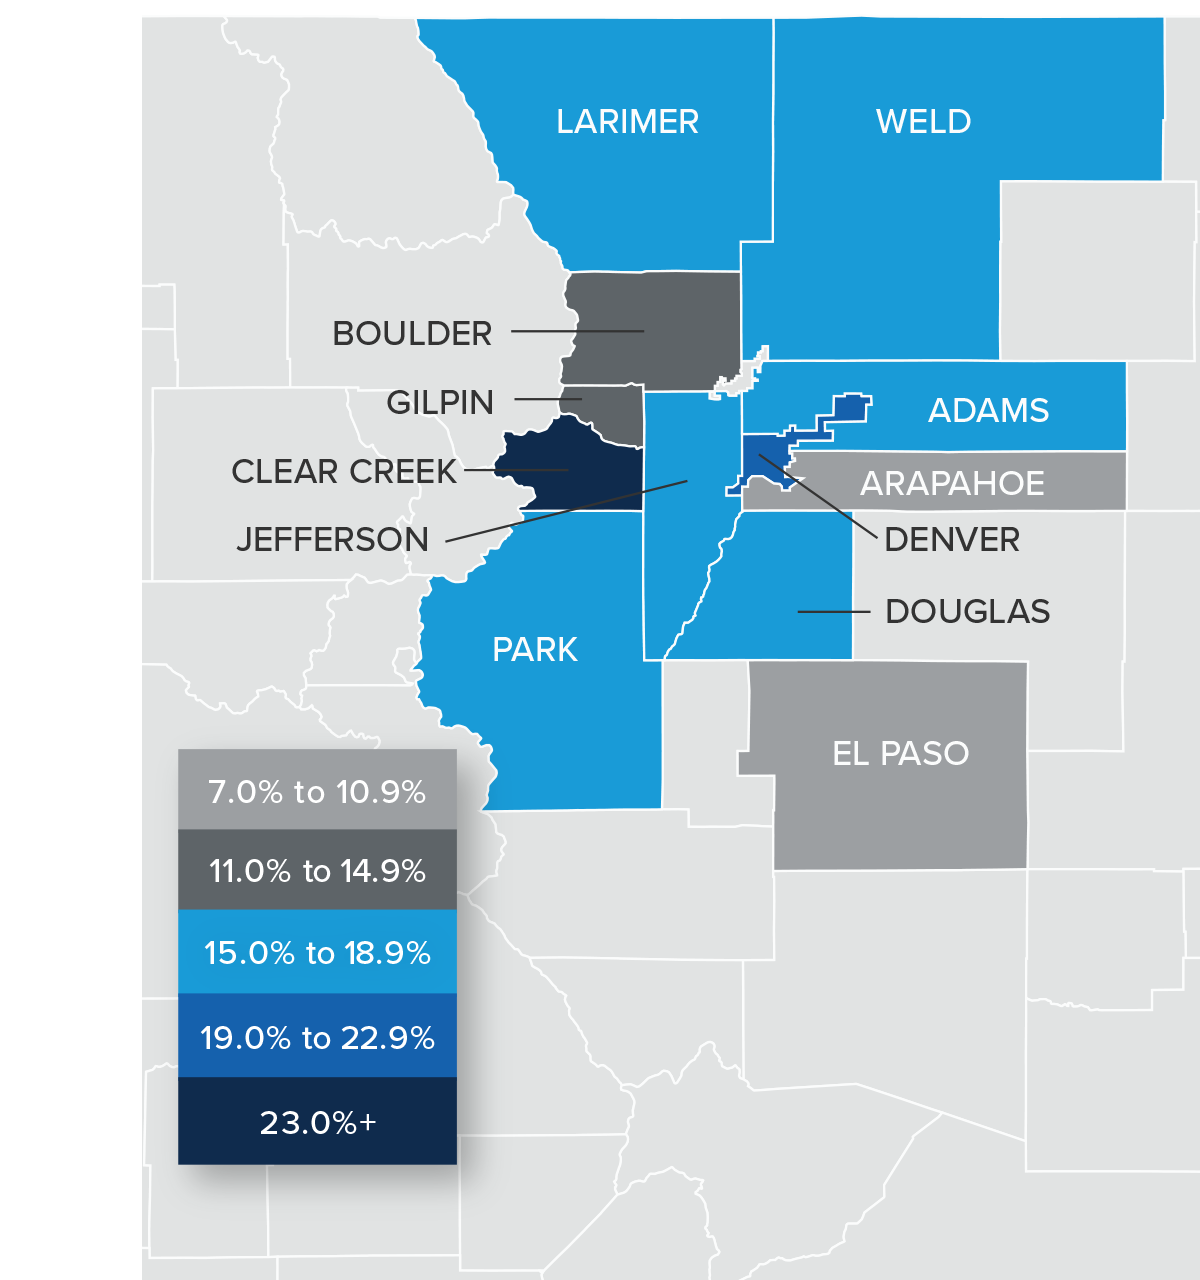
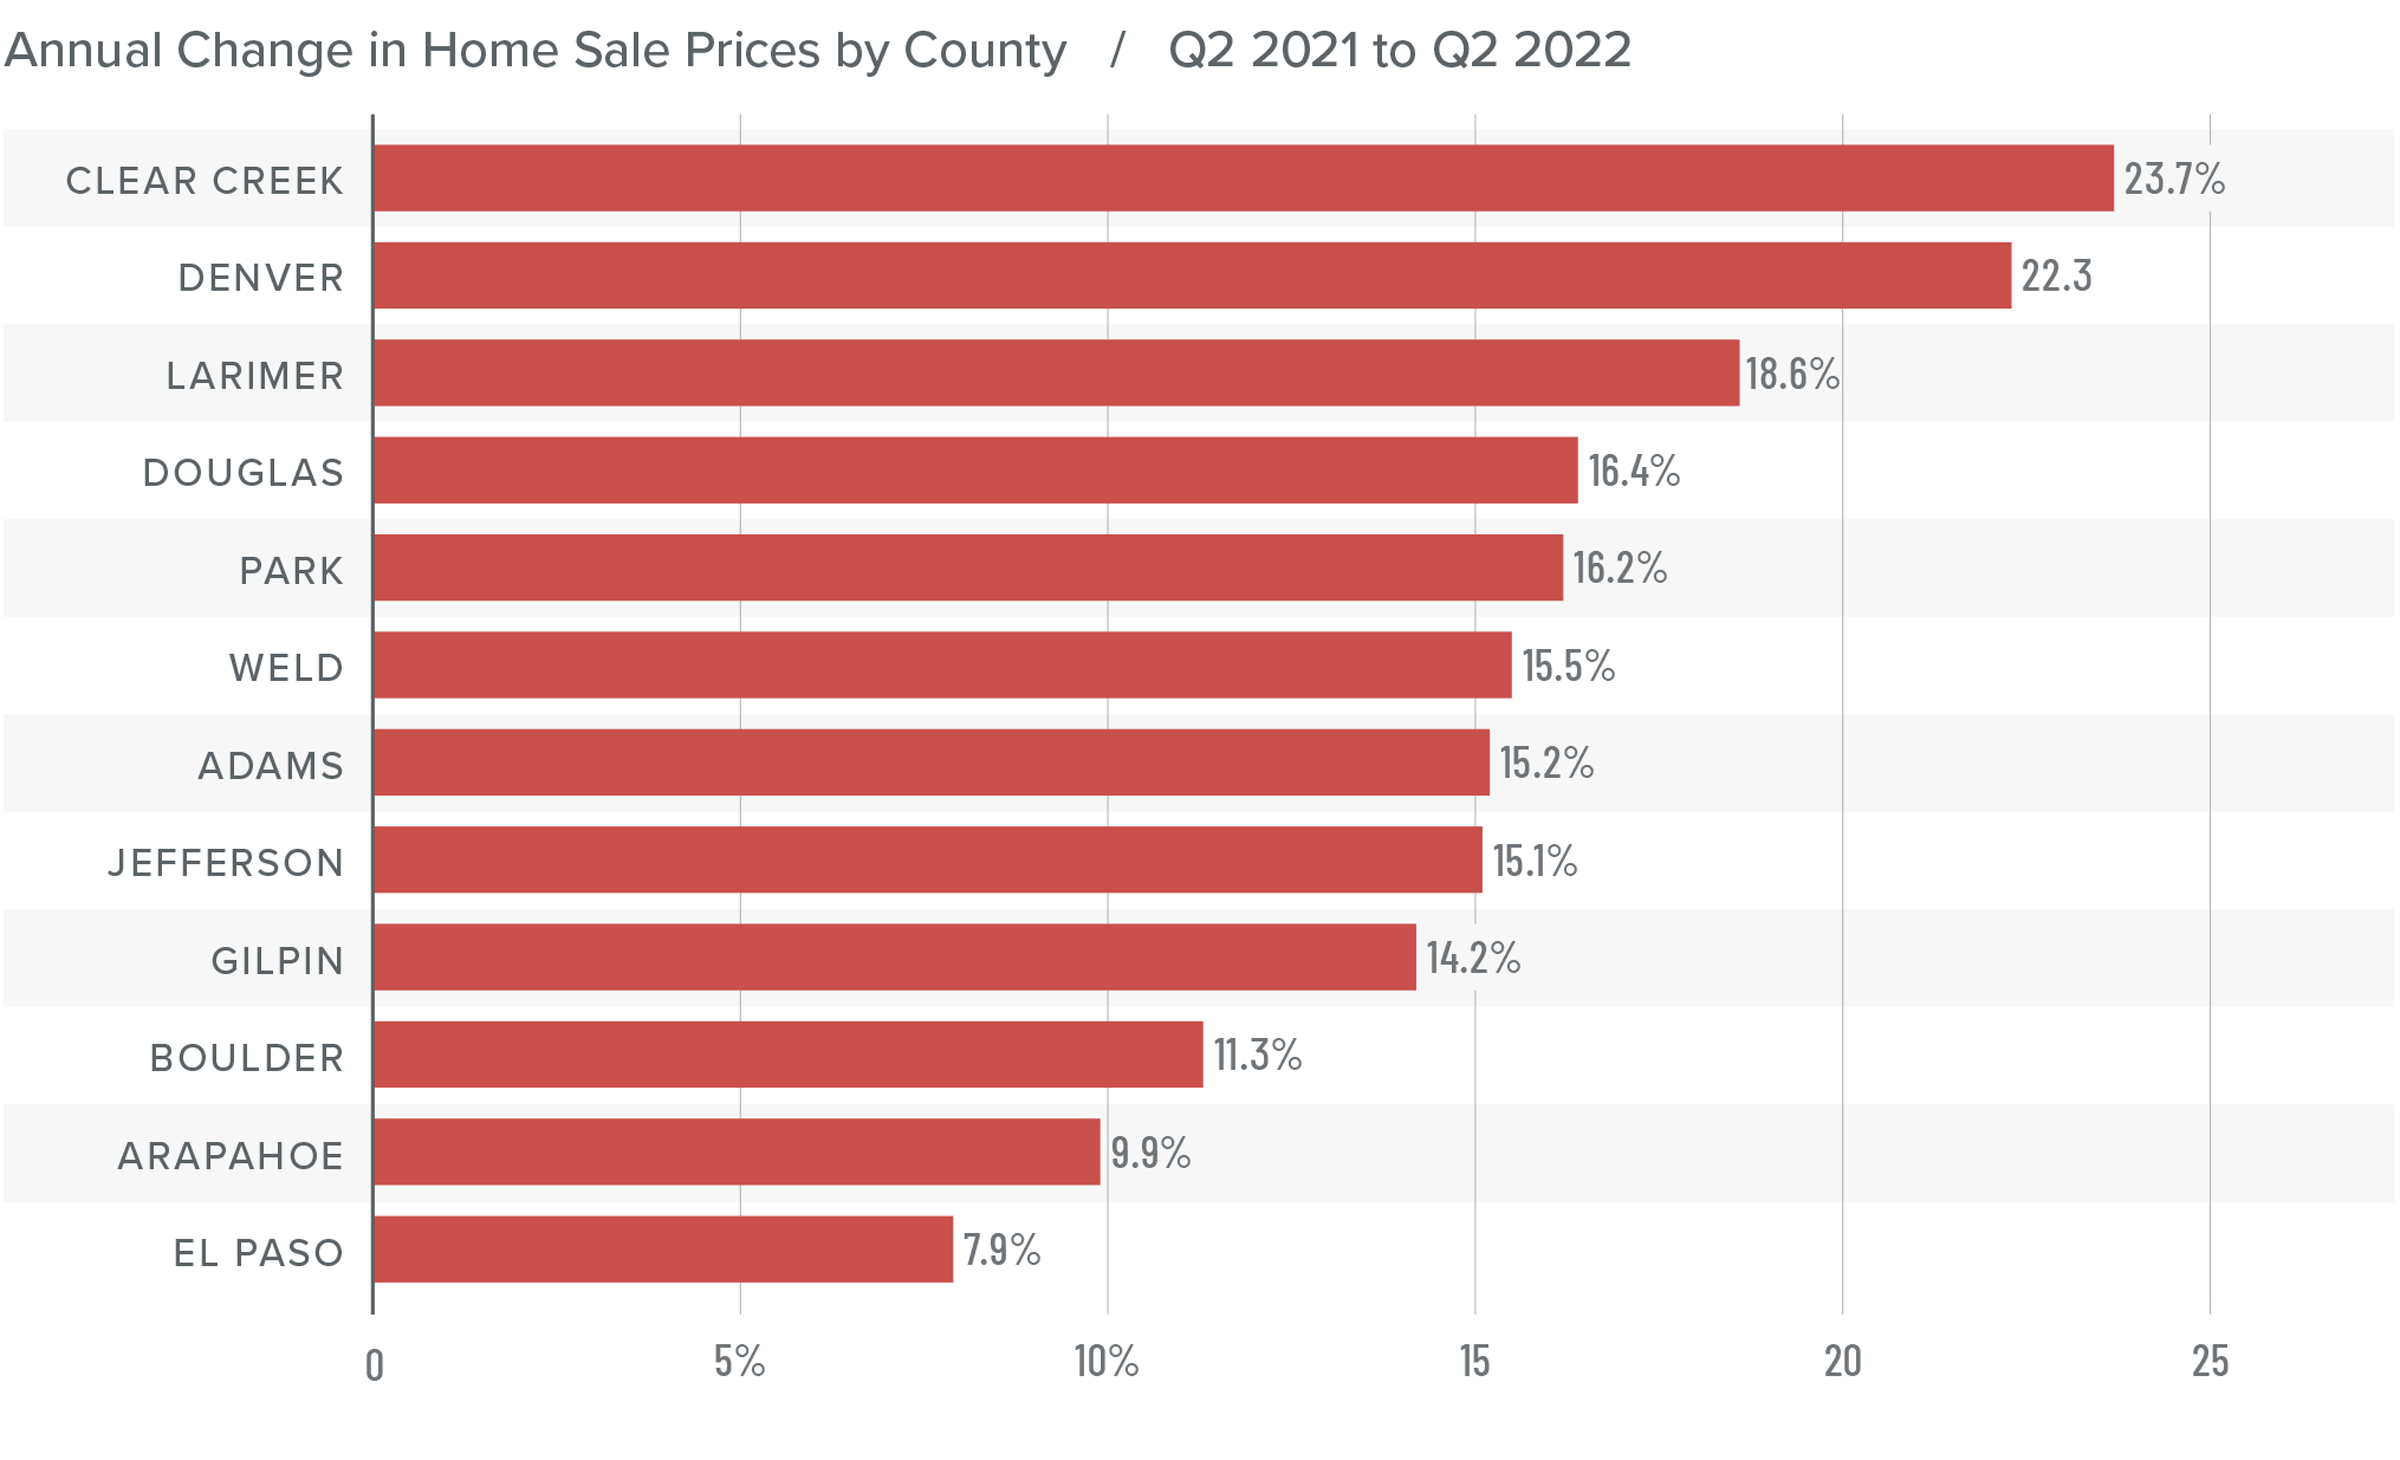
❱ The average home sale price ($700,369) was 14.1% higher than the same period in 2021. Prices were also 9.8% higher than in the first quarter of this year.
❱ Price growth remains strong even in the face of significantly higher inventory levels and mortgage rates, which is an impressive achievement.
❱ Year over year, prices rose by double digits across all markets except El Paso and Arapahoe counties. Prices rose in all counties other than Gilpin (-10.3%) and Clear Creek (-1%) from the first quarter.
❱ With the increase in mortgage rates and the number of homes for sale, I have started to watch list prices more closely. Compared to the first quarter, median list prices are lower in 9 of the 12 counties included in this report. Although it’s too early to say whether this is a trend we should be worried about, I will be watching how prices move during the summer, as it may be an indicator that the market is starting to soften.
Mortgage Rates
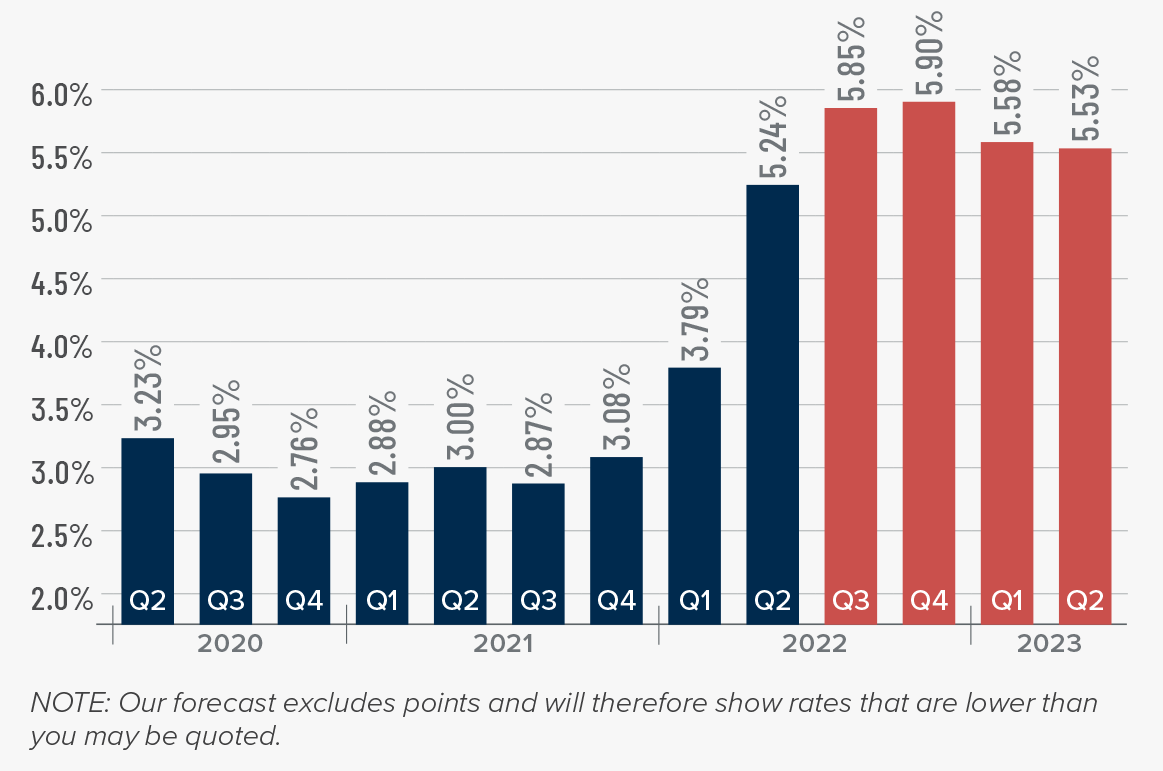
Although mortgage rates did drop in June, the quarterly trend was still moving higher. Inflation—the bane of bonds and, therefore, mortgage rates—has yet to slow, which is putting upward pressure on financing costs.
That said, there are some signs that inflation is starting to soften and if this starts to show in upcoming Consumer Price Index numbers then rates will likely find a ceiling. I am hopeful this will be the case at some point in the third quarter, which is reflected in my forecast.
Colorado Days on Market
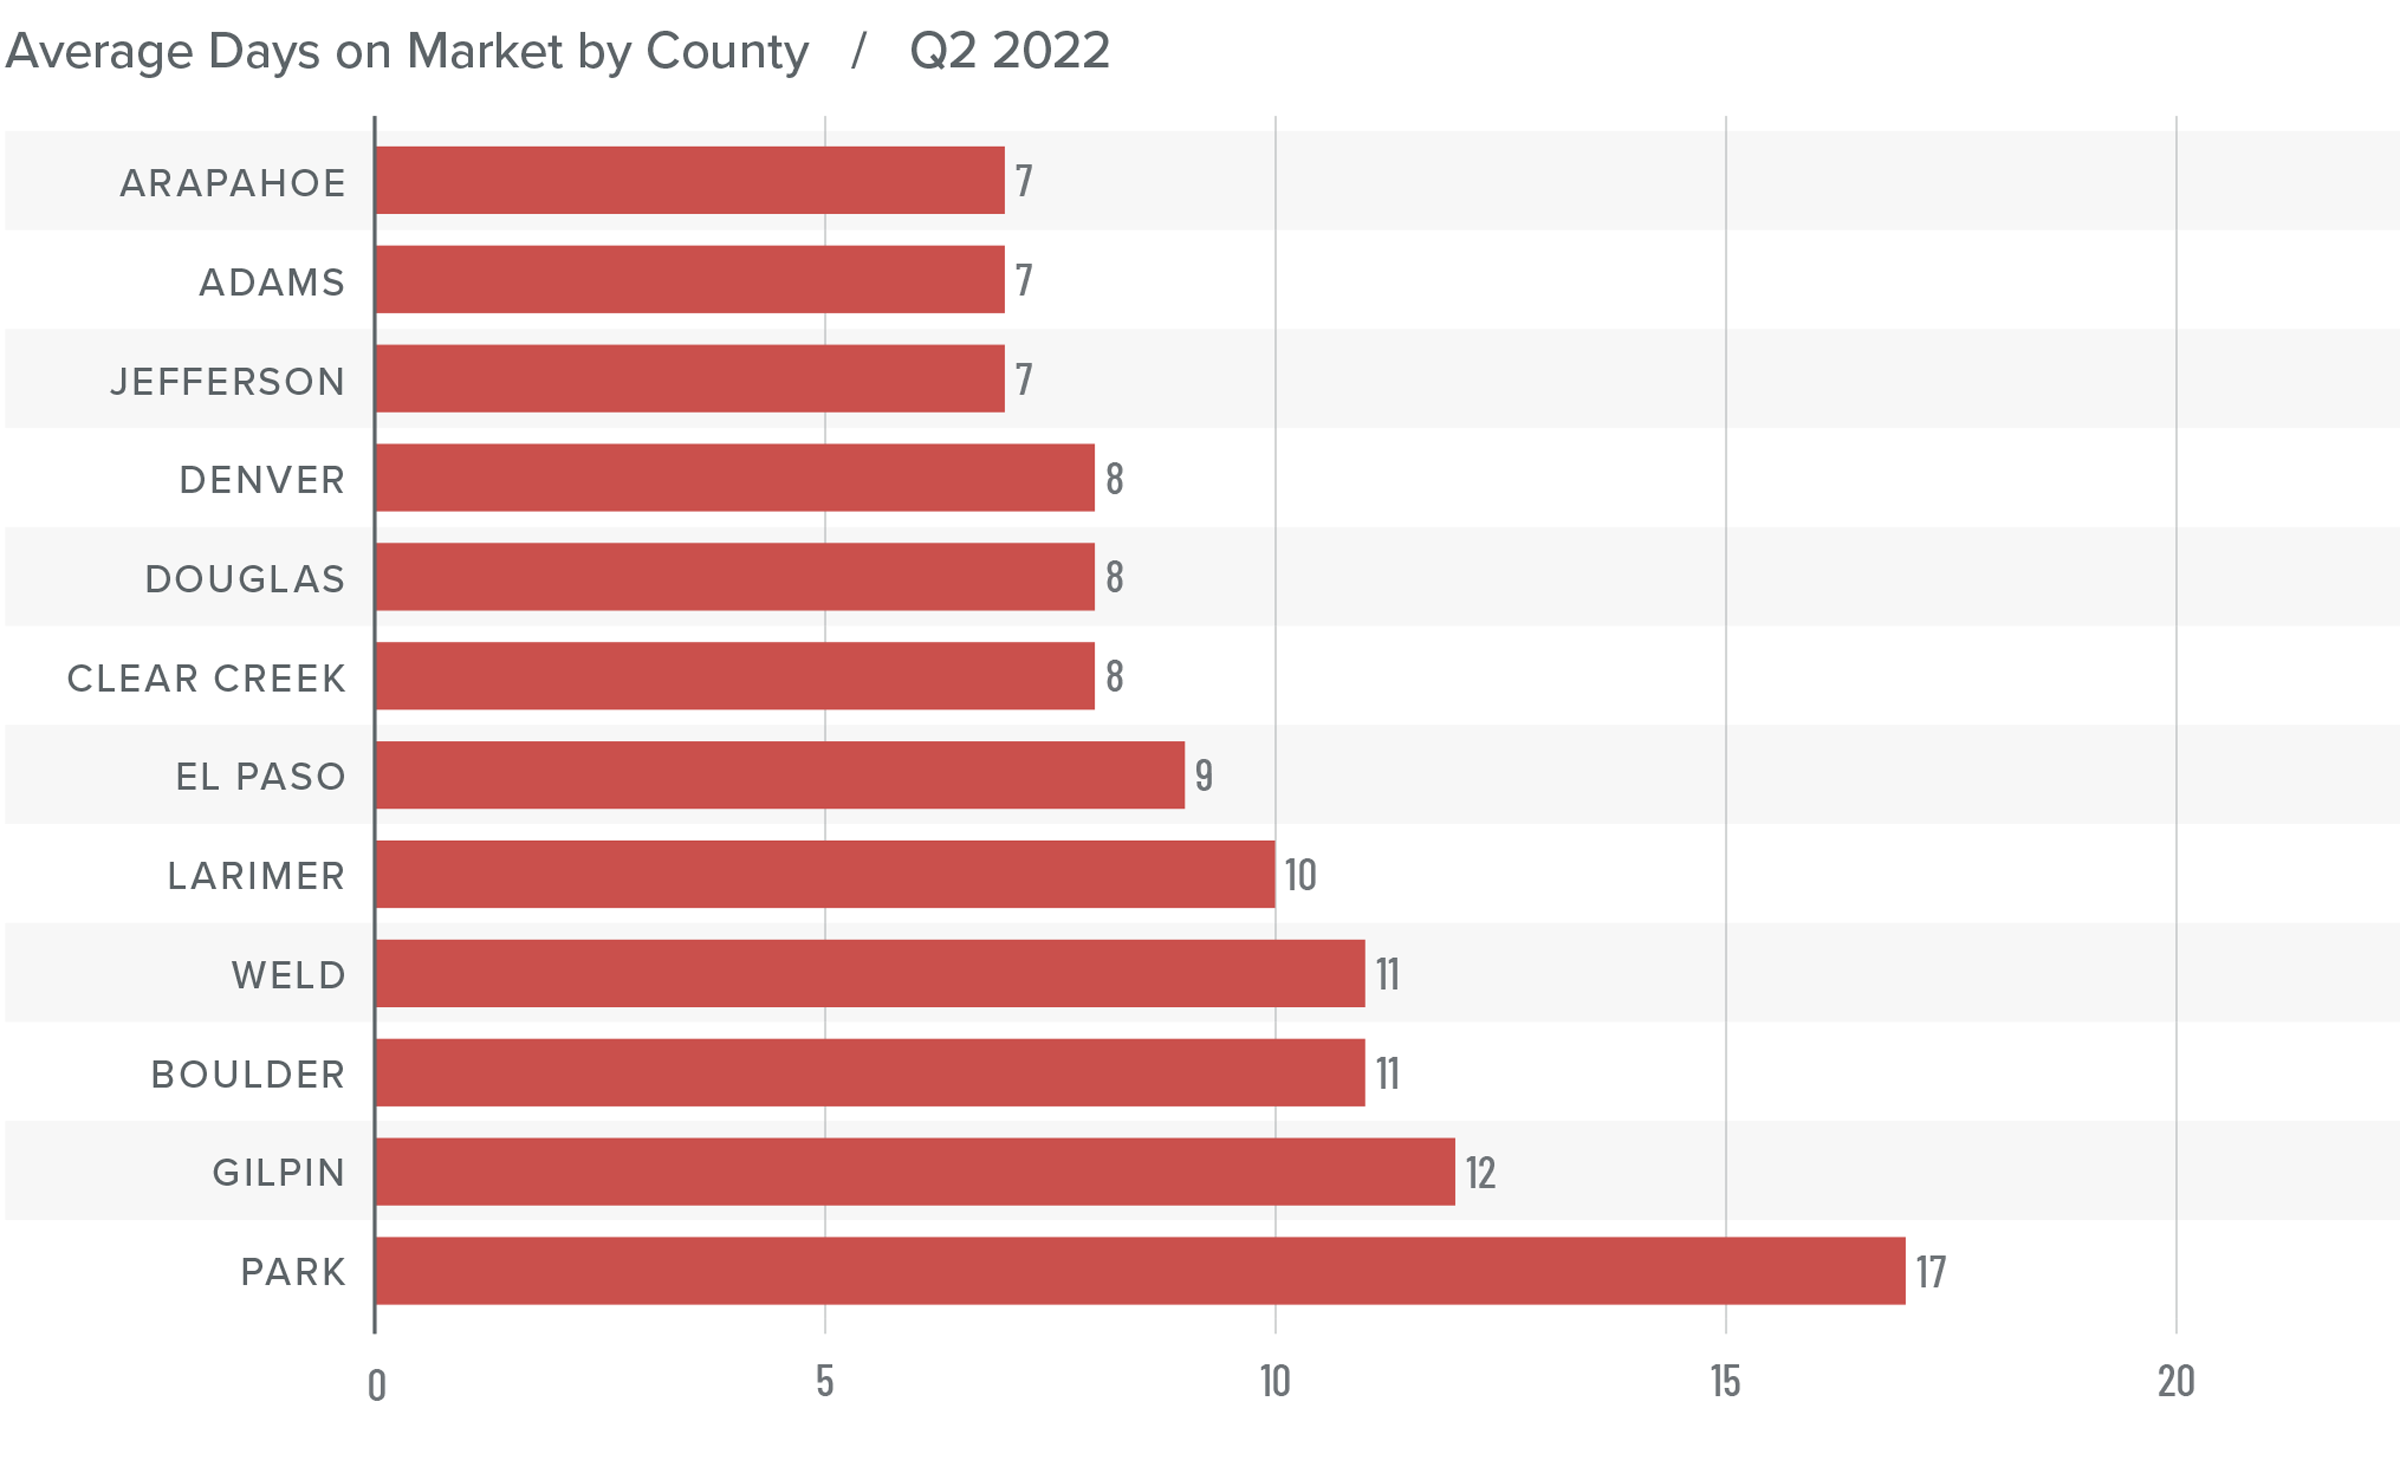
❱ The average time it took to sell a home in the markets contained in this report fell eight days compared to the same period in 2021.
❱ The length of time it took to sell a home dropped in six counties, remained static in three, and rose in the other three compared to the same quarter a year ago.
❱ It took an average of only 10 days to sell a home in the region, which is down 15 days compared to the first quarter of the year.
❱ Compared to the first quarter of 2022, average market time fell across the board, with significant drops in Gilpin (-41 days), Park (-25 days), and Clear Creek (-23 days) counties.
Conclusions
This speedometer reflects the state of the region’s real estate market using housing inventory, price gains, home sales, interest rates, and larger economic factors.
The Colorado economy remains robust and continues to grow. As it stands today, I anticipate income growth here will continue to outpace the nation. The 221,000 current job openings in the state are evidence of significant employer demand, which will lead to higher wages. Housing demand is still remarkably strong, even in light of the rapid increase in the number of homes for sale and rising financing costs.

As mentioned earlier, I will be watching movement in list prices through the summer as they are a leading indicator in respect to the health of the market. Although we saw some softening in the pace of regional list price growth during second quarter and median list prices pulling back in some markets, it is too early to state that this is a pattern. As such, I am leaving the needle in the same position as the first quarter. The growing number of homes for sale and lower list prices in some markets should favor buyers, but this is offset for the time being by solid demand.
About Matthew Gardner
As Chief Economist for Windermere Real Estate, Matthew Gardner is responsible for analyzing and interpreting economic data and its impact on the real estate market on both a local and national level. Matthew has over 30 years of professional experience both in the U.S. and U.K.
In addition to his day-to-day responsibilities, Matthew sits on the Washington State Governors Council of Economic Advisors; chairs the Board of Trustees at the Washington Center for Real Estate Research at the University of Washington; and is an Advisory Board Member at the Runstad Center for Real Estate Studies at the University of Washington where he also lectures in real estate economics.
Q1 2022 Colorado Real Estate Market Update

The following analysis of select counties of the Colorado real estate market is provided by Windermere Real Estate Chief Economist Matthew Gardner. We hope that this information may assist you with making better-informed real estate decisions. For further information about the housing market in your area, please don’t hesitate to contact your Windermere Real Estate agent.
Regional Economic Overview
The most recent jobs data showed that by February of this year Colorado had recouped all of the more than 375,000 jobs that were shed due to the pandemic and had added an additional 6,000 positions. The recovery in employment was faster than I had expected, which has led me to revise my 2022 forecast: I now predict that the Colorado job market will increase by 4% this year and will add more than 112,000 new jobs. The state unemployment rate in February was 4%, which is well below the pandemic peak of 11.8% but still above the 2.6% average in 2019. Regionally, unemployment rates ranged from a low of 3.1% in Boulder to a high of 4% in the Colorado Springs and Greeley metropolitan areas.
Colorado Home Sales
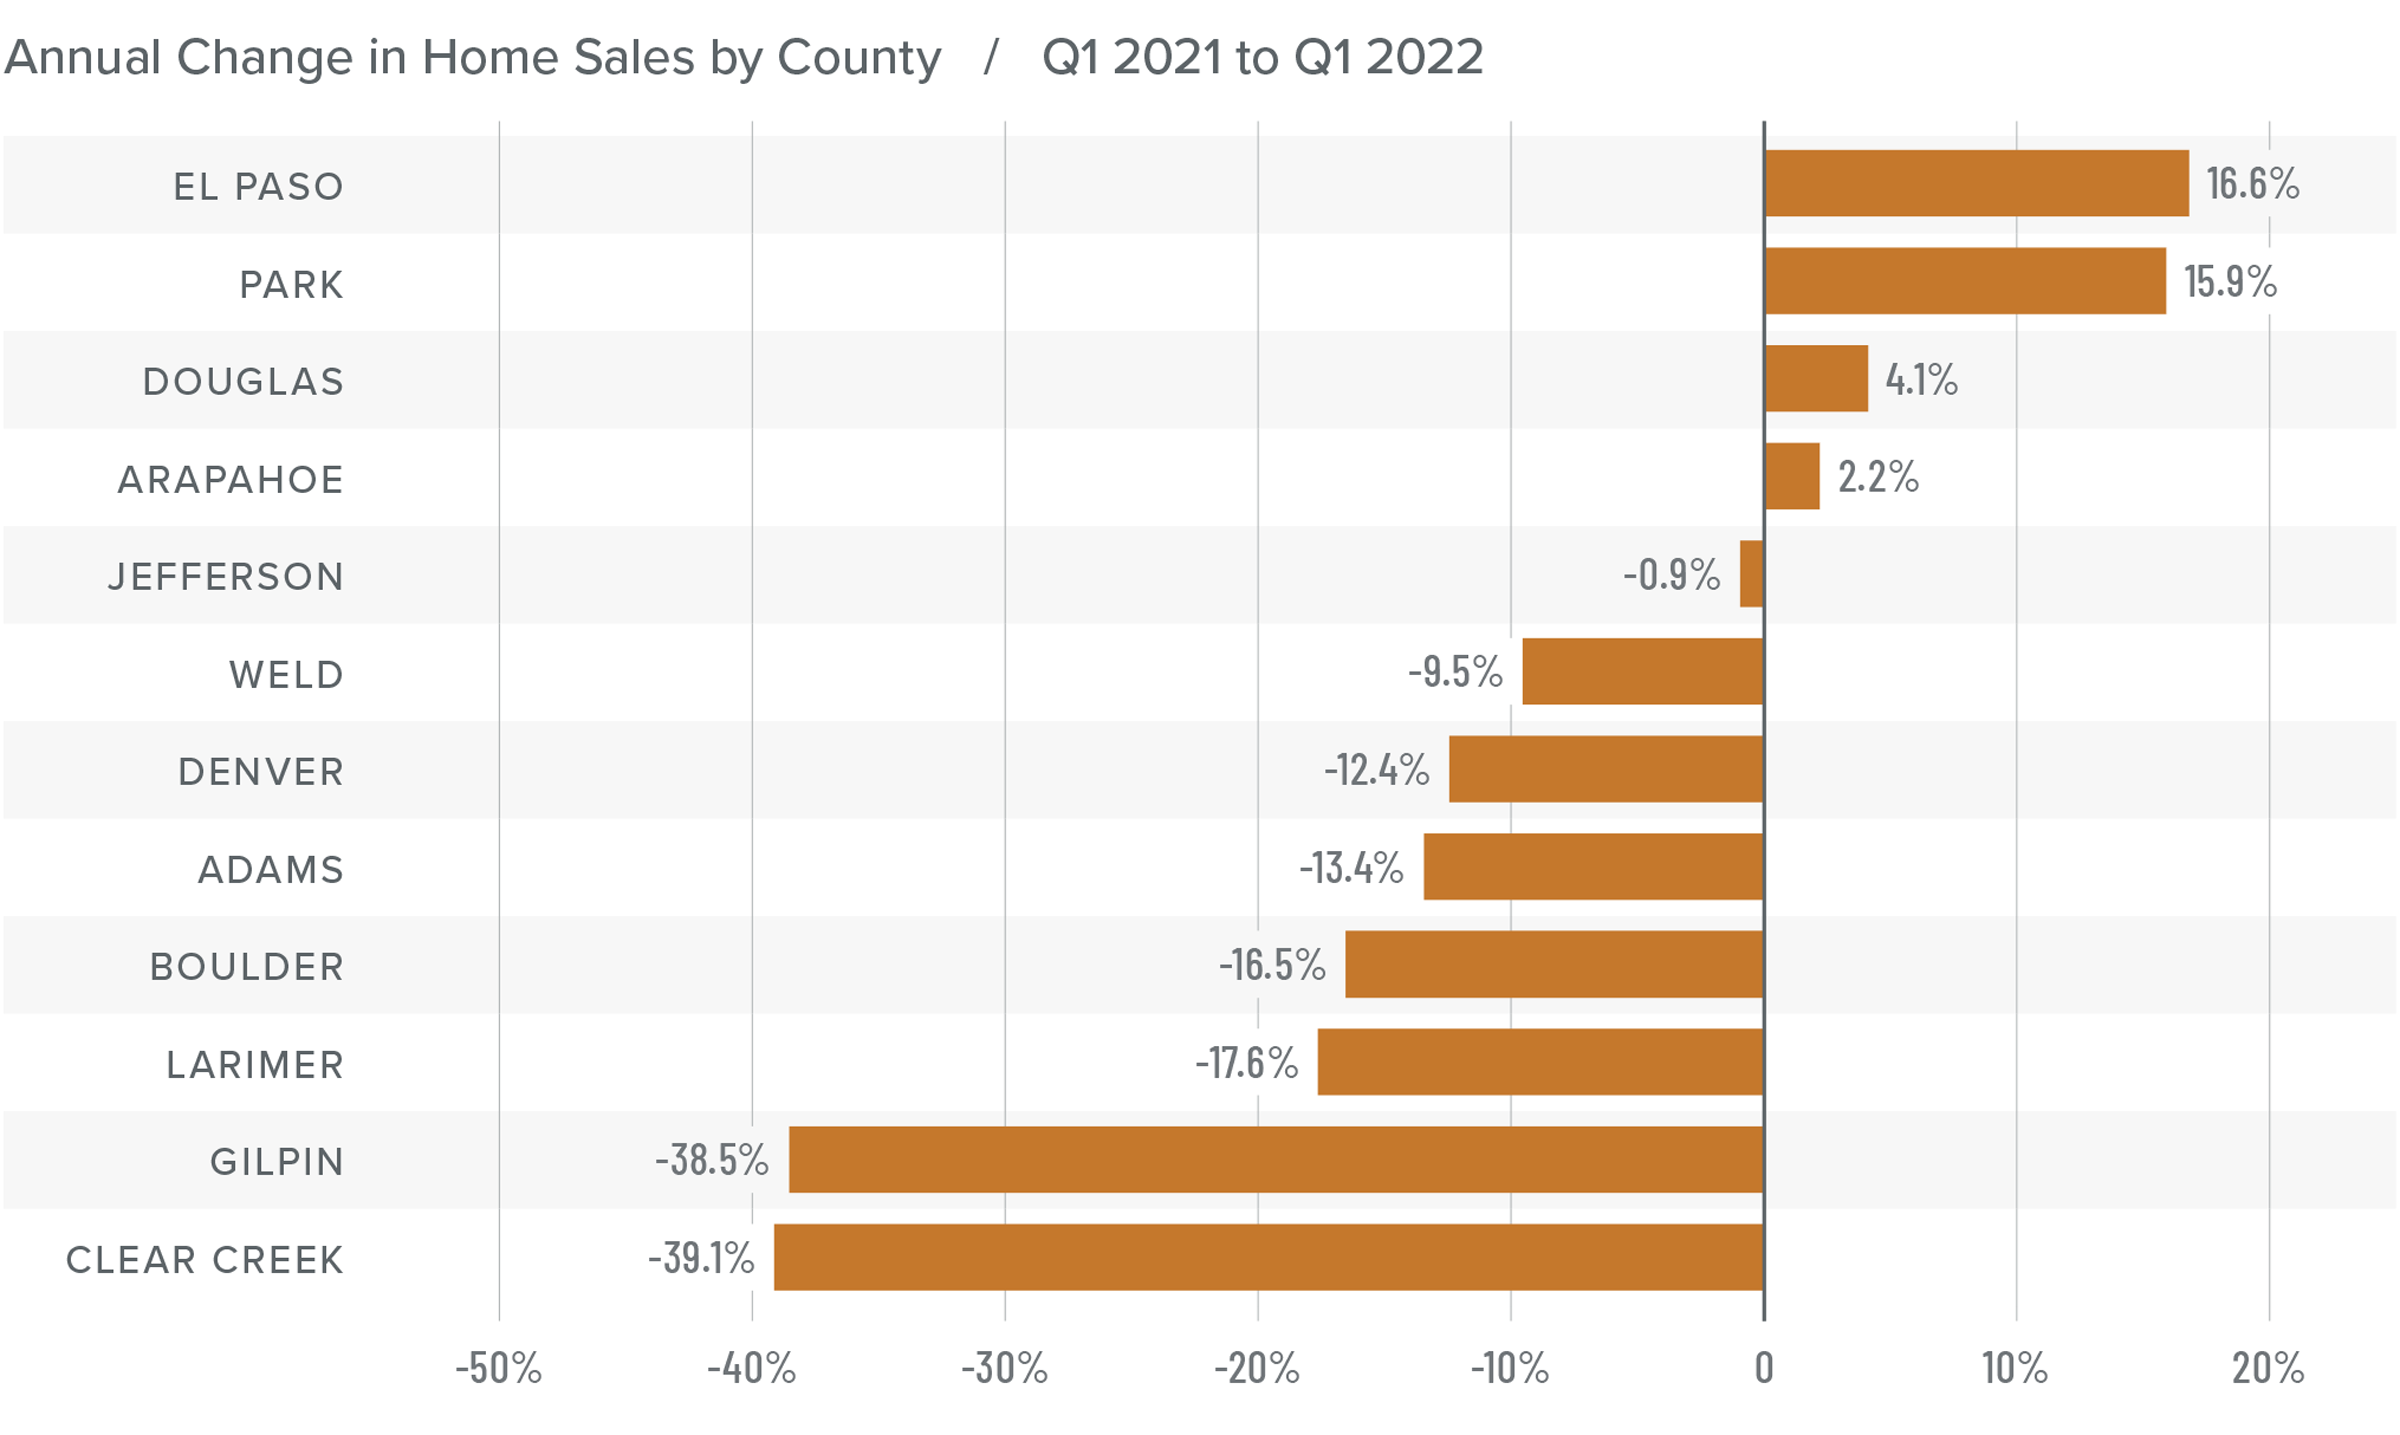
❱ In the first quarter of the year, 8,178 homes sold, representing a drop of 6.3% compared to the same period a year ago and 30% lower than in the fourth quarter of 2021.
❱ Sales increased in 4 of the 12 counties covered by this report but fell in the balance of the market areas.
❱ Similar to last quarter, low inventory levels continue to constrict sales. Listing activity was 17.3% lower than the same period in 2021 and 29.5% lower than in the fourth quarter of 2021.
❱ Pending sales, which are an indicator of future closings, also declined, though the drop of 4.3% is not that significant. That said, unless we see a surge in inventory levels in the spring, second quarter sales may also be light.
Colorado Home Prices
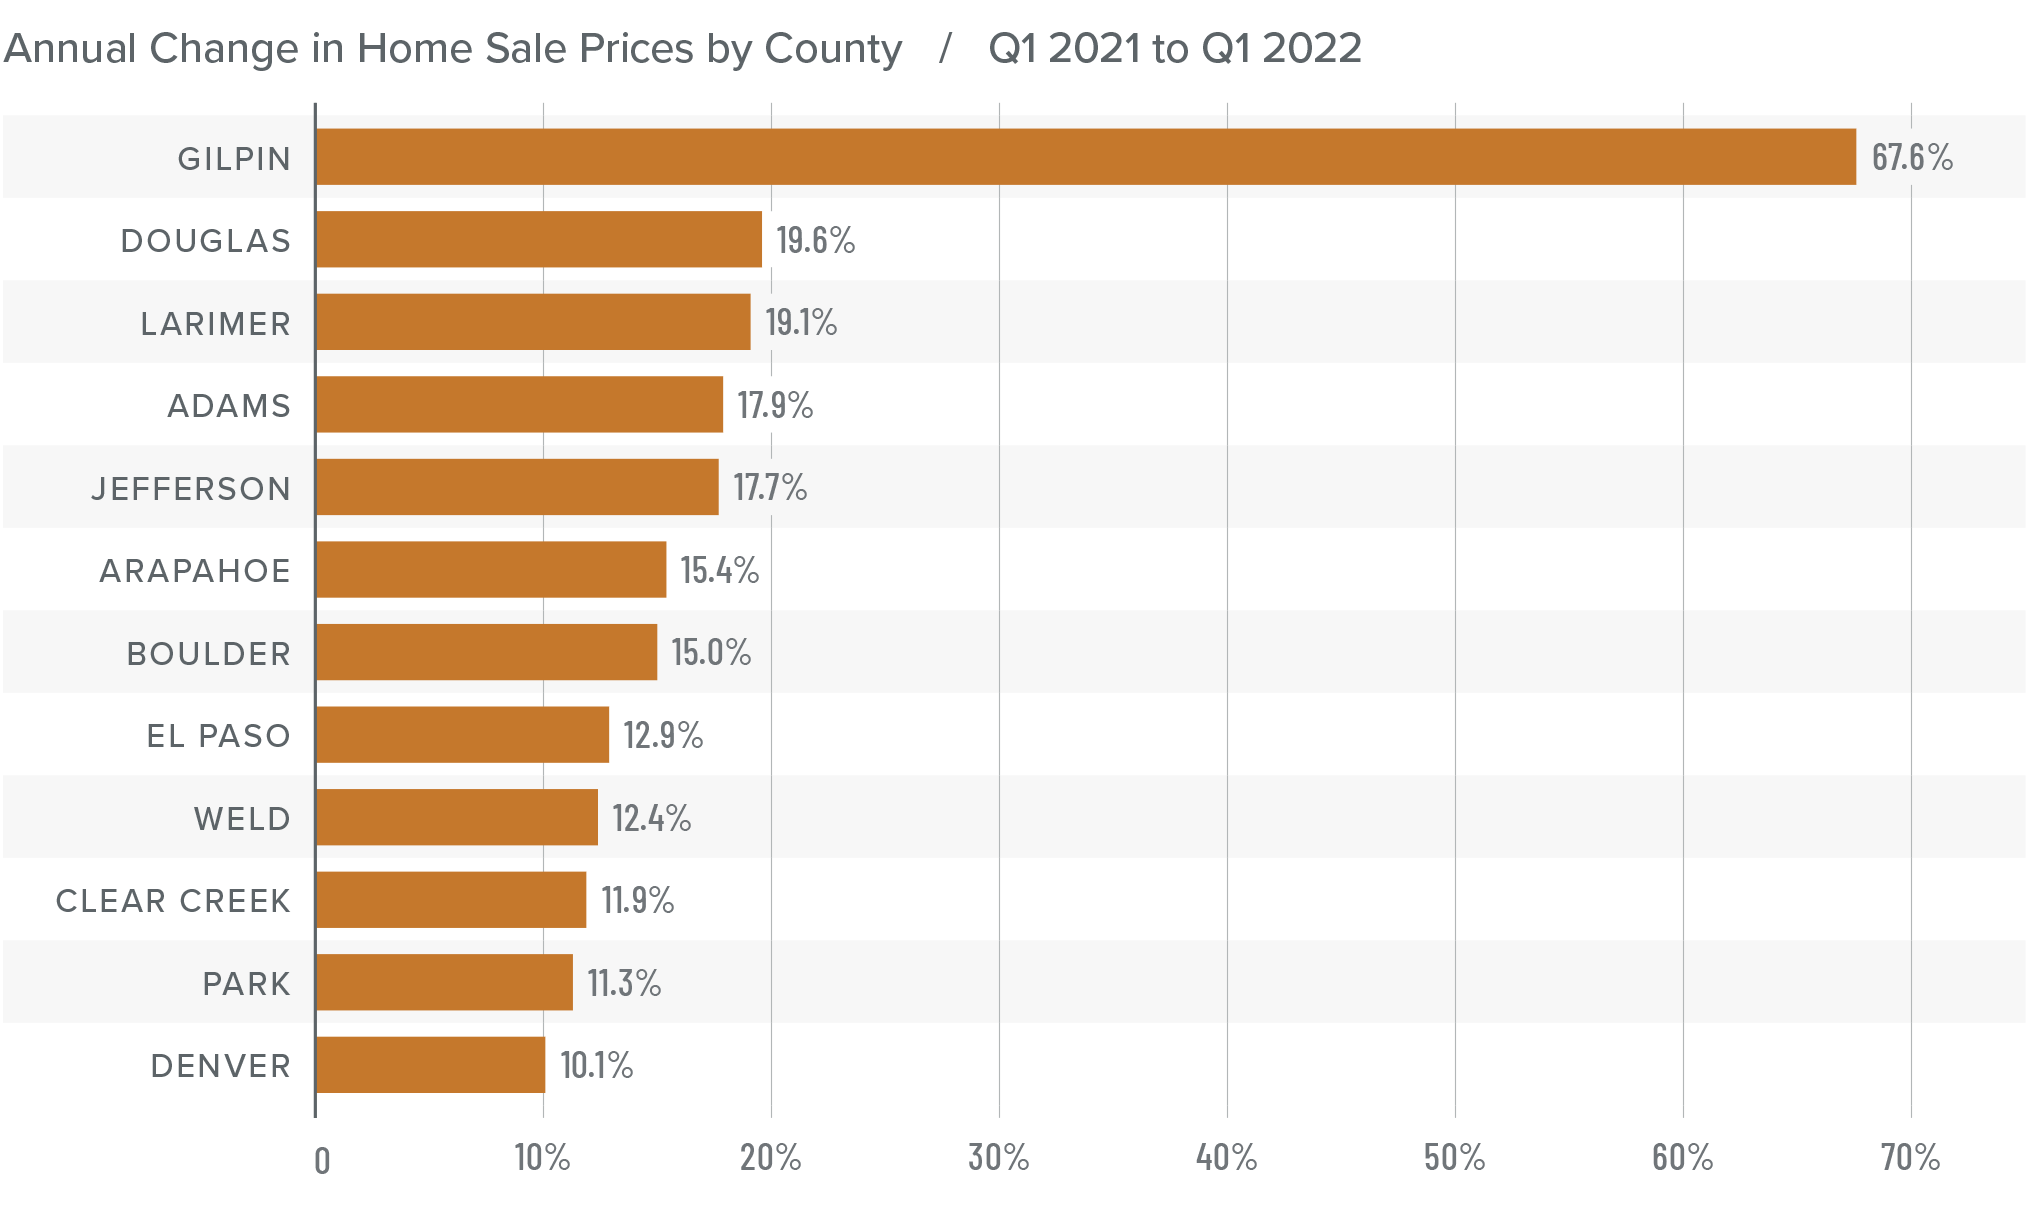
❱ With limited inventory and rising mortgage rates, buyers were motivated, as demonstrated by the 14.9% increase in average prices compared to a year ago. Home prices in first quarter averaged $637,963, which is 4.5% higher than last quarter.
❱ Boulder County continues to see average sale prices holding above $1 million. Although we have seen some softening in list prices, I expect this market to remain above the $1 million mark as we move through the year.
❱ Year over year, prices rose by double-digits across all markets covered by this report, with a huge jump in the small Gilpin market.
❱ With little in the way of choice for buyers—as well as a “fear of missing out” given rising mortgage rates—it’s no surprise there was such solid price appreciation. That said, there is normally a lag between rising rates and any impact on home prices. The second quarter should indicate if the jump in rates has had a softening effect on price growth.
Mortgage Rates
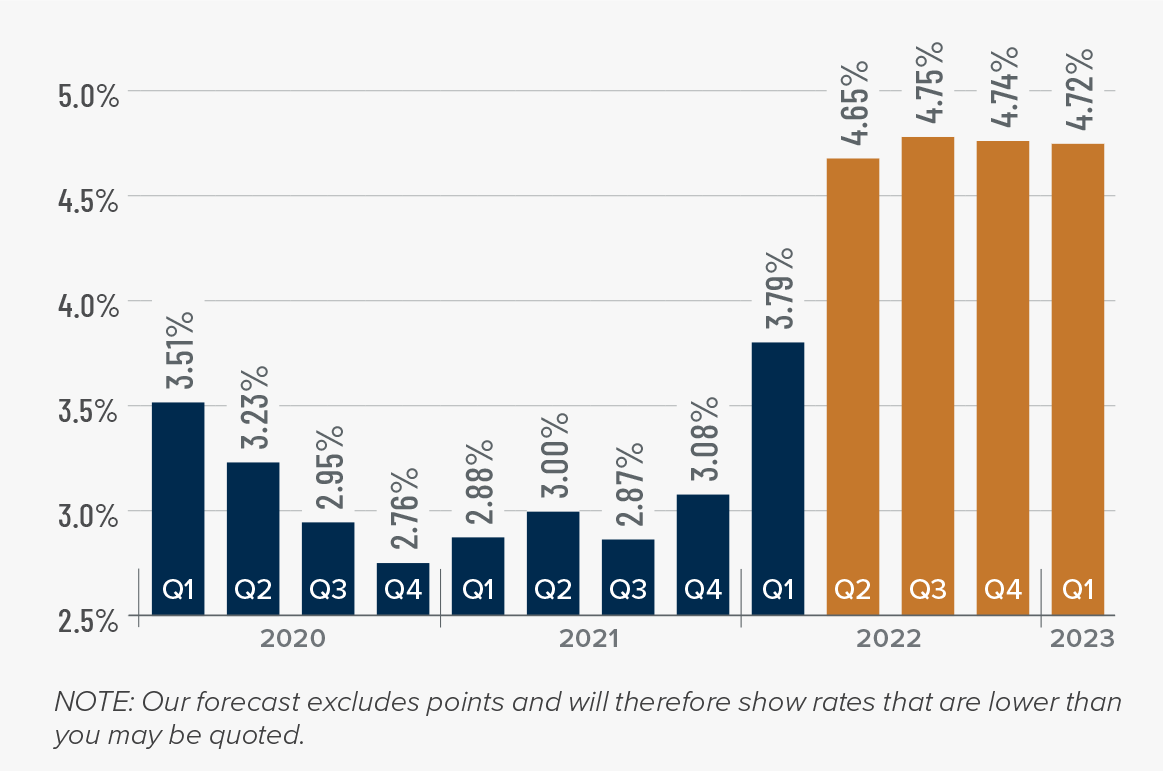
Average rates for a 30-year conforming mortgage were 3.11% at the end of 2021, but since then have jumped over 1.5%—the largest increase since 1987. The speed of the surge in rates is due to the market having quickly priced in the seven-to-eight rate increase that the Fed is expected to implement this year.
Because the mortgage market has priced this into the rates they are offering today, my forecast suggests that we are getting close to a ceiling in rates, and it is my belief that they will rise modestly in the second quarter before stabilizing for the balance of the year.
Colorado Days on Market
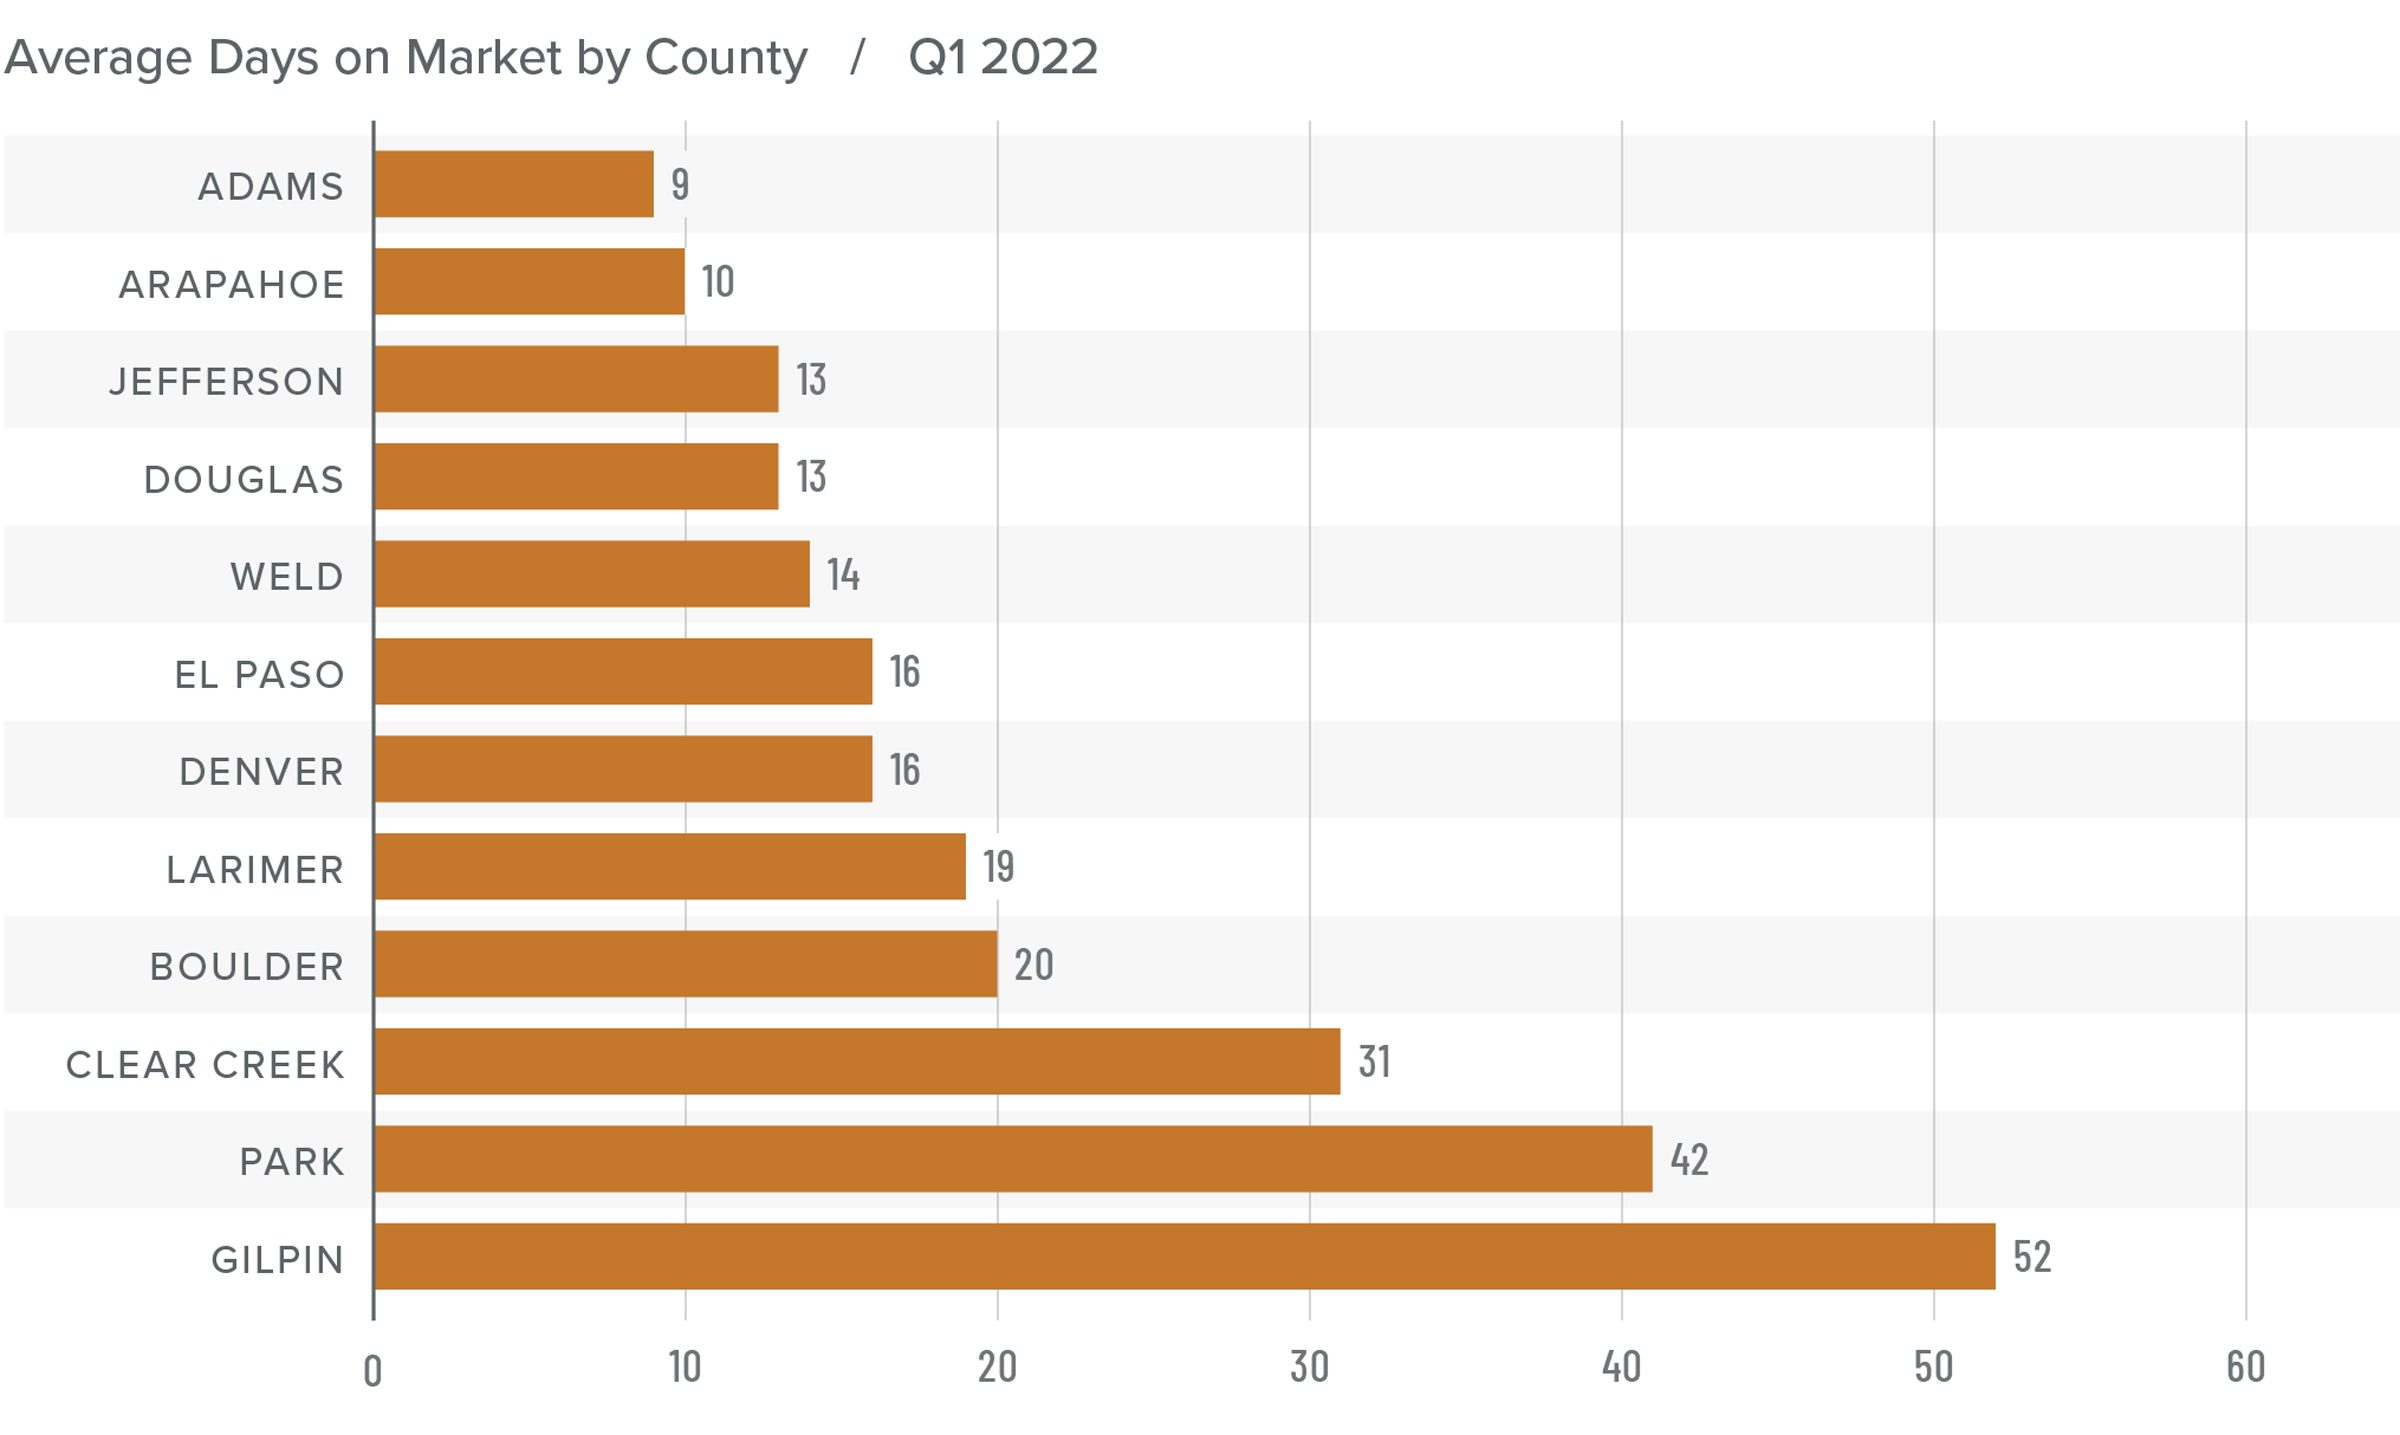
❱ The average number of days it took to sell a home in the markets contained in this report fell four days compared to the first quarter of 2021.
❱ The length of time it took to sell a home dropped in every county other than Gilpin compared to the same quarter a year ago.
❱ It took an average of only 21 days to sell a home in the region, matching the previous quarter.
❱ Compared to the final quarter of 2021, average market time fell in Clear Creek, Adams, Denver, Jefferson, and Arapahoe counties, but rose in the balance of the markets contained in this report.
Conclusions
This speedometer reflects the state of the region’s real estate market using housing inventory, price gains, home sales, interest rates, and larger economic factors.
With Colorado on solid economic footing, I expect housing demand to remain strong even in the face of rising financing costs. Inventory levels remain very low, and new home construction has not expanded enough to meet demand, which continues to put upward price pressure on resale homes. The market appears to have shrugged off the jump in mortgage rates in the first quarter, but the full effects won’t be felt until later this spring. We’ll have to wait and see what impact, if any, there will be, but data on listing prices shows that home sellers remain bullish.

Given all these factors, I am leaving the needle in the same position as last quarter. The market clearly still favors sellers, but we need a few more months of information to determine how rising mortgage rates may impact home sales and/ or prices.
About Matthew Gardner
As Chief Economist for Windermere Real Estate, Matthew Gardner is responsible for analyzing and interpreting economic data and its impact on the real estate market on both a local and national level. Matthew has over 30 years of professional experience both in the U.S. and U.K.
In addition to his day-to-day responsibilities, Matthew sits on the Washington State Governors Council of Economic Advisors; chairs the Board of Trustees at the Washington Center for Real Estate Research at the University of Washington; and is an Advisory Board Member at the Runstad Center for Real Estate Studies at the University of Washington where he also lectures in real estate economics.
Q4 2021 Colorado Real Estate Market Update

The following analysis of the Metro Denver & Northern Colorado real estate market is provided by Windermere Real Estate Chief Economist Matthew Gardner. We hope that this information may assist you with making better-informed real estate decisions. For further information about the housing market in your area, please don’t hesitate to contact your Windermere Real Estate agent.
Regional Economic Overview
Following a decent summer when Colorado added around 14,000 jobs each month, the pace of recovery has slowed. That said, the latest data shows that more than 320,000 of the 376,000 jobs shed due to the pandemic have now returned. The state still needs to add a little more than 54,000 jobs in order to get back to pre-pandemic employment levels. Even though there has been a slowdown in the job recovery, which is likely due to the rise of new COVID-19 variants, I am still forecasting the state will return to its prior employment peak by the end of the summer. As jobs return, the employment rate continues to drop; it was 5.1% in November, well below the pandemic peak of 12.1%. Although it would be nice to see a lower rate, more people have returned to the workforce and are actively looking for work, which can stall job growth rates. From a regional perspective, unemployment levels range from a low of 3.8% in Boulder, to a high of 5.2% in Grand Junction.
colorado Home Sales
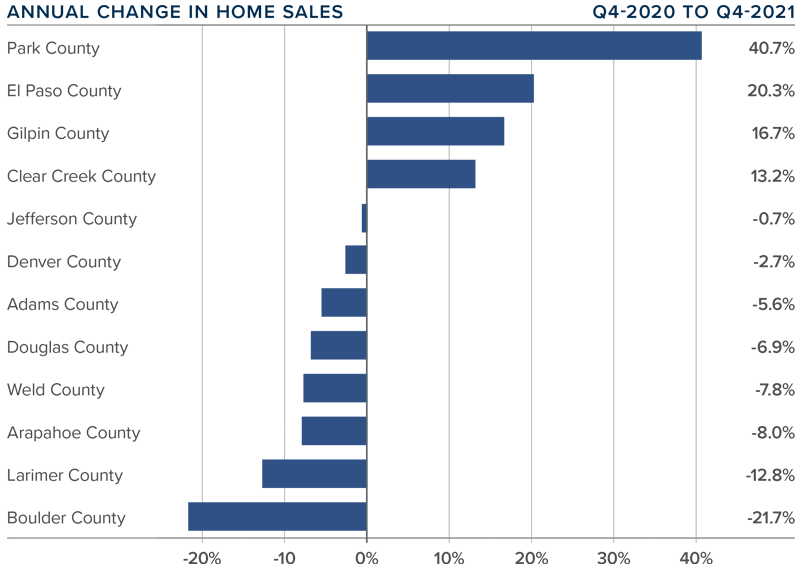
❱ In the final quarter of the year, 11,714 homes sold, representing a drop of 5.3% compared to the fourth quarter of 2020 and a drop of 17.6% compared to the third quarter of the year.
❱ While sales slowed region-wide, 4 of the 12 counties included in this report actually experienced significant sales increases.
❱ I’m not concerned that sales slowed compared to third quarter, as seasonal factors were likely the cause. It’s also likely that the year-over-year decline was due to the fact that there were 30% fewer homes for sale in the fourth quarter of 2021 than there were the previous year.
❱ Pending sales, which are an indicator of future closings, fell 29% compared to the third quarter, suggesting that closings in the first quarter of 2022 may also be light.
colorado Home Prices

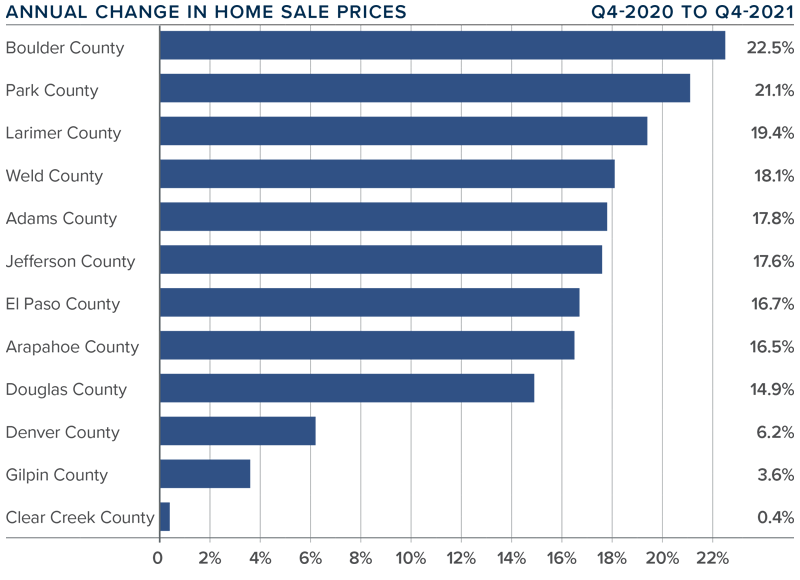
❱ The pace of home-price growth continued to slow, albeit modestly. The average sale price rose 14.8% year over year, to an average of $610,275. Prices also rose .8% from the previous quarter.
❱ Boulder County’s price growth was noteworthy, but of even greater interest was that average sale prices are holding above the $1 million ceiling.
❱ Year-over-year, prices rose across all markets covered by this report, with double-digit gains in all but three counties.
❱ The number of homes for sale remains woefully low in most areas, which continues to put upward pressure on home prices. That said, the pace of appreciation slowed through most of 2021. This trend is likely to continue in 2022.
Days on Market
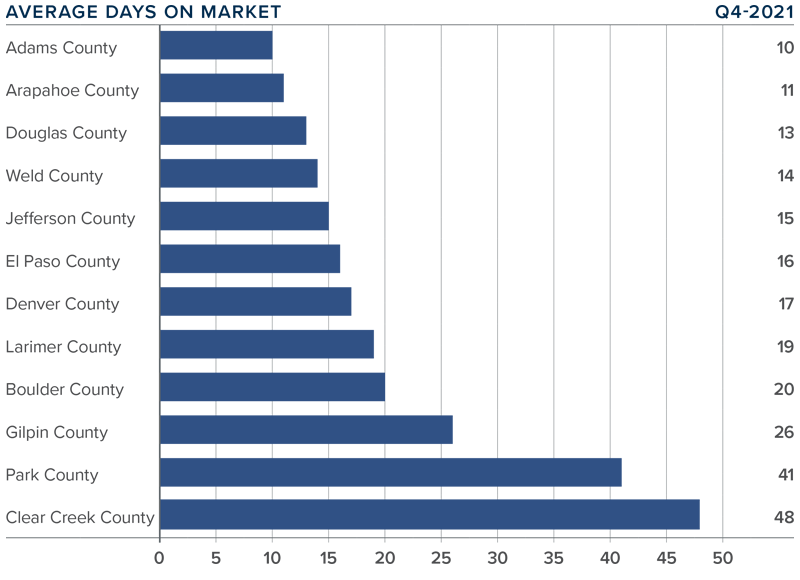
❱ The average number of days it took to sell a home in the markets contained in this report fell five days compared to the final quarter of 2020.
❱ The length of time it took to sell a home dropped in every county other than Clear Creek County compared to the same quarter a year ago.
❱ It took an average of only 21 days to sell a home in the region. Although the pace dropped year over year, it rose 9 days compared to the previous quarter.
❱ Ongoing supply limitations and strong demand have caused the pace of sales to remain brisk. That said, the length of time it took to sell a home rose compared to the third quarter. I don’t think this is a major concern and can likely be attributed to seasonal factors.
Conclusions

This speedometer reflects the state of the region’s real estate market using housing inventory, price gains, home sales, interest rates, and larger economic factors.
Inventory is still lacking, which is causing prices to rise at well-above-average rates. That said, despite how few homes are for sale, the pace of appreciation has been slowing and will likely continue to do so as mortgage rates climb.
My current forecast is for 30-year rates to stairstep higher as we move through the year, which will act as a headwind to price growth. Although I do not see rates getting above 4% until 2023, the increase in borrowing costs will start to have a greater impact on home prices.
In addition to rising mortgage rates, the significant growth in prices over the past year has started to impact housing affordability. Although the market will continue to perform well, rising financing costs and lower affordability may slowly move the market back toward some sort of balance.
All things considered, I am moving the needle a little toward buyers, but it still heavily favors home sellers.
About Matthew Gardner

As Chief Economist for Windermere Real Estate, Matthew Gardner is responsible for analyzing and interpreting economic data and its impact on the real estate market on both a local and national level. Matthew has over 30 years of professional experience both in the U.S. and U.K.
In addition to his day-to-day responsibilities, Matthew sits on the Washington State Governors Council of Economic Advisors; chairs the Board of Trustees at the Washington Center for Real Estate Research at the University of Washington; and is an Advisory Board Member at the Runstad Center for Real Estate Studies at the University of Washington where he also lectures in real estate economics.
Q3 2021 Colorado Real Estate Market Update

The following analysis of the Metro Denver & Northern Colorado real estate market is provided by Windermere Real Estate Chief Economist Matthew Gardner. We hope that this information may assist you with making better-informed real estate decisions. For further information about the housing market in your area, please don’t hesitate to contact your Windermere Real Estate agent.
Regional Economic Overview
The rise in COVID-19 infections due to the Delta variant caused Colorado’s job recovery to slow, but not as much as in many other states. The latest data (for August) shows that more than 293,000 of the 376,000+ jobs that were shed due to COVID-19 have returned. This is good news, with only 83,000 jobs needed to return to pre-pandemic employment levels. The metro areas contained in this report have recovered 243,700 of the 310,000 jobs lost, and I expect the state will recover the remaining jobs by next summer. With employment levels improving, the state unemployment rate currently stands at 5.9%—down from the pandemic peak of 12.1%. Regionally, unemployment levels range from a low of 4.4% in Boulder to a high of 6.1% in Grand Junction.
colorado Home Sales
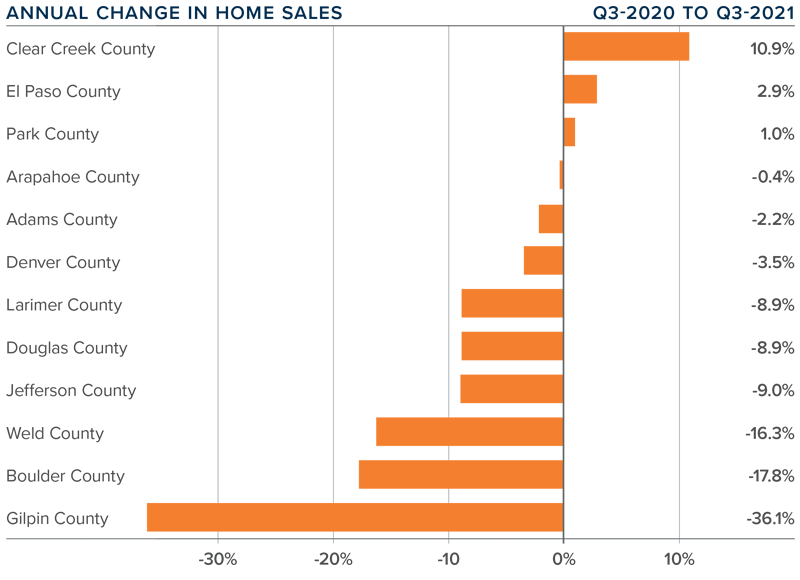
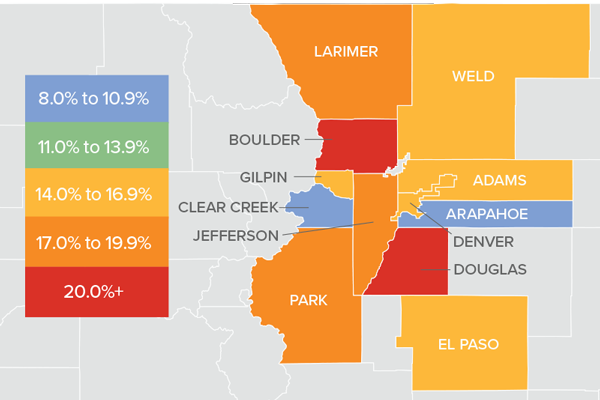
❱ In the third quarter, 14,209 homes sold. This was 6.8% lower than a year ago, but 5.8% higher than the second quarter of 2021.
❱ Compared to a year ago, listing activity was down more than 30%. However, inventory levels were up 38.3% compared to the second quarter of this year, suggesting that buyers have more choice now than they have seen in some time.
❱ Although comparing current sales activity with that of a year ago is not that informative—given that the country was experiencing a massive rebound in housing demand following the outbreak of COVID-19—it was pleasing to see sales up in every county other than Denver and Douglas compared to the second quarter of this year.
❱ Pending sales (an indicator of future closings) were down 5.4% compared to the second quarter of the year, suggesting that closings in the final quarter may well be a little soft.
colorado Home Prices
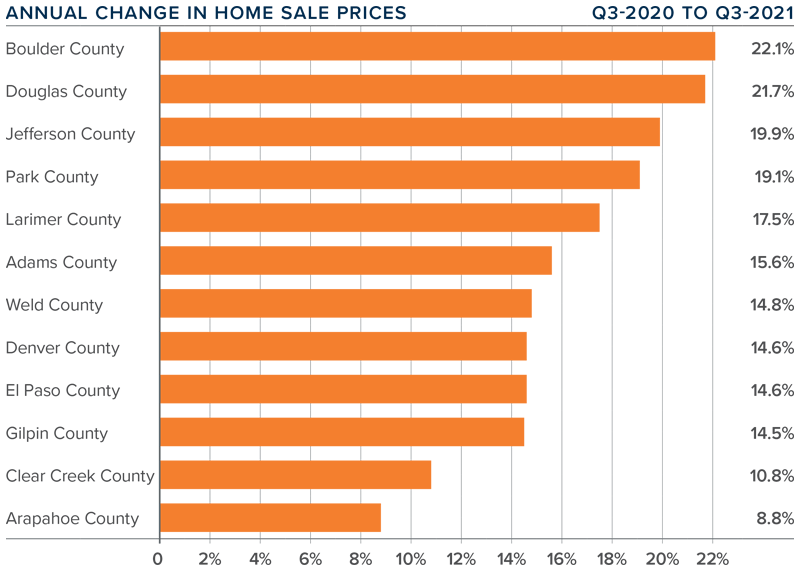
❱ Prices continue to appreciate at a very rapid pace, with the average sale price up 15.8% year over year to an average of $605,576. Sale prices were 1.6% lower than in the second quarter of 2021.
❱ Four counties—Arapahoe, Douglas, Weld, and Park—saw the average home sale price pull back between the second quarter and the third, but I am not overly concerned by this at the present time.
❱ Year-over-year, prices rose across all markets covered by this report. All counties except Arapahoe saw double-digit gains, but even that market saw an increase in sale prices.
❱ Several counties are experiencing a drop in average list prices, which is a leading indicator of future activity. As such, I expect to see the rise of sale prices start to slow, which will be a welcome sight for many buyers.
Days on Market
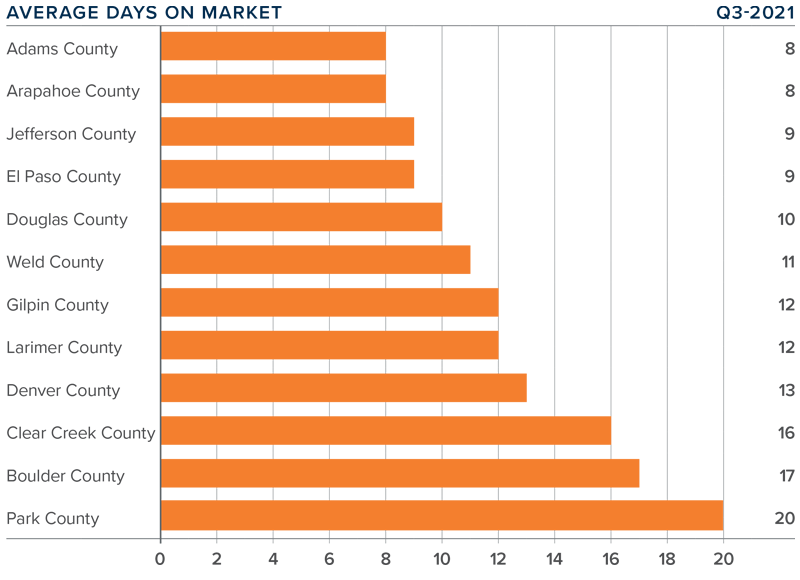
❱ The average number of days it took to sell a home in the markets contained in this report dropped 17 days compared to the third quarter of 2020.
❱ The length of time it took to sell a home dropped in every county contained in this report compared to both the same quarter a year ago and the second quarter of this year.
❱ It took an average of only 12 days to sell a home in the region, which is down 2 days compared to the second quarter of 2021.
❱ The Colorado housing market remains very tight as demonstrated by the fact that it took less than three weeks for homes to sell in all counties contained in this report.
Conclusions

This speedometer reflects the state of the region’s real estate market using housing inventory, price gains, home sales, interest rates, and larger economic factors.
The job market continues to improve, which is always a stimulant when it comes to home buying. Inventory levels have improved, and lower pending sales suggest that buyers are taking a little longer to decide on a home. That said, the market is still bullish as indicated by the short length of time it took to sell a home in the quarter. Mortgage rates will start to creep higher as we move into the winter months, and this may stimulate additional buying activity. In the last edition of The Gardner Report, I suggested we would see more homes come to market and that has proven to be accurate. Given these factors, I am moving the needle a little toward buyers, but it remains a staunchly seller’s market.
About Matthew Gardner
As Chief Economist for Windermere Real Estate, Matthew Gardner is responsible for analyzing and interpreting economic data and its impact on the real estate market on both a local and national level. Matthew has over 30 years of professional experience both in the U.S. and U.K.
In addition to his day-to-day responsibilities, Matthew sits on the Washington State Governors Council of Economic Advisors; chairs the Board of Trustees at the Washington Center for Real Estate Research at the University of Washington; and is an Advisory Board Member at the Runstad Center for Real Estate Studies at the University of Washington where he also lectures in real estate economics.
Q2 2021 Colorado Real Estate Market Update

The following analysis of the Metro Denver & Northern Colorado real estate market is provided by Windermere Real Estate Chief Economist Matthew Gardner. We hope that this information may assist you with making better-informed real estate decisions. For further information about the housing market in your area, please don’t hesitate to contact your Windermere Real Estate agent.
Regional Economic Overview
Although the post COVID-19 job recovery took a step backward last winter, it has since picked up again, which is very pleasing to see. At the end of the second quarter, the state had recovered more than 276,000 of the 376,000+ jobs that were shed due to COVID-19. Even though employment levels are still almost 100,000 lower than the pre-pandemic peak, they are heading in the right direction. Looking at the markets contained in this report, current employment levels in Colorado Springs are only 2.2% below the pre-pandemic peak, followed by Denver and Fort Collins, which are both down 3.6% from the 2020 peak. I would add that all markets showed jobs continuing to return. With total employment levels rising, the unemployment rate stands at 6.2%, down from the pandemic peak of 12.1%. Regionally, unemployment levels range from a low of 4.8% in Boulder to a high of 6.3% in Grand Junction. COVID-19 infection rates dropped during the quarter, which is certain to lead to employment levels continuing to rise unless we see another significant increase in infection rates due to the rise of new variants across the country.
colorado Home Sales
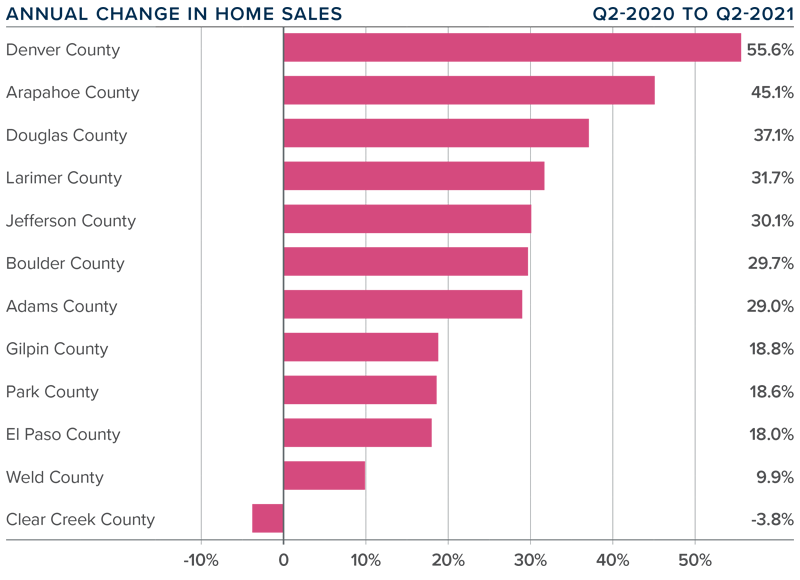
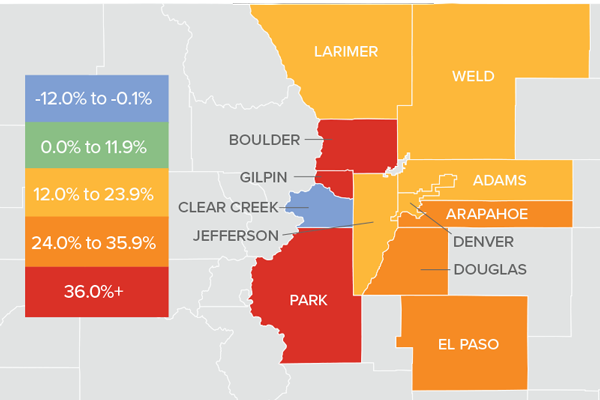
❱ The late spring/early summer market was a good one for home sales, which were up 33.9% from a year ago. Comparing the current quarter to a period when COVID-19 was widespread is not that informative, but, with sales up more than 55% from the first quarter of this year, the market appears to be very buoyant.
❱ Sales were higher in all counties other than the very small Clear Creek County. Where sales rose, they did so at double-digit rates in all markets other than Weld.
❱ During the second quarter, 13,428 homes sold. This is very impressive but not overly surprising, given that the average number of homes for sale was up 45% from the first quarter.
❱ Another positive was that pending sales, which are an indicator of future closings, were 42.8% higher than in the first quarter. This suggests that closings next quarter should be positive as well.
colorado Home Prices
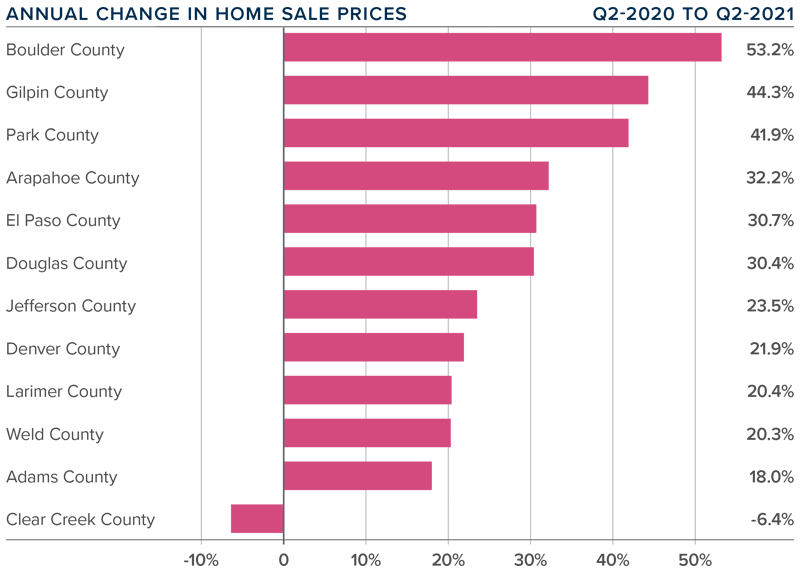
❱ Prices continue to appreciate at an impressive pace, recording an increase of 28.1% year over year to an average of $615,409. Home prices were also 10.7% higher than the first quarter of this year.
❱ Buyer demand remains very strong, likely exacerbated by the drop in mortgage rates in the second quarter and improving levels of inventory.
❱ Year-over-year, prices rose across all markets covered by this report, with the exception of Clear Creek County. Of the markets that saw prices rise, all did so by double digits, with very notable gains in Boulder, Gilpin, and Park counties.
❱ Affordability levels continue to trouble me, and the pace of price appreciation has to slow at some point. The market is clearly still out of balance, but as long as the credit quality of buyers remains high, I do not see any cause for concern.
Days on Market
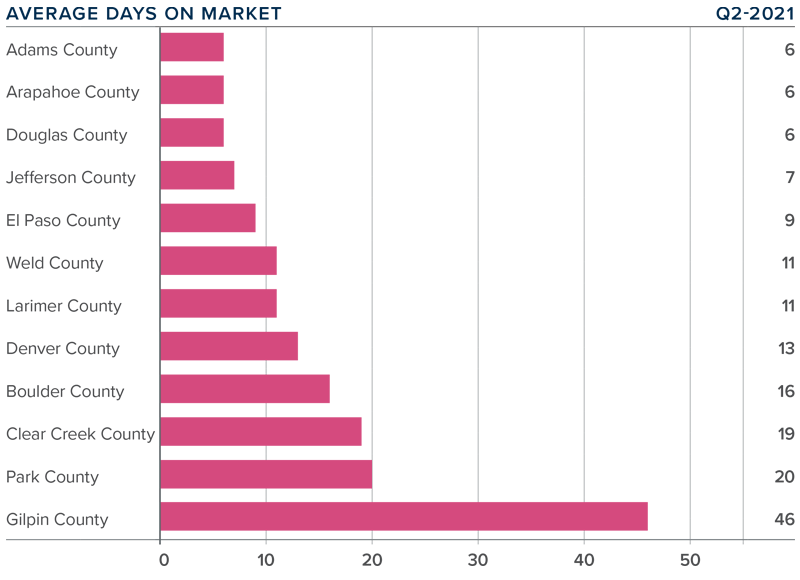
❱ The average number of days it took to sell a home in the markets contained in this report dropped 14 days compared to the second quarter of 2020.
❱ The amount of time it took to sell a home dropped in every county contained in this report compared to the second quarter of 2020. The exception was Gilpin County, where it rose by only two days.
❱ It took an average of only 14 days to sell a home in the region, which is down 11 days compared to the first quarter of this year.
❱ The Colorado housing market remains very tight, as demonstrated by the fact that it took less than a month for homes to sell in every county other than one.
Conclusions

This speedometer reflects the state of the region’s real estate market using housing inventory, price gains, home sales, interest rates, and larger economic factors.
Sales rose on the back of lower mortgage rates and higher levels of homes available to buy. Although this should signify a move back to a more balanced market, we are not there yet as price growth remains well above the long-term average.
With solid demand and favorable financing rates, the market is expected to remain active as we move through the balance of the year. That said, housing affordability is becoming an increasingly large concern. According to the Colorado Association of REALTORS®, statewide affordability for single-family homes has dropped almost 20% year-over-year and is down 17.8% for multi-family homes.
At some point, an affordability ceiling will be reached, which will slow home-price appreciation—but not yet. As such, I am moving the needle a little more in favor of home sellers, as they remain in the driver’s seat, for now.
About Matthew Gardner
As Chief Economist for Windermere Real Estate, Matthew Gardner is responsible for analyzing and interpreting economic data and its impact on the real estate market on both a local and national level. Matthew has over 30 years of professional experience both in the U.S. and U.K.
In addition to his day-to-day responsibilities, Matthew sits on the Washington State Governors Council of Economic Advisors; chairs the Board of Trustees at the Washington Center for Real Estate Research at the University of Washington; and is an Advisory Board Member at the Runstad Center for Real Estate Studies at the University of Washington where he also lectures in real estate economics.
")


