The following analysis of the Eastern Washington real estate market is provided by Windermere Real Estate Chief Economist Matthew Gardner. We hope that this information may assist you with making better-informed real estate decisions. For further information about the housing market in your area, please don’t hesitate to contact me.
ECONOMIC OVERVIEW
The Washington State economy added 96,900 new jobs over the past 12 months, representing an annual growth rate of 2.9%—still solidly above the national rate of 1.5%. Most of the employment gains were in the private sector, which rose by 3.4%. The public sector saw a more modest increase of 1.6%. Even with solid increases in jobs, the state unemployment rate held steady at 4.7% — a figure that has not moved since September of last year. The counties contained in this report added 3,430 new jobs over the past 12 months, representing an annual growth rate of 0.8%.
HOME SALES ACTIVITY
- In aggregate, home sales throughout Eastern Washington continue to outperform historic averages, with sales rising 18.4% compared to the same quarter of 2017.
-
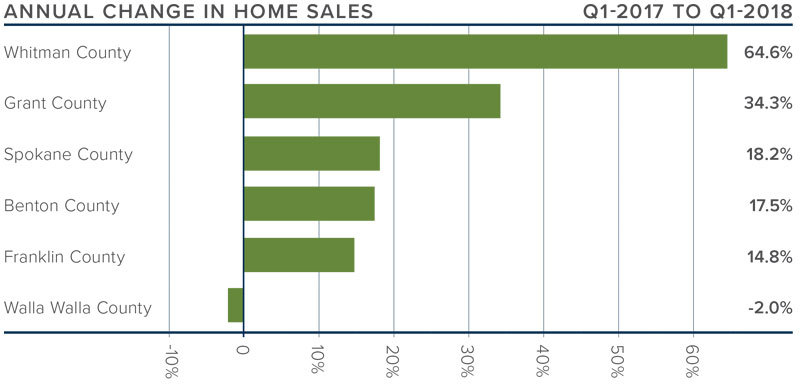
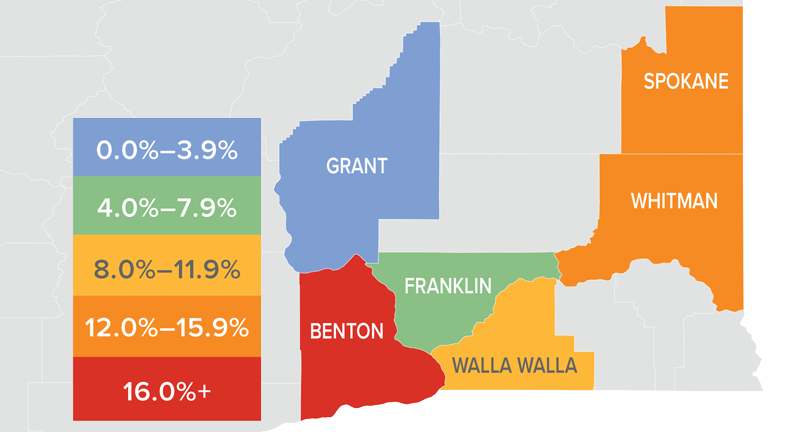
Sales rose at the fastest rate in Whitman County, which increased 64.6% over a year ago. However, because that market is relatively small, a modest shift in sales can dramatically change the rate of growth in either direction.
- Year-over-year, home sales rose in all counties except Walla Walla, where there was a very modest drop. In total, there were 2,545 home sales in the first quarter.
- The number of homes for sale was down 15.2% from the first quarter of 2017. Inventory clearly remains an issue and this will continue to push home prices higher.

HOME PRICES
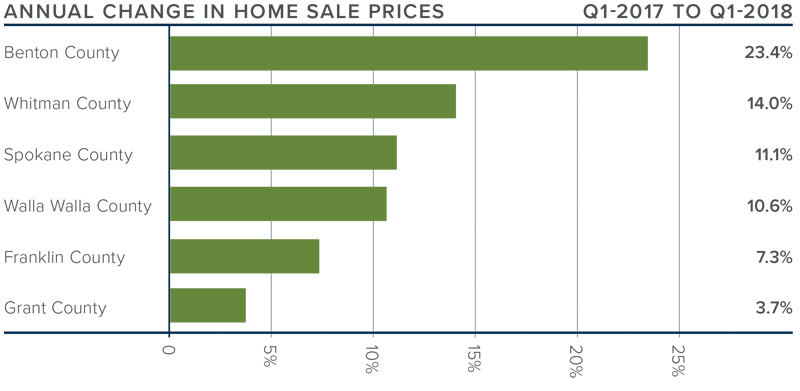
 All the counties in this report saw prices rise compared to the final quarter of 2017. Benton County led the way again, with an increase of 23.4%.
- Home-price growth continues at above-average rates, even as mortgage rates rose through first quarter.
- Year-over-year, the average home price in the region rose 13.1% to $250,376. Price growth had been moderating, but this was not the case in the first quarter of this year.
- Limited inventory continues to drive prices higher. This is unlikely to change as we move into the normally buoyant spring market.

DAYS ON MARKET
- The average number of days it took to sell a home dropped by one day compared to the first quarter of 2017.
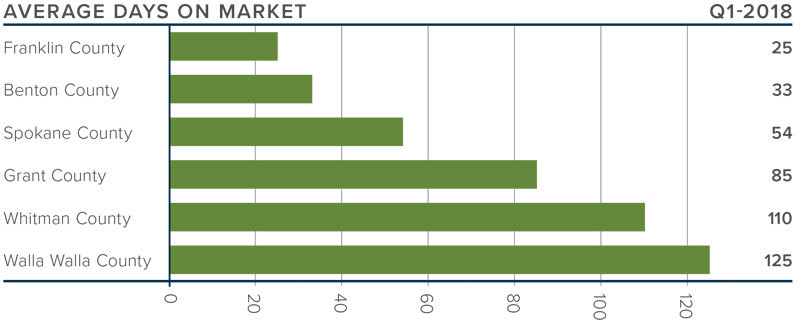
- The average time it took to sell a home in the region was 72 days.
- Every county except Whitman saw the time it took to sell a home drop from the same quarter in 2017.
- Franklin County had the biggest drop in days on market. The time it took to sell a home there fell by 13 days compared to the first quarter of 2017.

CONCLUSIONS
 This speedometer reflects the state of the region’s housing market using housing inventory, price gains, home sales, interest rates, and larger economic factors. Listing activity increased in Franklin and Benton Counties, which was positive news for buyers in those areas. However, the overall trend remains firmly in favor of home sellers, so I moved the needle a little more in their direction.

Matthew Gardner is the Chief Economist for Windermere Real Estate, specializing in residential market analysis, commercial/industrial market analysis, financial analysis, and land use and regional economics. He is the former Principal of Gardner Economics and has more than 30 years of professional experience both in the U.S. and U.K.
 Facebook
 X
X
 Pinterest
 Copy Link


