

Hi. I’m Jeff Tucker, principal economist at Windermere Real Estate, and this is a Local Look at the March 2025 data from the Northwest MLS.
Our local real estate roller coaster turned back up in March, after a couple soft months to start the year. Pending sales actually climbed YoY in March, around Washington and especially the Puget Sound region, as buyers seemed to respond to the decline in mortgage rates over the month. This is still not a red-hot spring selling season but it’s not exactly a buyer’s market either.
Here are the four key metrics I watch to track supply and demand in the market: closed and pending sales, which tell us a lot about demand; and listings – new and active – which tell us a lot about supply.
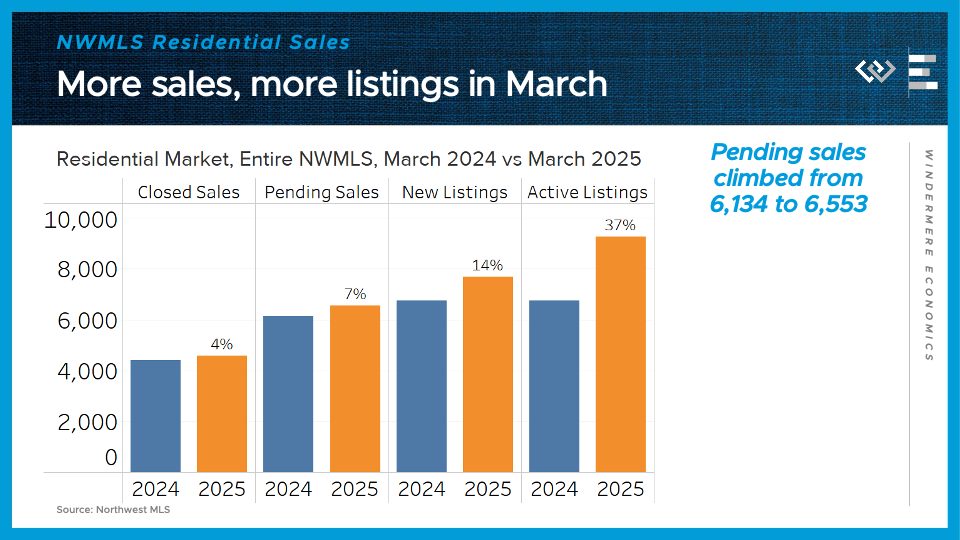 Across the Northwest MLS, closed sales of single-family homes grew 4% in March from their year-ago levels, after flatlining in February. Pending sales, which are more of a real-time demand indicator, climbed 7% from last year. That’s a strong reversal from February’s dip in pending sales.
On the supply side, about 14% more new listings hit the market this March, and the tally of active listings ended the month 37% higher than March 2024’s inventory. Buyers are seeing a lot more options than they had last spring.
Across the Northwest MLS, closed sales of single-family homes grew 4% in March from their year-ago levels, after flatlining in February. Pending sales, which are more of a real-time demand indicator, climbed 7% from last year. That’s a strong reversal from February’s dip in pending sales.
On the supply side, about 14% more new listings hit the market this March, and the tally of active listings ended the month 37% higher than March 2024’s inventory. Buyers are seeing a lot more options than they had last spring.
 The final key metric to check in on: the median price for those closed single-family home sales climbed just 2% year-over year in March, from about $655,000 to $666,000. That’s another month of decelerating price growth after Q4 was particularly hot.
Putting it all together, we’ve got more supply meeting more demand this spring – more buyers are finding a match; sales are picking up; but all that inventory has kept a lid on price growth.
Now I’ll dig into the four counties encompassing the greater Seattle area, which mostly had similar trends to Washington as a whole.
The final key metric to check in on: the median price for those closed single-family home sales climbed just 2% year-over year in March, from about $655,000 to $666,000. That’s another month of decelerating price growth after Q4 was particularly hot.
Putting it all together, we’ve got more supply meeting more demand this spring – more buyers are finding a match; sales are picking up; but all that inventory has kept a lid on price growth.
Now I’ll dig into the four counties encompassing the greater Seattle area, which mostly had similar trends to Washington as a whole.
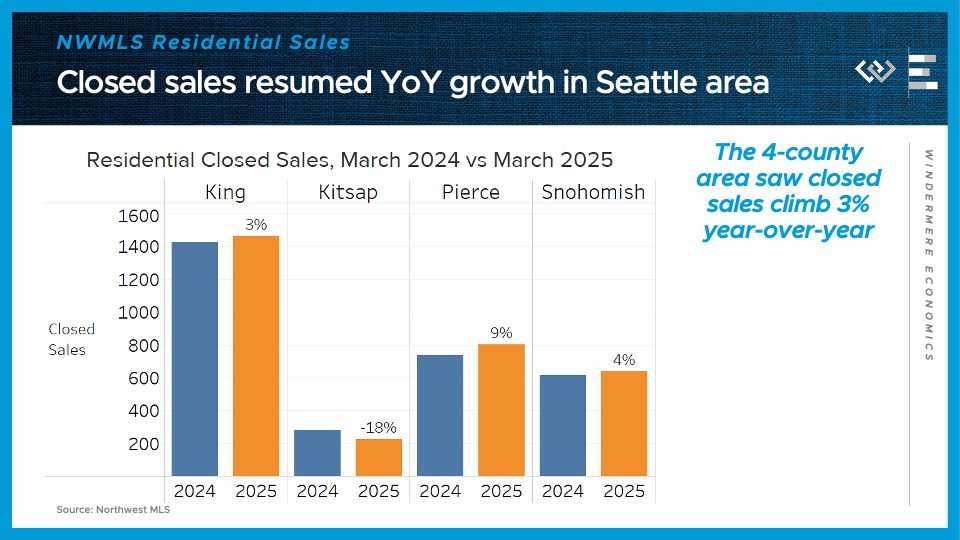 Residential closed sales climbed 3% year over year here in King County, and for the whole 4-county region; they dropped 18% in Kitsap County; climbed 9% in Pierce County, including Tacoma; and rose 4% in Snohomish County, including Everett. Not huge growth but it is a turnaround from February, when sales fell slightly from year-ago levels.
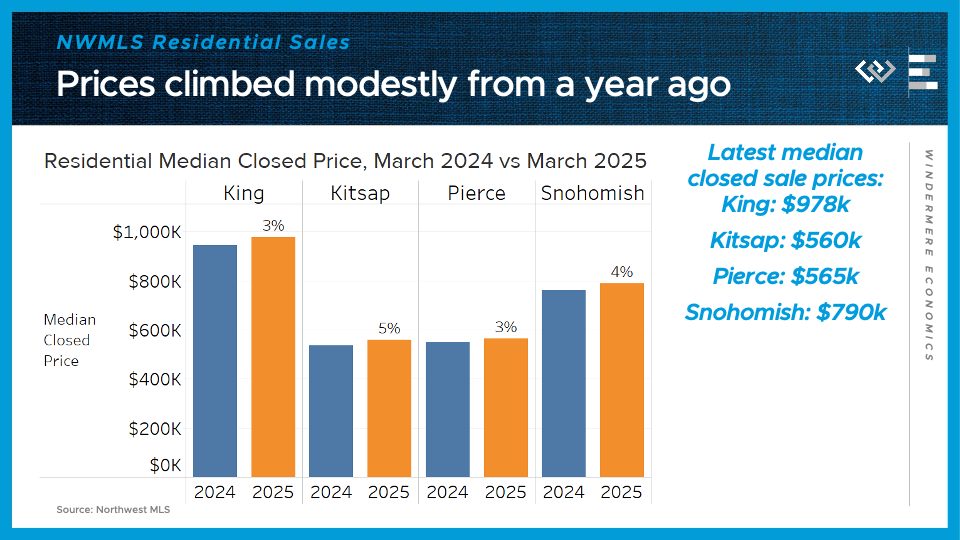
The median sale price climbed between 3 and 5%, locally: 3% change from last year in King County and Pierce County, up 5% in Kitsap County, and up 4% in Snohomish County.
Residential closed sales climbed 3% year over year here in King County, and for the whole 4-county region; they dropped 18% in Kitsap County; climbed 9% in Pierce County, including Tacoma; and rose 4% in Snohomish County, including Everett. Not huge growth but it is a turnaround from February, when sales fell slightly from year-ago levels.
The median sale price climbed between 3 and 5%, locally: 3% change from last year in King County and Pierce County, up 5% in Kitsap County, and up 4% in Snohomish County.
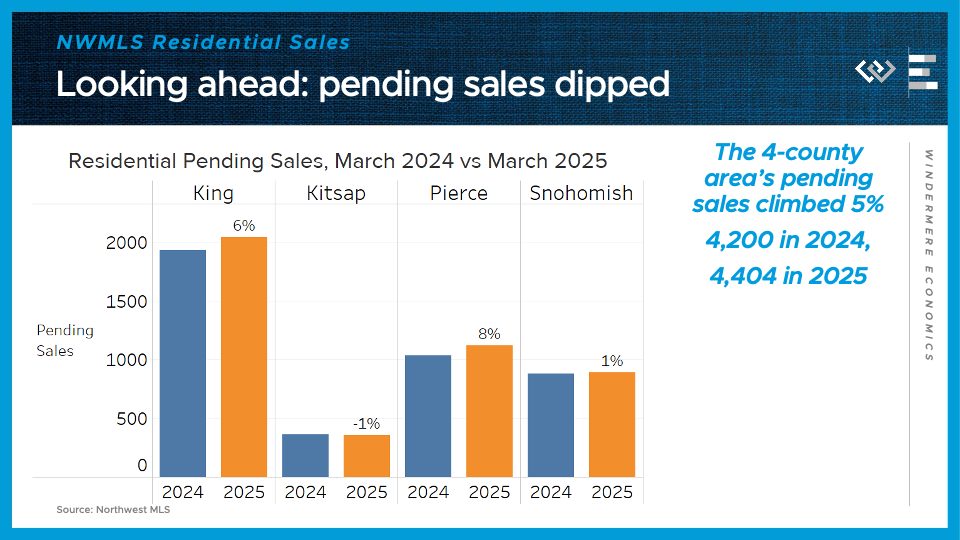
 Looking ahead, pending sales climbed more than closed sales: up 6% in King, down 1% in Kitsap, up 8% in Pierce, and up 1% in Snohomish County. Altogether that makes 5% growth across the 4 counties, which should support further growth in closings in April. That’s the biggest piece of evidence I see that buyers are coming back to the market this spring.
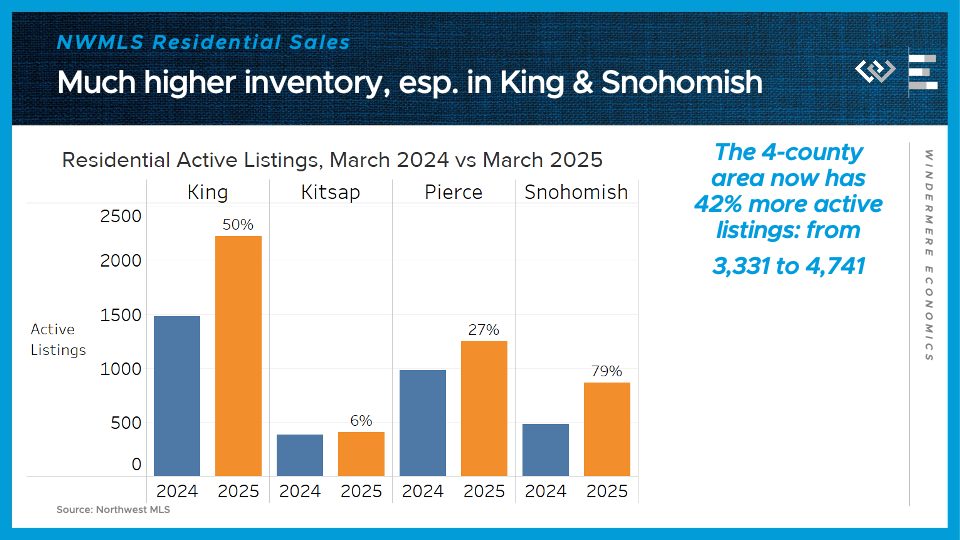
 On the supply side, the 4-county greater Seattle area had about 42% more active listings at the end of March than the same time last year. The inventory growth is especially dramatic in King and Snohomish Counties, where listings are up 50% and 79% respectively.
 So while there’s more purchase activity, these inventory gains are helping to keep it a pretty balanced market. Barring any big negative shocks, I’m expecting stronger year-over-year sales growth in April and May, because last year mortgage rates spiked upward starting in mid-April, which sent buyers back into hibernation. This spring, interest rates are declining modestly, which is the silver lining of a diminished outlook for economic growth.
Across the Northwest MLS, closed sales of single-family homes grew 4% in March from their year-ago levels, after flatlining in February. Pending sales, which are more of a real-time demand indicator, climbed 7% from last year. That’s a strong reversal from February’s dip in pending sales.
On the supply side, about 14% more new listings hit the market this March, and the tally of active listings ended the month 37% higher than March 2024’s inventory. Buyers are seeing a lot more options than they had last spring.
The final key metric to check in on: the median price for those closed single-family home sales climbed just 2% year-over year in March, from about $655,000 to $666,000. That’s another month of decelerating price growth after Q4 was particularly hot.
Putting it all together, we’ve got more supply meeting more demand this spring – more buyers are finding a match; sales are picking up; but all that inventory has kept a lid on price growth.
Now I’ll dig into the four counties encompassing the greater Seattle area, which mostly had similar trends to Washington as a whole.
Residential closed sales climbed 3% year over year here in King County, and for the whole 4-county region; they dropped 18% in Kitsap County; climbed 9% in Pierce County, including Tacoma; and rose 4% in Snohomish County, including Everett. Not huge growth but it is a turnaround from February, when sales fell slightly from year-ago levels.
The median sale price climbed between 3 and 5%, locally: 3% change from last year in King County and Pierce County, up 5% in Kitsap County, and up 4% in Snohomish County.
Looking ahead, pending sales climbed more than closed sales: up 6% in King, down 1% in Kitsap, up 8% in Pierce, and up 1% in Snohomish County. Altogether that makes 5% growth across the 4 counties, which should support further growth in closings in April. That’s the biggest piece of evidence I see that buyers are coming back to the market this spring.
On the supply side, the 4-county greater Seattle area had about 42% more active listings at the end of March than the same time last year. The inventory growth is especially dramatic in King and Snohomish Counties, where listings are up 50% and 79% respectively.
So while there’s more purchase activity, these inventory gains are helping to keep it a pretty balanced market. Barring any big negative shocks, I’m expecting stronger year-over-year sales growth in April and May, because last year mortgage rates spiked upward starting in mid-April, which sent buyers back into hibernation. This spring, interest rates are declining modestly, which is the silver lining of a diminished outlook for economic growth.


")


