Market News August 3, 2016

Nevada Real Estate Market Update


ECONOMIC OVERVIEW 

Job recovery in the Las Vegas metropolitan area took a bit of a pause during second quarter. May employment was down by 200 jobs from the prior month, but still 21,300 higher than seen a year ago. This matches the annual pace of 21,300 jobs seen at the end of last year, but is below the average annual rate of 32,700 for the whole of 2015. It is too early to suggest that this “slowdown” will be ongoing, but I will be keeping a close eye on the numbers through
the summer months.

The local unemployment rate rose from 6.1% to 6.4% between April and May, but it’s important to keep in mind that this data is not seasonally adjusted. (Seasonal adjustments remove the influences of predictable seasonal patterns to show how unemployment changes from month to month.) The employment rate has been fluctuating quite frenetically over the past
few months, but I believe that Las Vegas is still trending in the right direction, especially considering that there were substantial additions to the workforce during the spring.


HOME SALES ACTIVITY

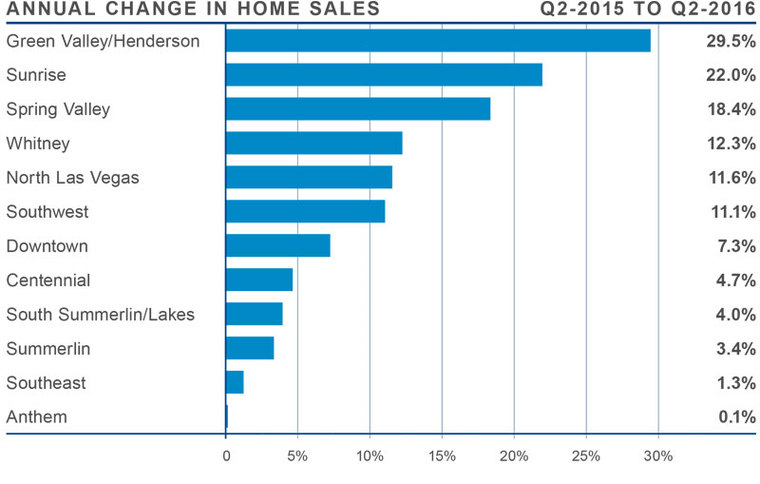
■ There were 9,717 home sales last quarter, which is an annual increase of 9.7%.

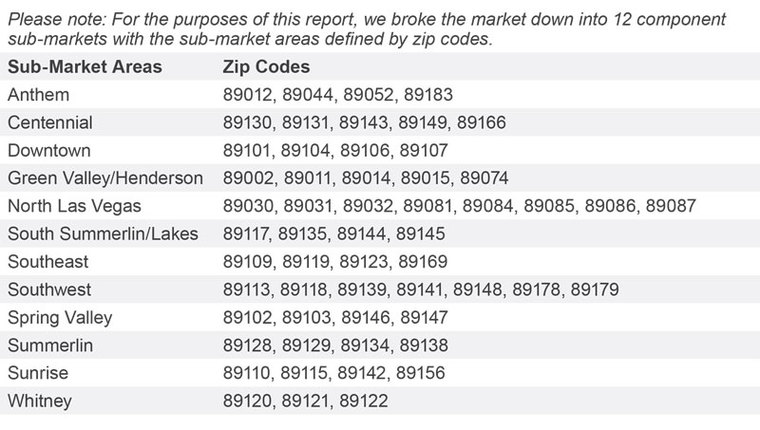
■ Sub-markets where sales activity was slow were limited to the Southeast and Anthem areas, but the declines were very modest.

■ The fastest rate of growth in sales came in the Green Valley/Henderson sub-market, which saw home sales rise by 29.5% over the past year.

■ Inventory levels remain a major issue with the number of homes for sale 3.9% lower than a year ago, and 9.4% lower than in the first quarter of the year. There were four areas where the number of homes for sale increased, led by the Southwest sub-market which saw listings increase by 7%.
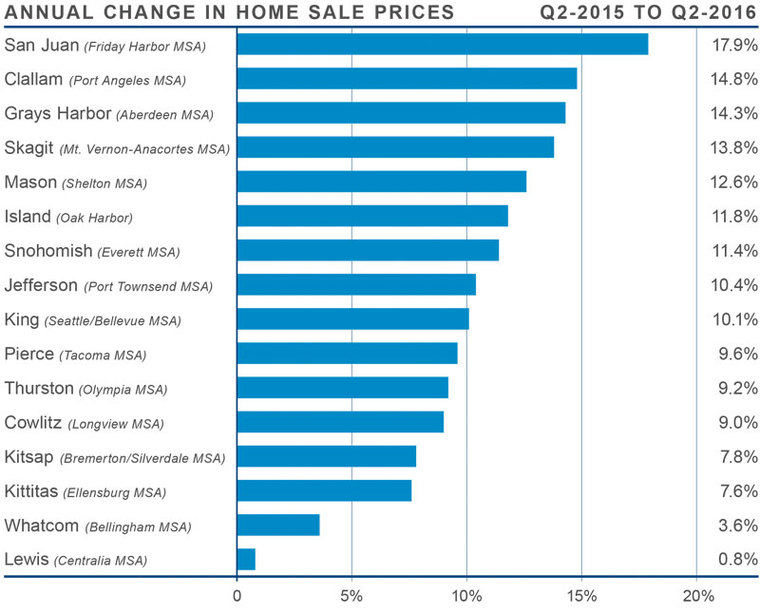


HOME PRICES

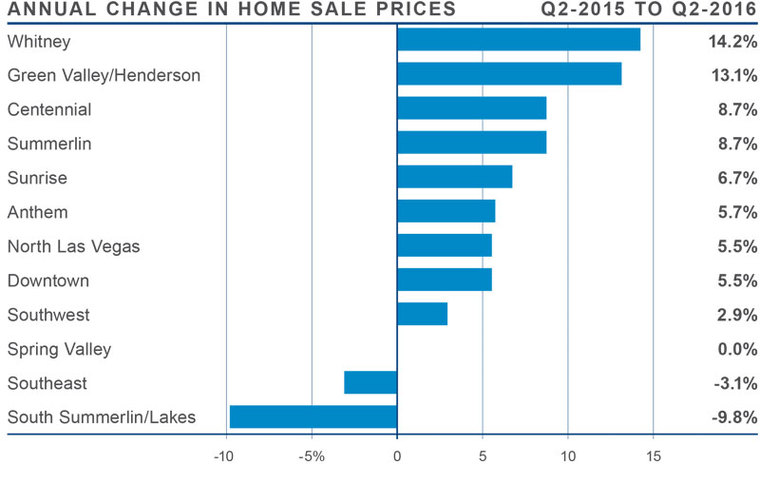
■ Average prices in the region rose by 3.8% year-over-year to $230,500.

■ The Whitney sub-market saw the strongest annual growth with home prices rising by 14.2% to $174,333.

■ All but three sub-markets saw prices rise compared to the second quarter of 2015, and two sub-markets registered double-digit percentage gains.

■ Prices fell in the South Summerlin/Lakes and Southeast sub-markets, but I don’t believe that one declining quarter is enough to suggest that this trend will continue.
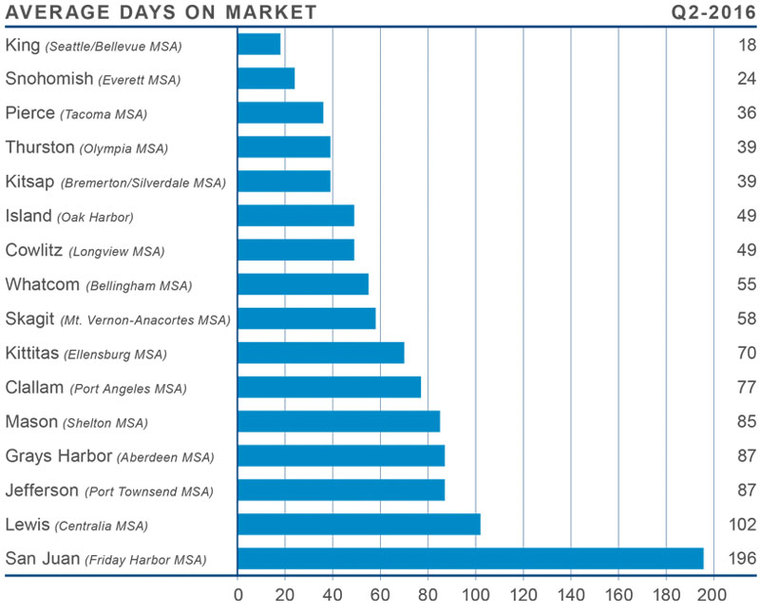


DAYS ON MARKET

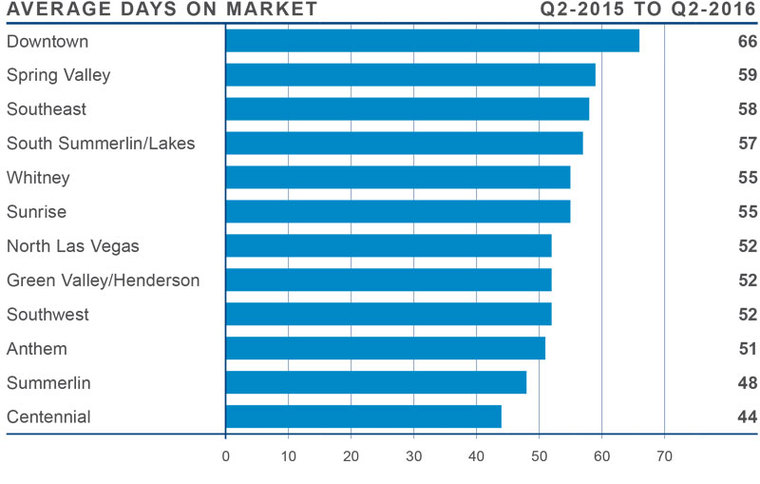
■ The average number of days it took to sell a home in the region dropped by nine days when compared to the second quarter of 2015.

■ The average time it took to sell a home in the region was 53 days.

■ The South Summerlin/Lakes sub-market was the only market where the number of days on market did not drop but it did not increase either!

■ The greatest drop in days-on-market was seen in the Sunrise sub-market, which dropped by
16 days.


CONCLUSIONS

The speedometer reflects the state of the region’s housing market using housing inventory, price gains, sales velocities, interest rates and larger economics factors.

The Southern Nevada economy continues to grow, but the pace has slowed. This is not a cause for concern at the moment, but I will be watching the data through the summer to better understand the reasons for the current slowdown.

Inventory levels are not what I would hope for, and it is clear that more choice in homes for sale will lead to a more balanced market. Home prices are still rising, but at a reasonable pace. Because of this, I am leaving the speedometer in the same position as last month—still in favor of sellers.


Matthew Gardner is the Chief Economist for Windermere Real Estate, specializing in residential market analysis, commercial/industrial market analysis, financial analysis, and land use and regional economics. He is the former Principal of Gardner Economics, and has over 25 years of professional experience both in the U.S. and U.K.

Market News August 2, 2016

Southern California Real Estate Market Update


ECONOMIC OVERVIEW

Over the past 12 months, the Southern California markets covered by this report added 122,800 new jobs, and the total number of people claiming unemployment insurance dropped by almost 204,000.  With these changes, the unemployment rate has dropped by two percentage points from 6.3% to 4.3%.

The regional economy appears to be performing quite well and I expect this trend to continue for the foreseeable future.


HOME SALES ACTIVITY

  • There were a total of 54,216 home sales in second quarter of 2016. This was 0.6% lower than seen during the same period in 2015, which I attribute to the 3.3% decline in the number of homes for sale.
  • The decline in the number of home sales in most markets was primarily due to lower inventory levels, but this was not the case in Orange County where listings were modestly higher.
  • Home sales were a mixed bag with higher sales reported in San Bernardino and Riverside Counties, but lower in LA, Orange and San Diego Counties.
  • Total listings are still well below levels that are expected in balanced markets.


HOME PRICES

  • Compared to second quarter of 2015, average prices in the region rose by 3.9% to $618,042. We continue to see a slowdown in price growth, which can be attributed to affordability as well as supply issues.
  • LA County and Orange County are almost at parity with each other price-wise. The average home price last quarter was $774,000 in LA County and $772,000 in Orange County.
  • San Diego County saw the greatest appreciation in home values (+6.9%) to $617,000. This was followed by San Bernardino County, where the average price rose 5% to $323,300.
  • Both LA County and Orange County saw prices jump between the first and second quarters of this year, with prices 7.5% higher in LA County and 8.8% higher in Orange County.


DAYS ON MARKET

  • The average time it took to sell a home in the region was 58 days. This is a drop of three days when compared to the second quarter of 2015.
  • The decline in days on market remains a function of low inventory, as well as price. The drop in the time it takes to sell a home is moderating, primarily due to escalating home values which are stretching buyers’ budgets.
  • Homes in San Diego County continue to sell at a faster rate than the other markets in the region. In the second quarter, it took an average of 29 days to sell a home, which is seven days less than seen a year ago.
  • Four of five counties saw a drop in the amount of time it took to sell a home between the second quarter of 2015 and the second quarter of 2016. The only exception was in San Bernardino County, where the time it takes to sell a home remained at 66 days.


CONCLUSIONS

The speedometer reflects the state of the region’s housing market using housing inventory, price gains, sales velocities, interest rates and larger economics factors. The expansion of the economy in the Southern California region continues to taper, but for good reason. The area is getting close to reaching “full employment”, which naturally leads to a subsequent slowdown in employment growth.

The demand for housing continues, but affordability is starting to act as an anchor in some markets. That said, if inventory levels start to grow, some of the pressure will ease and we should head towards a more balanced market.

Interest rates remain competitive, and price growth has shown some signs of slowing, which favors buyers; however, inventory constraints persist and, for that reason, the market still clearly favors sellers.


Matthew Gardner is the Chief Economist for Windermere Real Estate, specializing in residential market analysis, commercial/industrial market analysis, financial analysis, and land use and regional economics. He is the former Principal of Gardner Economics, and has over 25 years of professional experience both in the U.S. and U.K.
Market News August 1, 2016

Oregon and South West Washington Real Estate Market Update

ECONOMIC OVERVIEW

As a whole, Oregon’s labor market remains stronger than it has been in decades. Job growth in the second quarter was somewhat muted, but this is nothing to be concerned about. Businesses have expanded to pre-recession levels, so at this point hiring tends to be cyclical rather than expansionary.

The state has essentially reached what is defined as “full employment”, at which point growth rates tend to naturally slow. This explains why the state’s unemployment rate has remained steady at 4.5% for the past three months—a level that has not been seen in over 40 years.


HOME SALES ACTIVITY

  • Home sales fell by 2.3% when compared to the second quarter of 2015, with a total of 17,509 transactions.
  • Sales rose at the fastest rate in Linn, Josephine, Columbia, Polk, and Wasco Counties. The greatest declines were seen in Hood River, Tillamook, Klickitat, Multnomah, and Benton Counties.
  • Although overall sales activity was somewhat slower, there were still 14 out of 26 counties that saw home sales increase over the same period in 2015. However, a majority of these counties are small, which means a few sales can result in major swings. As such, I believe the major reason for the slowing in sales is the lack of inventory rather than lack of demand.
  • Home sales are a product of supply, and that is what’s missing from the equation. When we start to see more listing activity—which I hope will be later on this year—an increase in sales will surely follow.


HOME PRICES

  • Average prices in the region rose by 10.5% year-over-year to $336,882. This is up from the annual rate of 9.1% seen in the first quarter of the year. It is clear that supply constraints continue to push prices higher, and this rate of appreciation is one of the highest in the nation.
  • When compared to the second quarter of 2015, Jefferson County took over as the market with the greatest price growth, with homes selling for 34% above that seen a year ago.
  • All counties saw prices rise compared to the second quarter of 2015, and all but eight saw double-digit percentage gains. The only “underperformer”—if it can be termed as such—was the very small Hood River County where prices rose by 0.6%.
  • The rapid price growth that is being seen in the region so far this year cannot be sustained. That said, I see little reason to believe that any slowdown will occur in the near-term.


DAYS ON MARKET

  • The average time it took to sell a home last quarter was 88 days.
  • The average number of days it took to sell a home dropped by 16 days when compared to a year ago.
  • Crook County was the only area where the average time it took to sell a home rose, but given the fact that it is a small market (104 sales this quarter), the increase is clearly nominal.
  • The fastest sales pace was again seen in Washington and Multnomah Counties, which reported an average of just 21 days to sell homes.


CONCLUSIONS

The speedometer reflects the state of the region’s housing market using housing inventory, price gains, sales velocities, interest rates and larger economics factors. Growth in the Oregon economy remains well above average and is unlikely to slow down in the foreseeable future. As real estate relies heavily on economic growth, this continues to bode well for the Oregon housing market.

Listing activity is still well below levels that I would like to see, and this continues to push up home prices. Interest rates remain at near historically low levels and are not likely to increase to any great degree in the near-term. This allows buyers to borrow more, and adds additional upward pressure on home prices.

As such, I have moved the needle even more in favor of sellers.


Matthew Gardner is the Chief Economist for Windermere Real Estate, specializing in residential market analysis, commercial/industrial market analysis, financial analysis, and land use and regional economics. He is the former Principal of Gardner Economics, and has over 25 years of professional experience both in the U.S. and U.K.


Market News July 28, 2016

Western Washington Real Estate Market Update


ECONOMIC OVERVIEW

Washington State continues to see strong employment growth, outpacing national numbers with an annual rate of more than 3%. Interestingly enough, despite these substantial job gains, the unemployment rate remains stubbornly high at 5.8%. However, I’m not overly concerned about this because it’s largely due to a growing labor force rather than a declining job market. This means that those who are unemployed who had previously stopped looking for work are now resurrecting their job searches because they have confidence in the economy.

I expect to see a modest drop in the unemployment rate through the balance of the year, and believe we will continue to outperform the nation as a whole with above-average job gains.


HOME SALES ACTIVITY

  • There were 22,721 home sales during the second quarter of 2016, up by 4.4% from the same period in 2015. We finally saw a much-needed increase in listings, which rose by 30.1% between first and second quarter. This increase in the number of homes for sale led to an increase in sales, which rose by 4.4% when compared to the same period in 2015.
  • Island County saw sales grow at the fastest rate over the past 12 months, with sales up by 22.1%. This is a small county which is subject to wild swings, so I take the data at face value. That said, the larger Thurston County saw sales up by an equally impressive 19.7%. Most interesting is that King County saw sales fall modestly compared to the same time period in 2015. Price—and supply—are clearly an issue in the most populous county in our state.
  • Overall listing activity was down by 21.8% compared to the second quarter of 2015, but the good news is that the supply side deficit is actually getting a little less than we have seen over the past few years. The total number of homes for sale was 30.1% higher than seen at the end of the first quarter. While much of this can be attributed to seasonality, it is still nice to see!
  • The region is experiencing positive job growth, and with it, migration to Washington State is running at a very brisk pace. Given these factors—in addition to our lack of new home construction—it is not surprising to see demand substantially usurping supply. As I look forward, I believe inventory levels will continue to rise modestly, but it will remain a solidly seller’s market for the rest of the year.


HOME PRICES

  • With demand still exceeding supply, we should not be surprised to see average sale prices continuing to rise, as is certainly the case in our region. Home prices rose by 8.1% between the second quarter of 2015 and the second quarter of this year. This is down from the annual rate of 10.1% that we showed in our last report, but the rate is still far higher than the historic average of 4%.
  • Regular readers of this report will remember that there were several counties where average sale prices in the first quarter were actually lower than seen a year before. I suggested that seasonality was to blame and that was indeed the case, with all counties in this report now showing annualized price gains.
  • When compared to the second quarter of 2015, price growth was most pronounced in San Juan County and, in total, there were nine counties where annual price growth exceeded 10%.


  • The prevailing supply/demand imbalance continues to push prices higher, and persistently low interest rates are just adding fuel to the flames. If rates stay at current levels, it is unlikely that we will see much in the way of slowing appreciation for the rest of the year.


DAYS ON MARKET

  • The average number of days it took to sell a home dropped by 17 days when compared to the second quarter of 2015.
  • It took an average of 67 days to sell a home in the second quarter of this year—down from both the 86 days it took to sell a home in the first quarter of this year, and from the 84 days that it took to sell a home in the second quarter of 2015.
  • The only market where the length of time it took to sell a home rose was in the notoriously fickle San Juan County, where it rose by 30 days to 196 days. In the rest of the region, the average decrease in the time it took to sell a home between the second quarter of 2015 and the second quarter of 2016 was 20 days.


  • Snohomish County has joined King County as a market that takes less than a month to sell a home. At 18 days, King County is unarguably the hottest market in the region, but sales are slowing due to the lack of inventory. This imbalance is unsustainable over the long term.


CONCLUSIONS

This speedometer reflects the state of the region’s housing market using housing inventory, price gains, sales velocities, interest rates, and larger economics factors. For the second quarter of 2016, I am leaving the needle in the same position as last quarter. Inventory levels have improved, albeit modestly, and price growth has slowed very slightly. However, this is offset by a jump in pending sales, a slightly higher number of closed sales, and a drop in interest rates. As such, the region remains staunchly a seller’s market.


Matthew Gardner is the Chief Economist for Windermere Real Estate, specializing in residential market analysis, commercial/industrial market analysis, financial analysis, and land use and regional economics. He is the former Principal of Gardner Economics, and has over 25 years of professional experience both in the U.S. and U.K.


Living July 22, 2016

6 Alternative Flooring Solutions to Refresh Your Home

Feeling ho-hum about classic hardwood floors? Here are six alternative floor solutions that can give any room in your house a fresh sense of personality, whether you’re starting from scratch or looking for an inexpensive DIY update.

1. Rubber. Often associated with commercial interiors, industrial rubber flooring can also be a sleek and smart solution for homes. Rubber is comfortable to stand on, easy to clean and durable enough to take on plenty of mess and abuse — great for an entry, a mudroom or a laundry room. From a style perspective, it gives a room a hint of an industrial edge, but in warm muted tones that still create an inviting air.

In a kitchen, a rubber floor is a chef’s dream, as it cushions the feet while the cook is standing to reduce fatigue. Plus, the textural surface reduces slipping hazards from spills and is very child-friendly.

7 Kitchen Flooring Materials to Boost Your Cooking Comfort


DHV Architects, original photo on Houzz


Want a rubber floor with a less industrial vibe? Choose sheets or tiles of rubber with a flat surface dyed to various hues that draw from the tones in stone tile. You wouldn’t guess this floor is rubber by looking at it, but your feet would be able to tell.

Cost: Rubber flooring can be extremely inexpensive but, in general, quality materials start at $12 per square foot. Anything below that would probably be of a quality that wouldn’t look appropriate inside a home.


Green Goods, original photo on Houzz


2. Bamboo. Bamboo flooring is similar to wood flooring in many ways, but it imparts a Zen flair that can add a sense of peace to a room. And it is typically more moisture-resistant and hard-wearing than wood.

It should be noted that not every bamboo product is equally environmentally conscious. For one thing, shipping products from overseas can quickly make up for any carbon-footprint cost saved during production. However, if you are looking for a durable natural floor that’s sustainably grown, bamboo is a great option to consider.

It’s also worth noting that bamboo flooring can come in quite a variety of styles. A higher-contrast grain and stain can create an exotic look, for an effect that is playful and energetic rather than soft and tranquil.

If you love the look of walnut or zebrawood, bamboo can recreate that vibe with a stronger surface, and without cutting down any rare trees.

Keep in mind that the stains and adhesives involved in bamboo flooring can off-gas with an unpleasant odor, so those who are sensitive to chemicals may want to avoid the space immediately following an installation, or look at traditional hardwoods instead.

Cost: Bamboo is generally comparable in price to hardwoods, running about $2 to $8 per square foot.


3. Parquet. Everything old is new again, and while some homeowners (and many renters) are wishing away their parquet floors, others are installing them anew. These patterned wood floors add a sense of life and richness to a home, bringing visual interest and a sense of dynamic energy that typical straight-laid planks can’t match.

Installing wood in a parquet pattern also gives a lot more character to inexpensive local woods that might not have an exciting grain. For a patient DIYer, a parquet floor gives a high-fashion look with a much lower price tag than some other choices.


Arnold Ziffel, original photo on Houzz


To give a classic block parquet layout a modern twist, use an oversized pattern in squares 12 inches or bigger. And, yes, a warm honey or orange tinted stain is back as well, especially mixed with classic modern furnishings in deep rich tones like chocolate, ruddy tan or espresso or crisp, airy whites.

Cost: Installation fees may be a bit higher than for straight-laid flooring, but the material cost can be as low as a few dollars per square foot.

See These Styles at Your Local Showroom


ABRAMS, original photo on Houzz


4. Painted. Think painted wood floors are only for cottages? As with walls, painting a floor can create as many different moods and effects as there are colors of paint. And if you choose a paint in a durable finish, it will hold up just as well as your wall paint does.

For a contemporary interior, consider a painted floor in a simple, natural hue like a muted beige or an off-white, and mix it with anything from antiques to midcentury classics or hip, trendy pieces.

You can kick up the style of a painted floor another notch by creating patterned effects that echo stone inlays, without that thousands-of-dollars investment. With a little painter’s tape and patience, this can be another great DIY approach to getting high style at home without ripping out your existing wood.

For those who do prefer a relaxed cottage air, a muted color adds a lot of charm, much like an accent wall, only underfoot. Try pale blue for a semi-neutral that will work with neutrals or other colors without clashing.

Cost: Paint and a top coat will cost a few dollars per square foot, and can be applied to existing flooring (with some good sanding and prep) or to inexpensive wood planks for a new installation.


Christian Gladu Design, original photo on Houzz


5. Concrete. Concrete floors may sound like the domain of cold, minimalist works of architecture, but they can actually come in many forms to suit various tastes and personalities. Like wood, concrete can be stained (or tinted), allowing the material to feel quite warm and human in a way that beautifully suits transitional or traditional spaces.

Why choose concrete? Well, you can imagine that if the material can handle the wear and tear in an auto factory or warehouse, it can easily handle pets, children and sharp heels.

For an added seal and a gloss effect, concrete is sometimes finished with a coat of resin. This gallery-like look typically comes with a gallery price tag, but for those who enjoy a modern atmosphere with a perfect polish, this look is definitely photoshoot-ready.

It should be noted that concrete does not retain heat well, and thus can be chilly without a heated floor system, but extremely cozy with one installed.

Cost: With heated floors and a sleek finish, the cost can definitely add up. Your budget could range from $2 to $20 per square foot and beyond.


6. Cork. Cork flooring, like bamboo, can be developed very sustainably, making many cork products a smart choice for those hoping to reduce their environmental impact.

In the case of cork, the finish is very important to determining how water-resistant the product will be. However, cork has natural springiness that makes it feel extra comfortable (a little like rubber) and makes it resistant to dents and dings. Plus, it has a unique visual texture that’s a little like wood’s but with a twist, for a very livable sense of flair.


KCS Design, original photo on Houzz


More Living Room Designs

Cork works beautifully for sleek modern spaces or contemporary ones, as it has a natural softness that gives it a friendly vibe. If you’re considering using carpet in some rooms and wood in others, consider cork for the entire home, and get the best of both worlds along with a sense of harmony.

Cost: Cork ranges from $3 to $8 per square foot, but keep in mind that some products may require an additional sealant to hold up to moisture and possible stains.


By Yanic Simard, Houzz

BuyingSelling July 20, 2016

Planning for the Future: Housing Options to Consider

It should come as no surprise that 75% of the senior citizens polled in the latest AARP Preferences survey strongly agreed with the statement, “What I’d like to do is stay in my current residence as long as possible.” After all, home is where the heart is; and the longer you live in a place, the stronger your attachment to it becomes.

But it’s important for those over 50 to assess potential lifestyle modifications that may be necessary down the road well in advance, because many will require significant research and preparation.

Whether you are planning for your own future or that of a loved one, analyzing new housing options before a change becomes necessary will help ensure you have the greatest number of options with the least amount of stress. Here are some considerations to help guide you or your loved one through the process.


Location and size

In planning for the future, communication with all involved parties is key to understanding where you or the senior in your life wants to be. Many seniors want to be close to family and friends.  Proximity or access to basic needs is also a critical consideration, especially for those who no longer drive.

Once an area is chosen, think about how much space is needed. Most seniors choose to downsize to a smaller home, and here are many advantages to this. A smaller home generally means less maintenance, lower mortgage or rental costs, and lower taxes. Less space can also be easier to manage. Single-level homes are a good option for those with decreased mobility and can help reduce the likelihood of falls and injuries. You’ll also want to consider whether a yard is needed, and whether you’d need someone else to maintain it.


Multi-family home

Multi-family homes, such as condominiums, cooperatives and townhomes, are well-suited for senior living, offering many options for budgets, maintenance and amenities. But most people don’t fully understand the differences between them.

Condominiums and cooperatives offer benefits of homeownership, but allow for certain expenses to be shared by all owners. Other benefits include security, shared building insurance and possible onsite amenities. Monthly fees are collected in both condominiums and cooperatives to maintain the property and any amenities, and both have elected boards of representatives who meet regularly to review operating expenses and building issues. Condominium ownership is based only on the unit, with taxes paid by the owner. In cooperatives, owners are shareholders, giving them sole rights and equity of their unit, but property taxes are shared by the building and included in your monthly fees.

Townhomes, on the other hand, allow for ownership of the structure and the land it sits on (front and back yards). Most are designed as row-houses, with one or two common walls. For those who prefer the legal rights of single-family ownership and do not want to pay monthly dues and do not want to pay monthly dues, a townhome may be the best option.

Drawbacks of multi-family homes can include noise from shared walls or floors, homeowner’s associations, monthly fees and CC&Rs (covenants, conditions and restrictions).


Renting

Renting can be a good way to avoid homeownership costs and maintenance. It may also be a more affordable way to live in a desirable area. Cons of renting can include noise through shared walls, the potential for your rent to increase over time, difficult or unreliable landlords, inattention to maintenance issues, and the possibility that you may need to move if the property is sold. It’s a good idea to talk to one or more current tenants of the rental to find out what their experience has been with the property and the landlord.


Alternative senior living options: independent and assisted

Another solution to consider for yourself or your family member is independent living communities (also called senior apartments, retirement communities, retirement communities, retirement homes and senior housing). Independent living communities provide privacy, independence, and the opportunity to connect with others without the demands of homeownership. They are usually full-service, offering meals, housekeeping, transportation and social activities.

For those who struggle with day-to-day living responsibilities, it may be time to consider assisted living arrangements. Some options include Adult Day Care, Elder Cottage Housing Opportunities (ECHO), Group Home, Special Care Unit (SCU) or Nursing Homes. Your state human resources department can usually provide more information about these options in your community and offer help with referrals, or you can opt for private referral services.


Financial factors

The costs for alternative housing can add up quickly—especially as the need for assistance increases. Medicare, unfortunately, does not pay for housing; but under strict financial restrictions, Medicaid may. To get a better feel for just how much these living arrangements can cost, visit GenWorth.com and search the cost of long term care where you live.

If the choice is made not to move, you could consider a reverse mortgage. This allows homeowners over the age of 65 to tap into their home equity in lieu of a monthly payment, with no repayment necessary as long as the property is their principal residence and they meet all the terms of the agreement. Keep in mind, however, that if the owner sells the home, dies, or does not meet the terms of the agreement, they or their family will be required to pay the remaining balance of the loan.

Some states offer assistance with property tax, or special assessments for seniors based on age, disability and household income. Check with your State Department of Revenue to see what options exist in your state and whether you qualify. Long-term care insurance is another option. An LTC policy will help pay for the costs not covered by traditional health insurance or Medicare (which can include assistance with daily-living activities, as well as the care provided in a variety of living/care facilities).


For more help and information

Your Windermere Real Estate agent can help you make the transition when the time is right by assessing the local property market, helping you properly price homes for sale, and finding a new home that best meets the unique needs of you or your loved ones. 

Living July 19, 2016

The Timeless Appeal of the Equestrian Life


Bronte Jacket with Fox and Horn Scarf, photo: O’Shaughnessey Apparel


Recently, I put my well-worn paddock boots away for a weekend and treated myself to a trip to New York. Though I love my horses and thoroughly enjoy taking care of them (yep, I even enjoy mucking their stalls!), I needed a little vacation, and New York is my version of Disneyland so off I went. It had been a few years since my last visit to the Big Apple and, as I walked the streets happily window shopping and people watching, I just had to giggle to myself. No matter what part of town I was in – Soho, Midtown, Upper Eastside – I saw well-dressed ladies wearing tall riding boots, snaffle-bit style belts and purses with a distinctly “horsey” feel to them.


Flynn Equestrian Jacket, photo: O’Shaughnessey Apparel


It struck me, in the midst of a big bustling city where the only horses are the giant stone ones gracing the façades of old buildings and the few scattered cart horses pulling excited tourists through Central Park, that no matter who you are or where you live, the equestrian lifestyle has ubiquitous appeal.  We all know that Ralph Lauren played a big role in defining this style in America, and clearly his influence has not dampened in decades but rather given inspiration to dozens of new designers creating in the same milieu. Lauren has built an empire on equestrian life images but, let’s face it, none of the folks running around in his famous Polo shirt just left a match. It’s probably safe to say that the majority of folks wearing a Polo have never even been to a match, and most polo players are probably not wearing Ralph Lauren (sorry Ralph).  So, what is this appeal?


Tara Hacking Jacket and Leila Ombre Scarf, photo: O’Shaughnessey Apparel


I don’t think it’s simply because equestrian sports are often favored by the mega wealthy, and hence that wearing equestrian-styled clothing somehow puts one in a league with the rich and famous. I believe it’s also about the feeling you get when you are near a horse. Horses have a regal quality and it is they who give meaning to the sport and the lifestyle. A horse would just as soon throw a prince off his back as a pauper. Likewise, he will just as likely love and care for a little girl astride his back for the very first time as the 90-year-old Queen of England.  Being in the presence of a horse makes us feel special, and who doesn’t like feeling special?


Pure and simple, horses are magic and we all want a little more magic in our lives.  Horses have carried us through war and peace, pleasure and competition. And even if you can’t have one to call your very own, wearing horse-inspired apparel makes us feel special, refined, and maybe even a little bit powerful. Just like the beautiful animals we so admire.


KiamaLise Herres is an equestrian properties specialist with Windermere Equestrian Living. She lives in Fall City, WA with her husband, two children, three horses, four dogs, one barn cat and a very sassy goat.

Living July 18, 2016

Refinancing: What you need to know

Thanks to all-time-low interest rates, the number of homeowners refinancing their mortgages is at an all-time high. Of course, no one should refinance just because everyone else is doing it. But, for many homeowners, the benefits are simply too hard to ignore any longer.

Save money each month. According to Freddie Mac (The country’s largest purchaser of home mortgages), the average homeowner who refinances is able to cut their monthly payment by $108 (almost $1,300 per year) for a $200,000 loan.

Save even more in the long run. If you currently have a 30-year mortgage, refinancing with a 15-year version can save you thousands of dollars in interests over the life of the loan, plus allow you to build equity in your home faster than ever.

Switch to a fixed-rate mortgage. Refinancing with a fixed-rate mortgage gives you the security of knowing that your monthly payment will remain steady, regardless of whether lending rates rise or fall in the years ahead.

Access emergency funds. Something the mortgage industry calls “cash-out refinancing” allows you to take out a new mortgage for more than your current principal balance and use the additional money for other expenses (remodeling, college, a major medical procedure, etc.). Of course, this option should only be considered if you have a real need for the money and a solid plan for paying it back.

Consolidate debt. While consolidating credit card debt under a home loan may not be wise (unless you have a plan for controlling any additional spending), refinancing to consolidate two mortgages at these record-low rates can provide significant savings in both cases.


Things to consider beforehand:

Before moving ahead with a refinance of your own, a number of factors need to be considered (and numbers crunched) before you can determine how much you’ll actually benefit and if you can qualify for the best rates:

Closing costs. The fees associated with refinancing your mortgage are called “closing costs” and generally add up to somewhere between three and six percent of your loan amount (between $7,500 and $15,000 for a $250,000 mortgage refinancing).  While there are ways to lower some of those costs, you’ll still want to weigh those expenses against how much you stand to gain.

For example, let’s say you figure you’ll be able to save $100 per month by refinancing, and you’ve calculated the closing costs at about $10,000. That means you’ll need to continue living in the house for at least eight more years before the savings surpass the closing costs. In the mortgage industry, this is referred to as the break-even point; and the longer you continue living in the house beyond the break-even point, the more money you’ll save.

Your credit score. It depends on the circumstances, but most borrowers will need a credit score of 700 or higher to get access to the best rates and closing costs. To determine your score, get a copy of your credit report from Experian, Equifax and TransUnion. (Why all three? Because, if there’s any difference, most banks will use the lowest score.)

Your current level of home equity. To qualify for refinancing, your current level of “equity” (the difference between the market value of your home and the balance of your current mortgage) typically must be 20 percent or more. That means, if the market value of your home is $250,000, the remaining balance on your loan would have to be $200,000 or less.

Pre-payment penalty. Check to see if your current mortgage includes a pre-payment penalty for refinancing. That would likely make refinancing too expensive even at these record-low rates.


The importance of timing

Mortgage rates have sustained record lows over the last few years, and they will likely stay relatively low for the next few years. However, even a small increase can make a drastic change in the amount of money you will pay over the duration of your loan. Getting the lowest rate you can, will benefit your finances over the long-term.

Getting the process started is easy. Begin by checking your equity and credit score, then crunch the numbers using one of the many online mortgage calculators. 

If the initial results look promising, ask your Windermere Real Estate agent for a recommendation on a reputable lender (or mortgage broker) who can provide you with an actual quote. 

Living July 15, 2016

3 Garden Alternatives for a Patchy Lawn

I’ve met with more than one client while standing on a struggling lawn. “I keep trying,” they tell me, “but the grass won’t grow.” I tell them that maybe this means there’s another option, something even better than a lawn. Maybe it’s time for a garden. And it’s as if I’d just told them the secret to eternal happiness and long life.

Still Have Hope for Greener Grass? Ask a Lawn Professional

Don’t keep tossing grass seed on your bare lawn. Instead, put a garden there, or at least plant something that has a better chance of surviving. Here are three situations where a languishing lawn may call for a new vision — a self-supporting garden that wildlife will love to call home.

BE Landscape Design, original photo on Houzz


1. Blazing sun. Whether it’s out in the open on a flat grade, on a slope or atop a hill, lawn just never does well in hot sunshine. It burns away each August, opening up holes for advantageous weeds to move in. 

You could seed or plant drought-tolerant native grasses like sideoats grama and blue grama (Bouteloua curtipendula and B. gracilis) and little bluestem (Schizachyrium scoparium). Or try sedges like shortbeak and Bicknell’s (Carex brevior and C. bicknellii). And while you’re at it, get some flowers. If it’s a larger area, think self-sowers like upright prairie coneflower (Ratibida columnifera), black-eyed Susan (Rudbeckia hirta) and skyblue aster (Symphyotrichum oolentangiense). For smaller areas, ‘October Skies’ aromatic aster (S. oblongifolium ‘October Skies’) works well, along with pale purple coneflower (Echinacea pallida), purple and white prairie clover (Dalea purpurea and D. candida), many species of Baptisia, and more.

Try to create a base layer of sedges and grasses that will work to mulch and cool the soil, adding clumps or drifts of flowers among them for seasonal interest and pollinator action.

Attract Pollinators for a Productive Edible Garden


Anne Roberts Gardens, Inc., original photo on Houzz


2. Ponding water. After a heavy — or even moderate — rain, water may collect in an area of your lawn, drowning grass for days or even weeks. When that water finally vanishes, you’re left with barren soil that’s both unsightly and open to weed invasion.

This sounds like an area where rain garden plants may work. These are the plants that thrive in the boom-bust cycle of spring and fall flooding with dry summers. Swamp milkweed (Asclepias incarnata), Virginia mountain mint (Pycnanthemum virginianum), Joe Pye weed (Eutrochium purpureum), switchgrass (Panicum virgatum), muskingum sedge and fox sedge (Carex muskingumensis and C. vulpinoidea), New England aster (Symphyotrichum novae-angliae), queen of the prairie (Filipendula rubra), white turtlehead (Chelone glabra), and Culver’s root (Veronicastrum virginicum) are all good options.

If it’s a large area and you want privacy, a shrub hedgerow is an option. Plant redtwig dogwood (Cornus sericea), red or black chokeberry (Aronia arbutifolia and A. melanocarpa), or elderberry (Sambuca sp.) — they will slowly sucker to form a massive bird and native bee habitat.

Sisson Landscapes, original photo on Houzz


3. Dark or dappled shade beneath a tree. Trees are great: They cool homes, clean the air and provide for so much wildlife. Oaks (Quercus spp.), maples (Acer spp.), elms (Ulmus spp.) and willows (Salix spp.) are near the top in serving a diversity of pollinators and other insects, specifically, that use the leaves and blooms at different life stages. But grass doesn’t often grow underneath these tall trees — mostly because they cast dense shade.

If you have rich, moist to medium soil, there are many spring ephemerals to choose from: Dutchman’s breeches (Dicentra cucullaria), trillium (Trillium spp.), shooting star (Dodecatheon meadia), yellow trout-lily (Erythronium rostratum) and Virginia bluebells (Mertensia virginica).

For gardeners with dry clay soil, early meadow-rue (Thalictrum dioicum), zigzag goldenrod (Solidago flexicaulis), calico aster (Symphyotrichum lateriflorum) and wild geranium (Geranium maculatum) are solid choices. Sprengel’s sedge (Carex sprengelii) is a grass-like option.

If you don’t want a large bed of strictly plants, weave a path of mulch or stepping stones through. Place a chair or two, a hammock, or a potting bench.

The Philbin Group Landscape Architecture, original photo on Houzz


It’s always important to carefully research the plants before you buy them to make sure that they suit your conditions. Clay soil is different from sand or rocky loam, and while some plants may do well in several kinds of soil and light conditions, others won’t. You may also prefer plants that create short drifts rather than tall ones, or vice versa, or clumping plants instead of aggressive spreaders.

When you take the time to carefully match the plant to the site and your region, you’re setting yourself up for more success and beauty with less maintenance — unlike sowing grass seed over the same area year after year.


By Benjamin Vogt, Houzz

More July 13, 2016

Windermere Foundation Quarterly Report


Dear friends of the Foundation,

Thanks to your generous donations, the Windermere Foundation has collected nearly $818,000 in donations during the first half of 2016. This is an increase of 11 percent compared to this time last year! Individual contributions and fundraisers accounted for 61 percent of the donations, while 39 percent came from donations through Windermere agent sales transactions. So far, we have raised $31,677,000 in total donations since 1989.

Each Windermere office has its own Foundation fund account that they use to provide grants to organizations in their communities. Year to date, a total of $793,000 has been disbursed to non-profit organizations dedicated to providing services to low-income and homeless families throughout the Western U.S.


One recipient of Windermere Foundation funds was the Brigid Collins Family Support Center in Mount Vernon, Washington. The center is dedicated to ending child abuse by protecting children and building strong families. Founded in 1990, Brigid Collins Family Support Center is the legacy of a core group of volunteers who had a hope of better coordinating the community’s response to child abuse. Today, they have grown to serve more than 2,000 families each year throughout the Northwest corner of Washington State.

Here is how the Foundation donation from the Windermere Mount Vernon office has made an impact on this organization…


“Thanks to you, three-year-old Lucas, who was being neglected, is now thriving at home and in day care. Your generous contribution will help support services for children. Your care, concern and commitment are what make a difference for these children in our community.” ~Brigid Collins Family Support Center


Thank you to everyone who supports the Windermere Foundation. Because of you, kids like Lucas have the care they need to thrive. If you’d like to help support programs in your community, please click on the Donate button.


To learn more about the Windermere Foundation, visit http://www.windermere.com/foundation.