
 Facebook
 X
X
 Pinterest
 Copy Link

The following analysis of select counties of the Southern California real estate market is provided by Windermere Real Estate Chief Economist Matthew Gardner. We hope that this information may assist you with making better-informed real estate decisions. For further information about the housing market in your area, please don’t hesitate to contact your Windermere Real Estate agent.
Regional Economic Overview
Total employment in the counties covered by this report has risen more than 600,000 jobs over the past year, recovering 97.3% of the jobs lost due to the pandemic. Unsurprisingly, Los Angeles County still has the largest shortfall (-254,000 jobs), followed by Orange County (-44,100) and San Diego County (-15,000). Riverside and San Bernardino counties are now well above pre-pandemic employment levels. The region’s unemployment rate in May was 3.6%, down from 8.2% a year ago. The lowest rates were in Orange County (2.4%) and San Diego County (2.7%). The highest unemployment rate was in Los Angeles County, where 4.5% of the labor force was without a job. The Inland Empire continues to outperform, and I am hopeful that the rest of the region will return to pre-pandemic employment levels by the end of the year. However, it’s likely that Los Angeles County may take somewhat longer to fully recover due to its size.
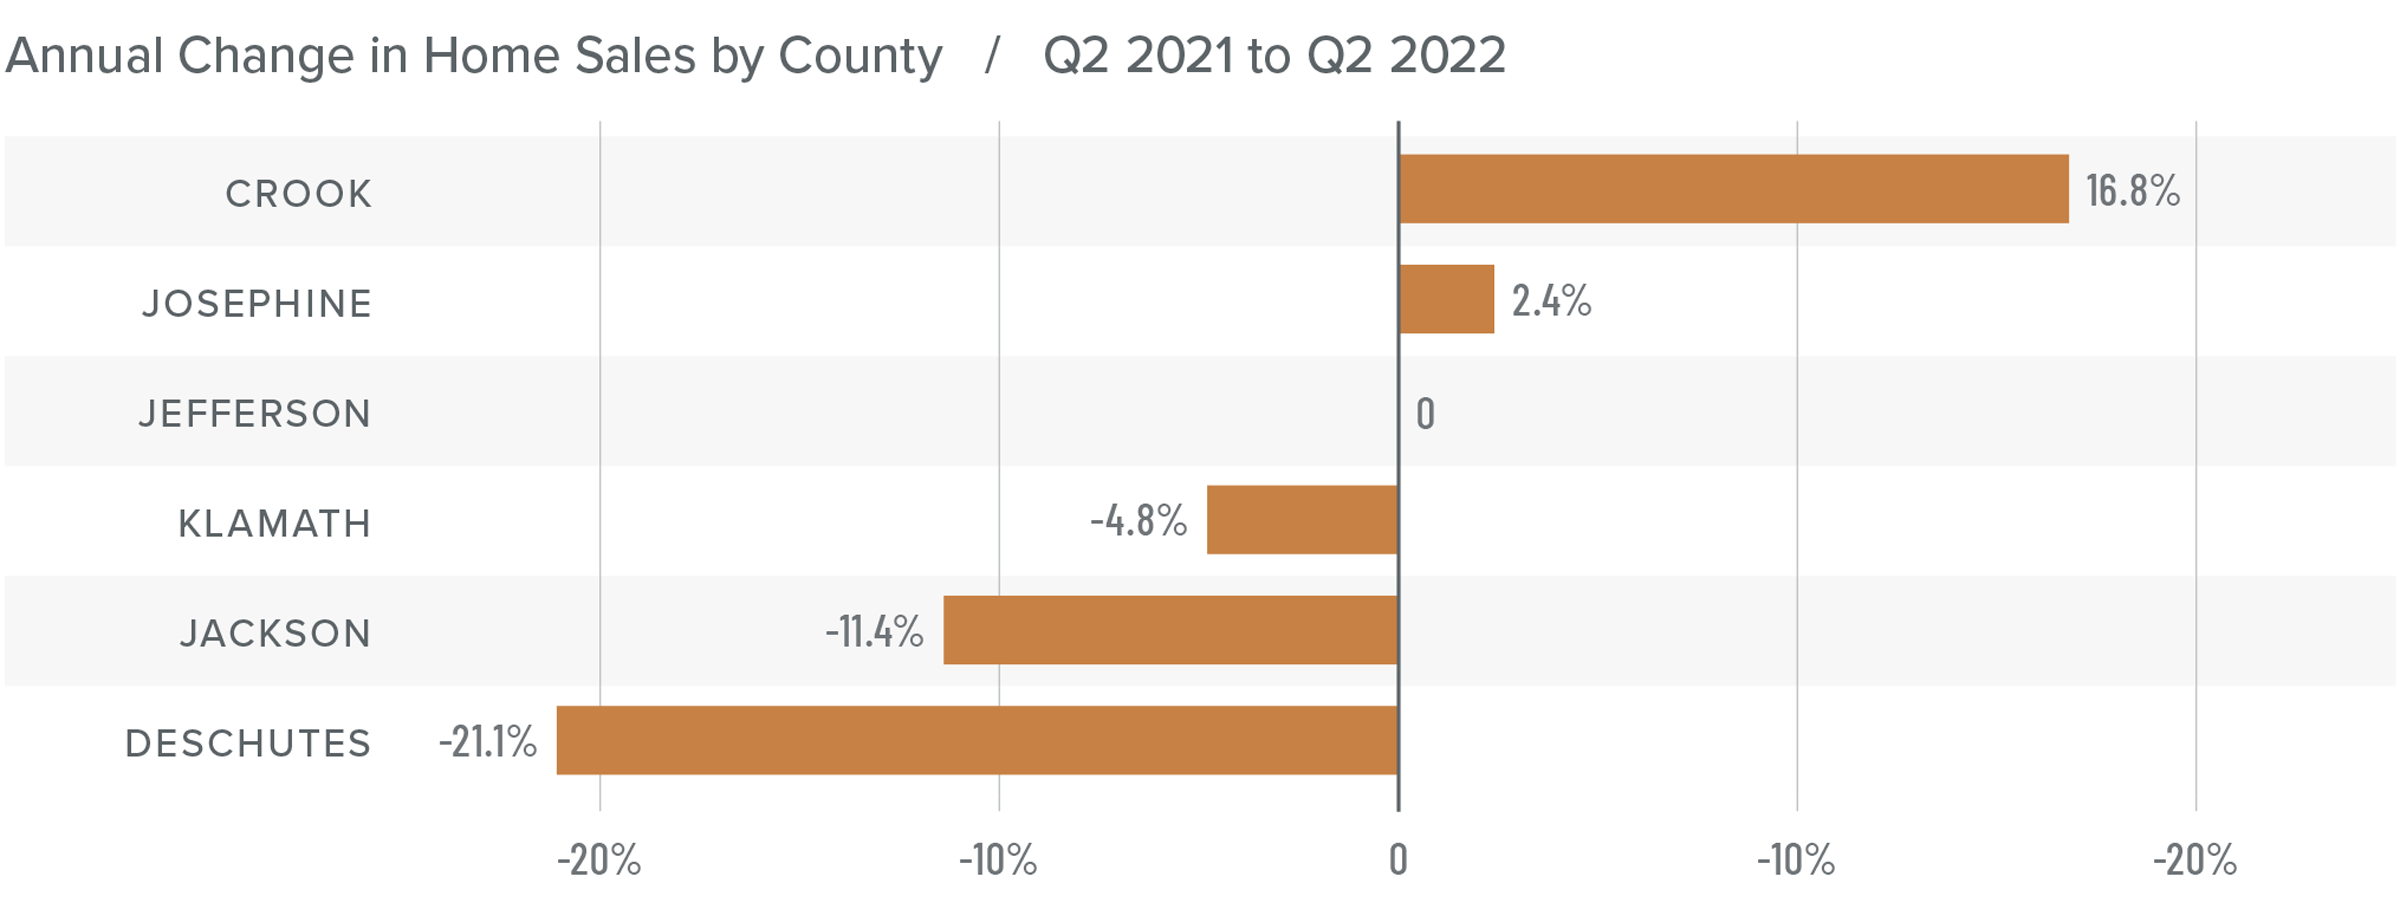
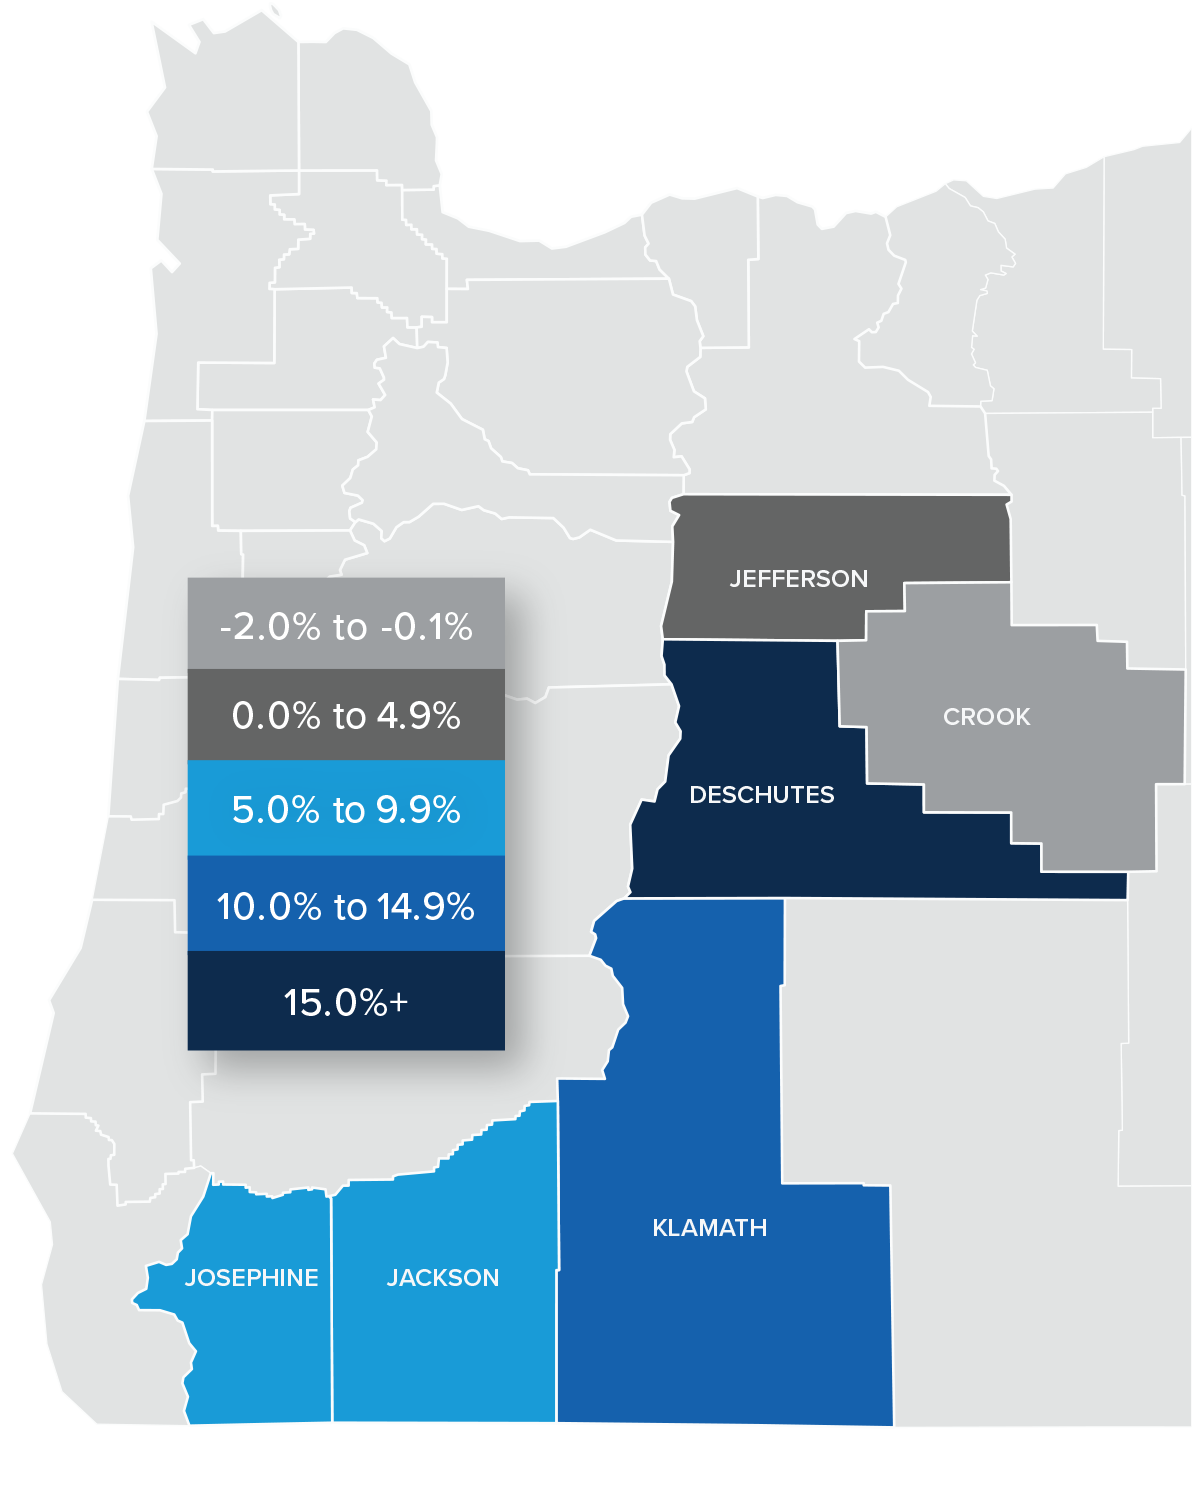
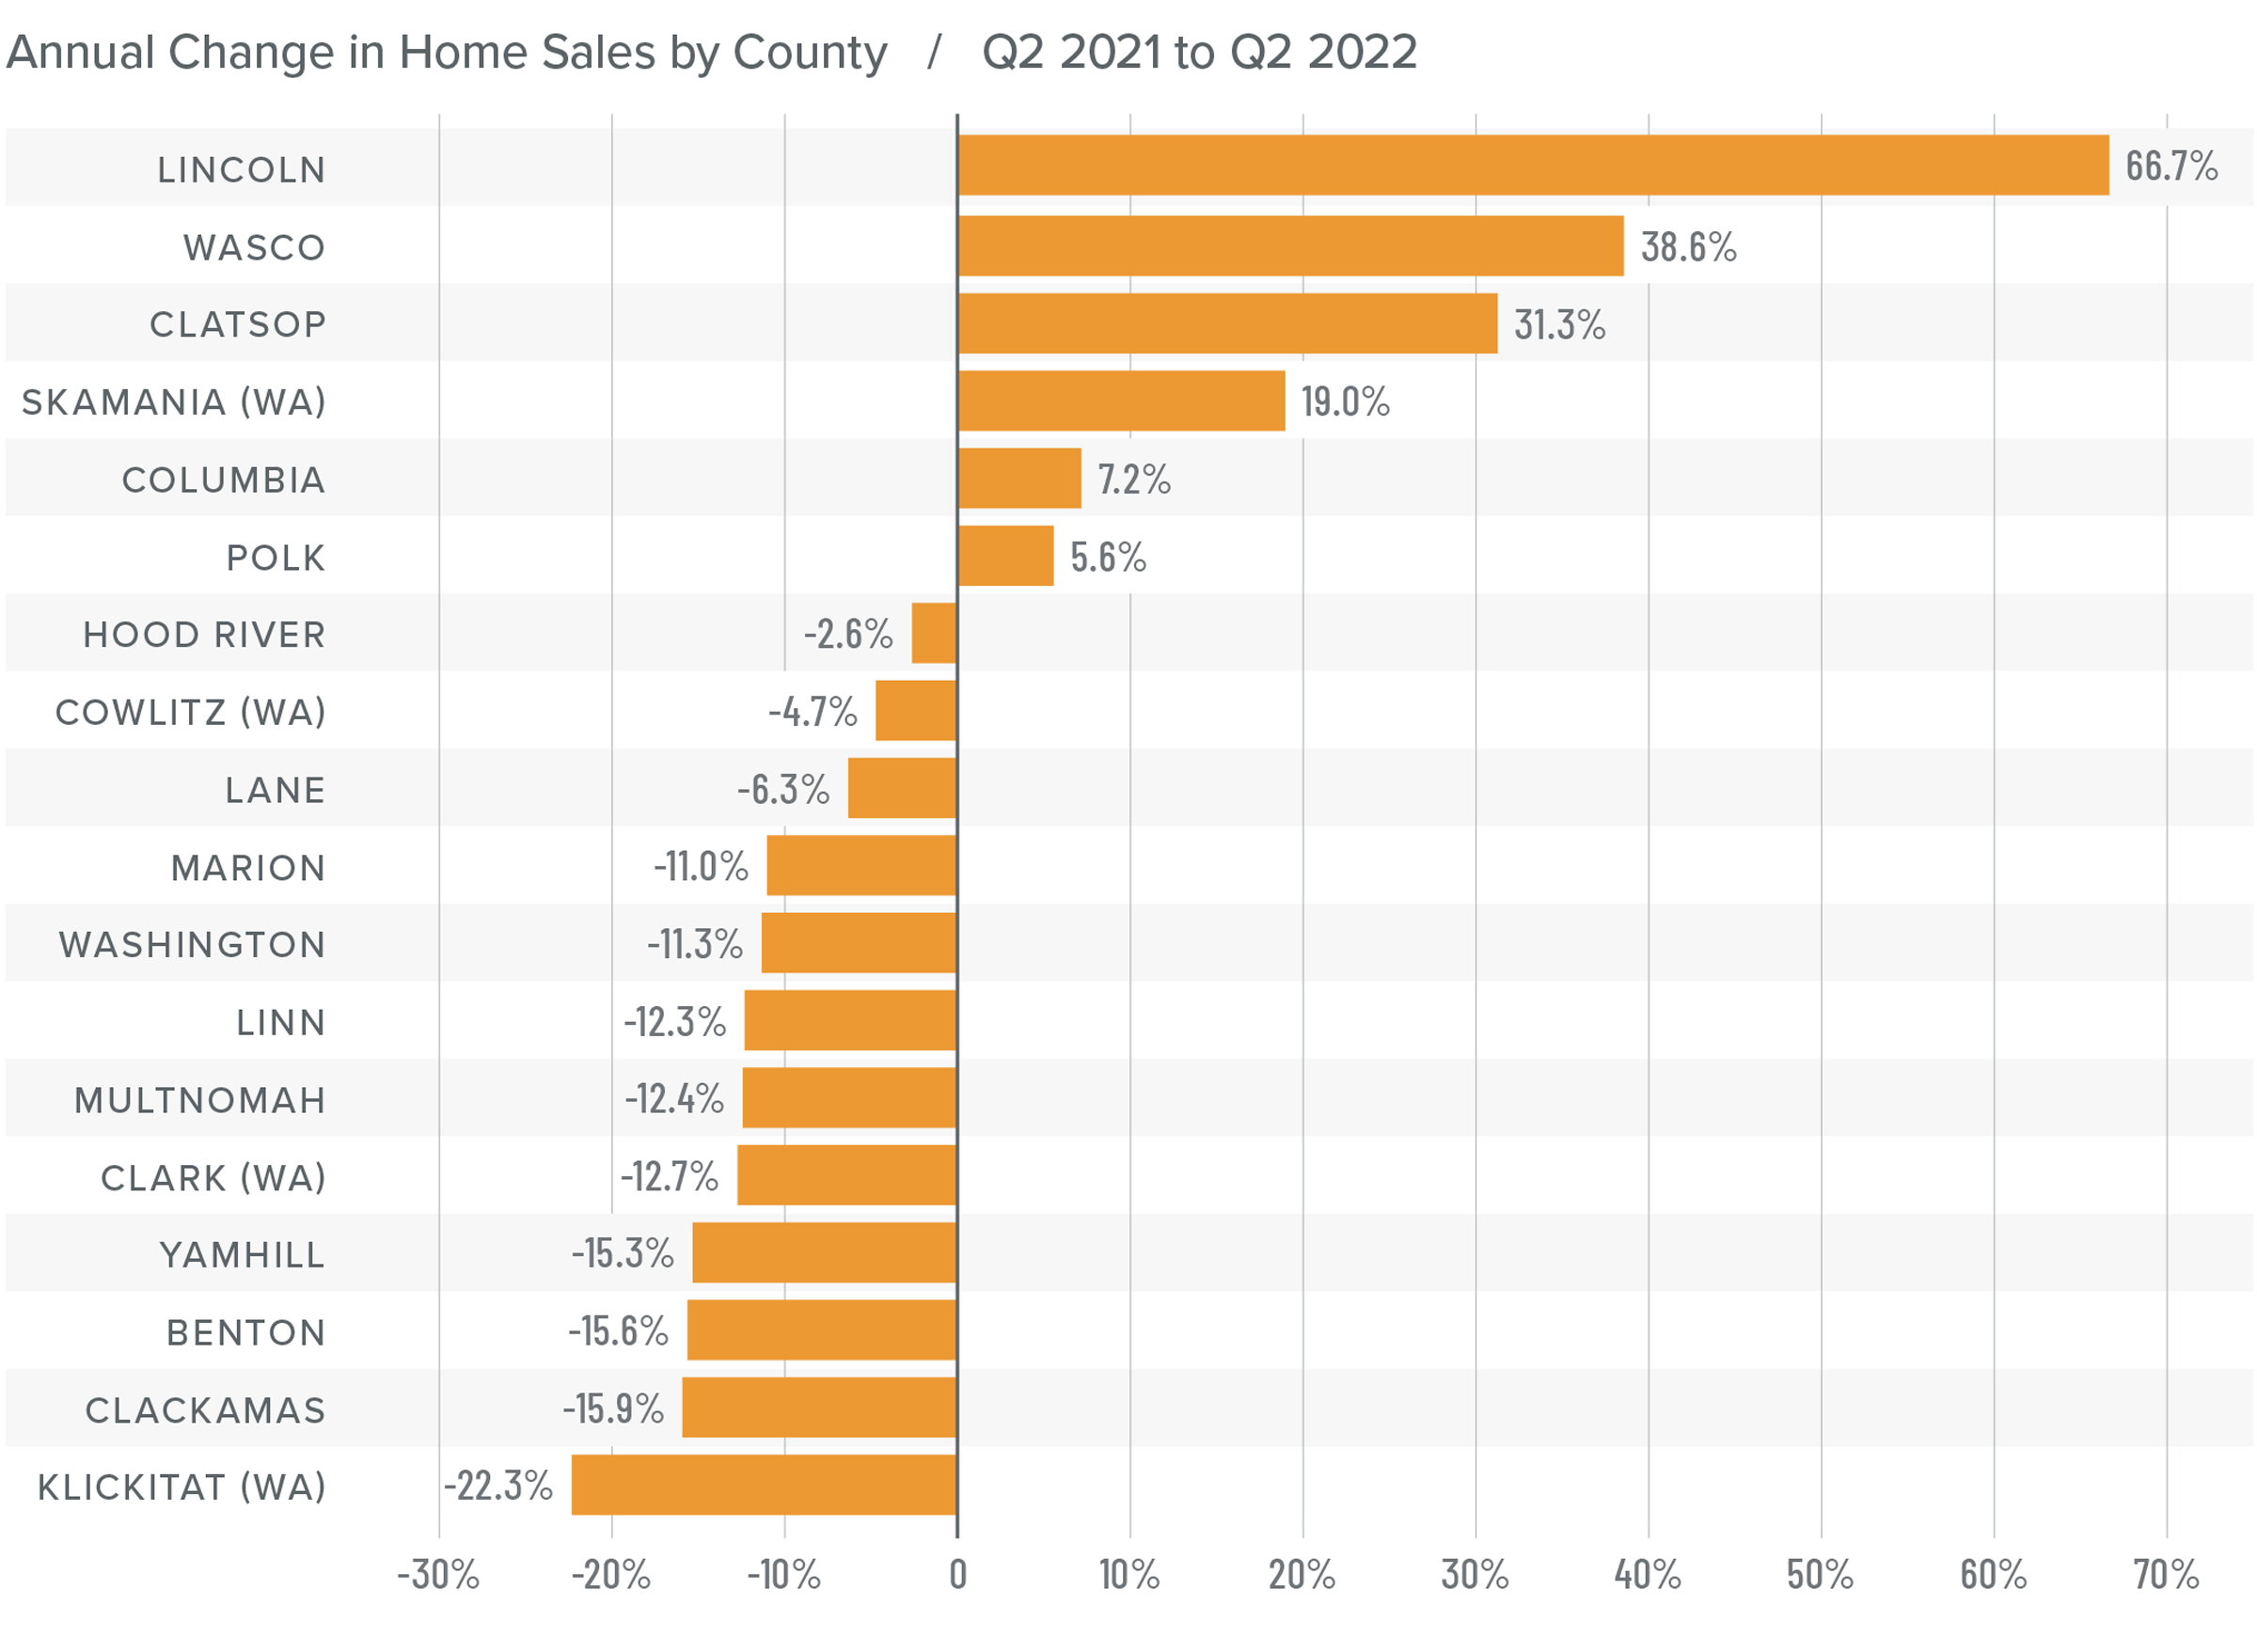
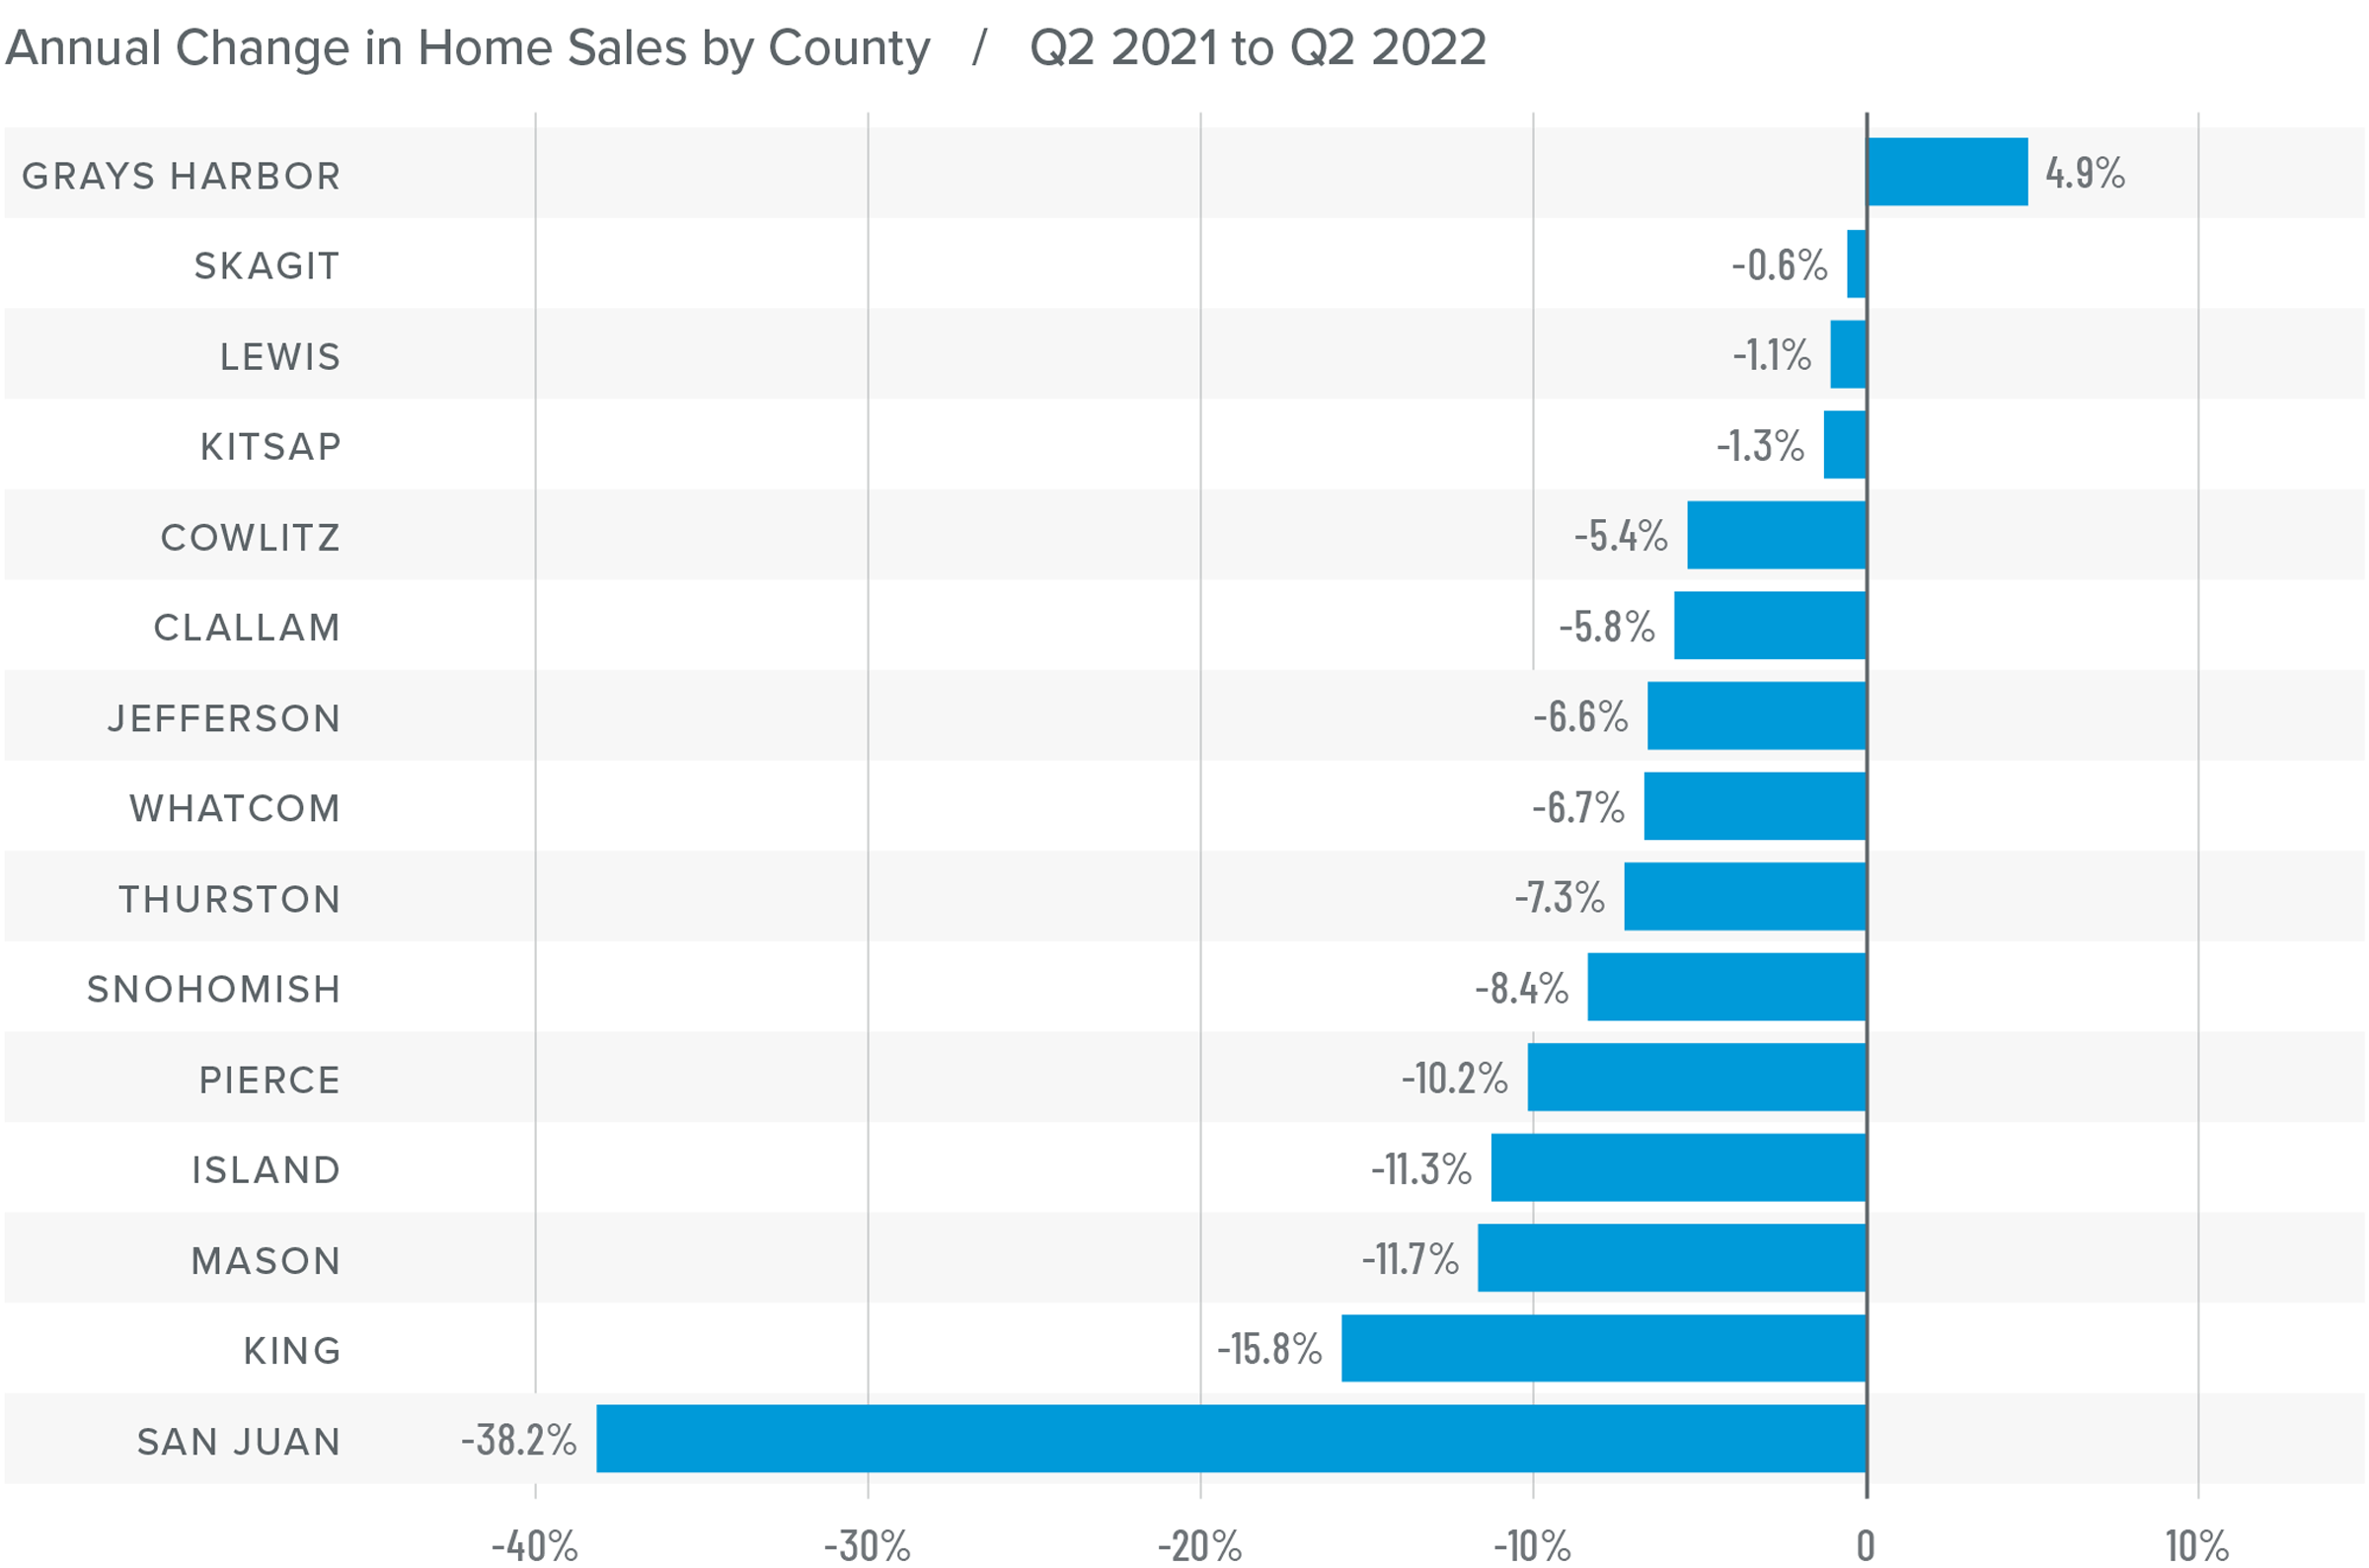
Southern California Home Sales
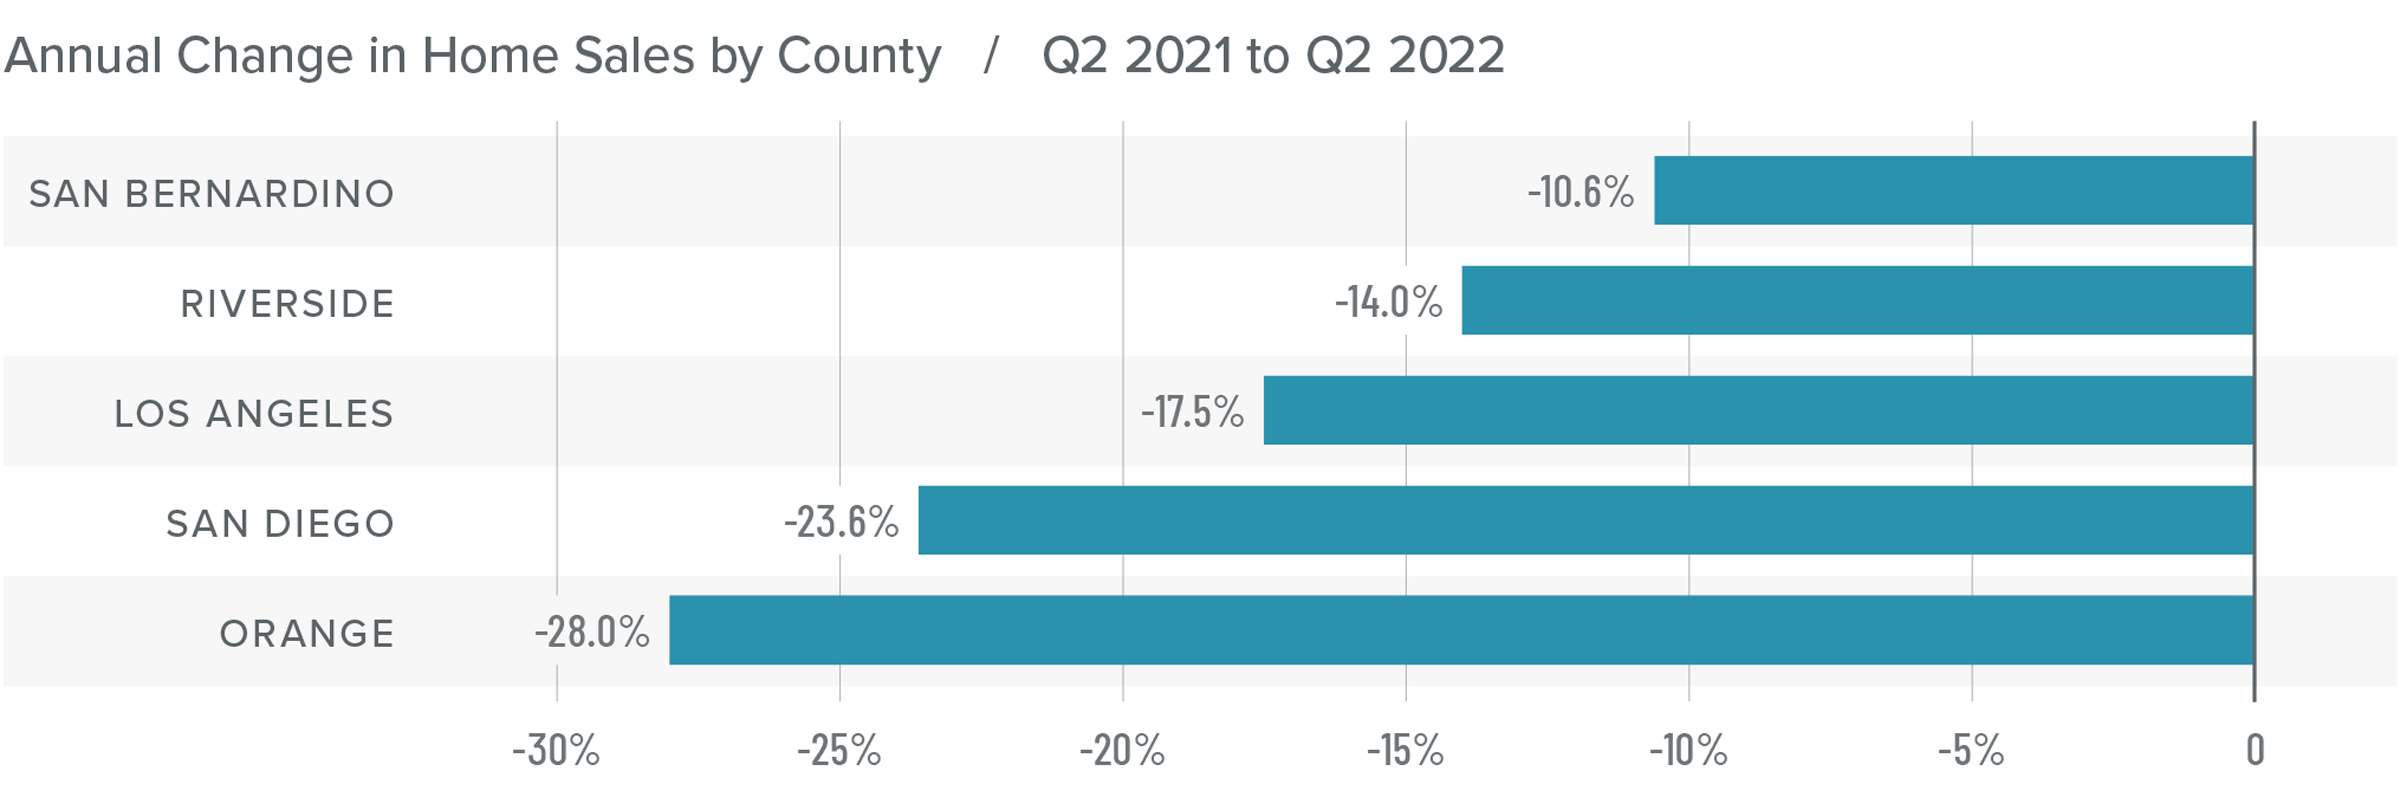
❱ In the second quarter, 47,596 homes sold, down 19% from a year ago but up 13.1% compared to the first quarter of the year.
❱ Pending home sales, which are an indicator of future closings, were down modestly from the first quarter. However, I still expect that the summer will see a decent number of sales.
❱ The largest drop in sales was in Orange County, but all markets saw significant declines. That said, the spring market was in place in San Diego, Los Angeles, and Orange counties, which experienced double-digit percentage increases in sales compared to the prior quarter.
❱ Listing activity has risen across the region, which has given buyers more in the way of choice. That may explain, to a certain degree, why pending sales have pulled back; buyers are not feeling as pressured as they were when inventory was very low.
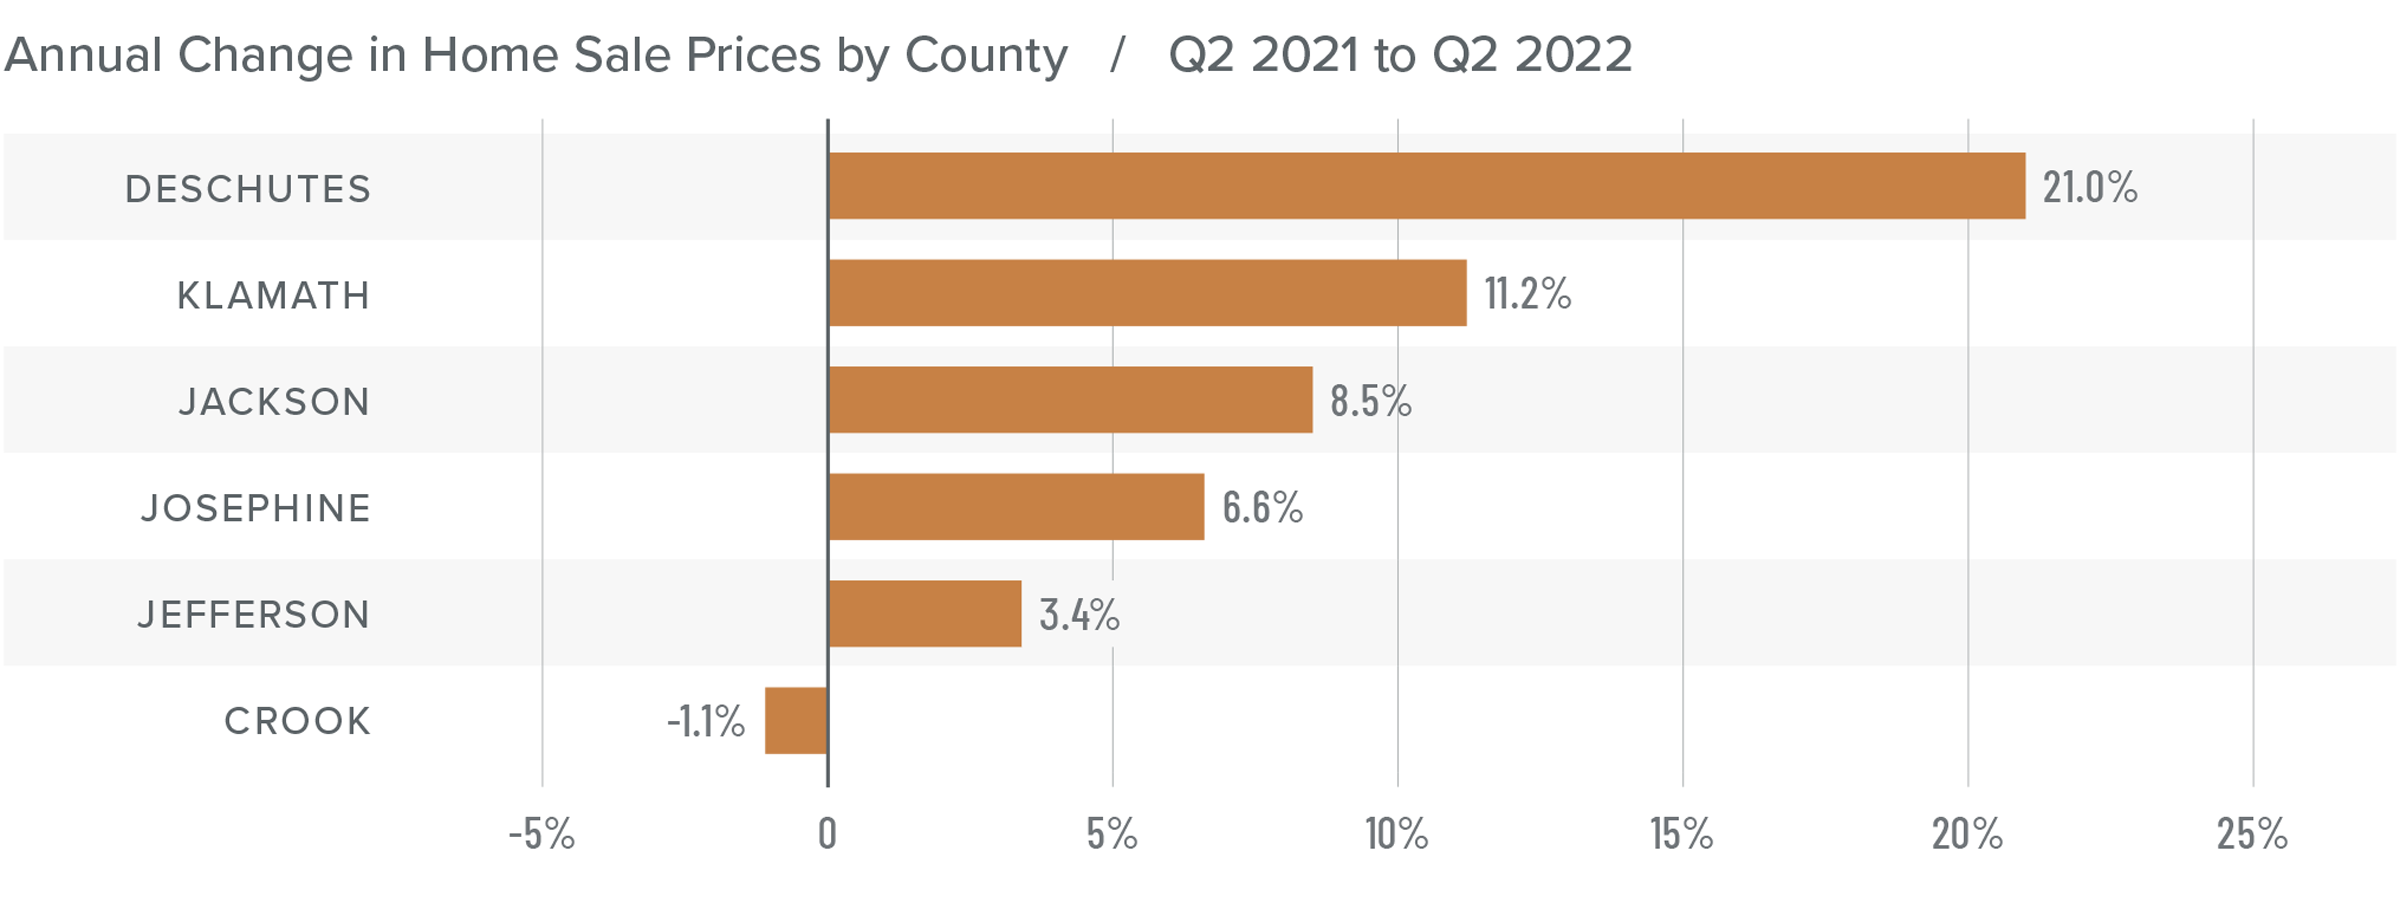
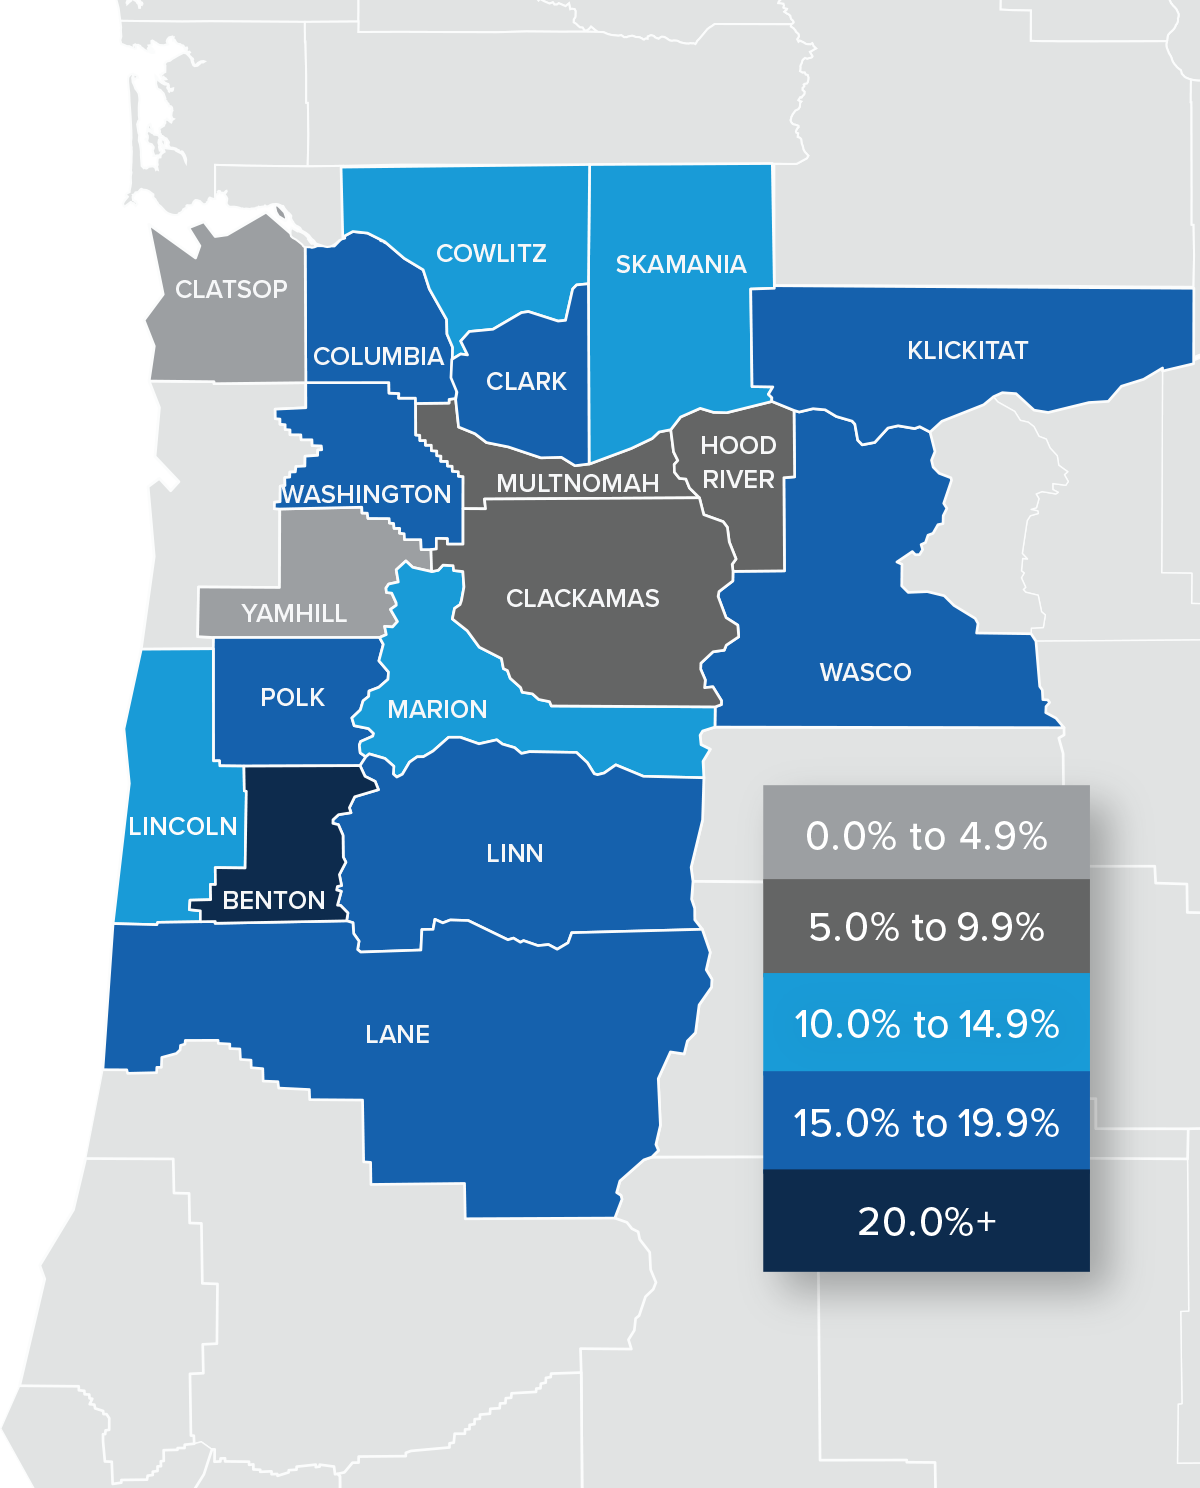
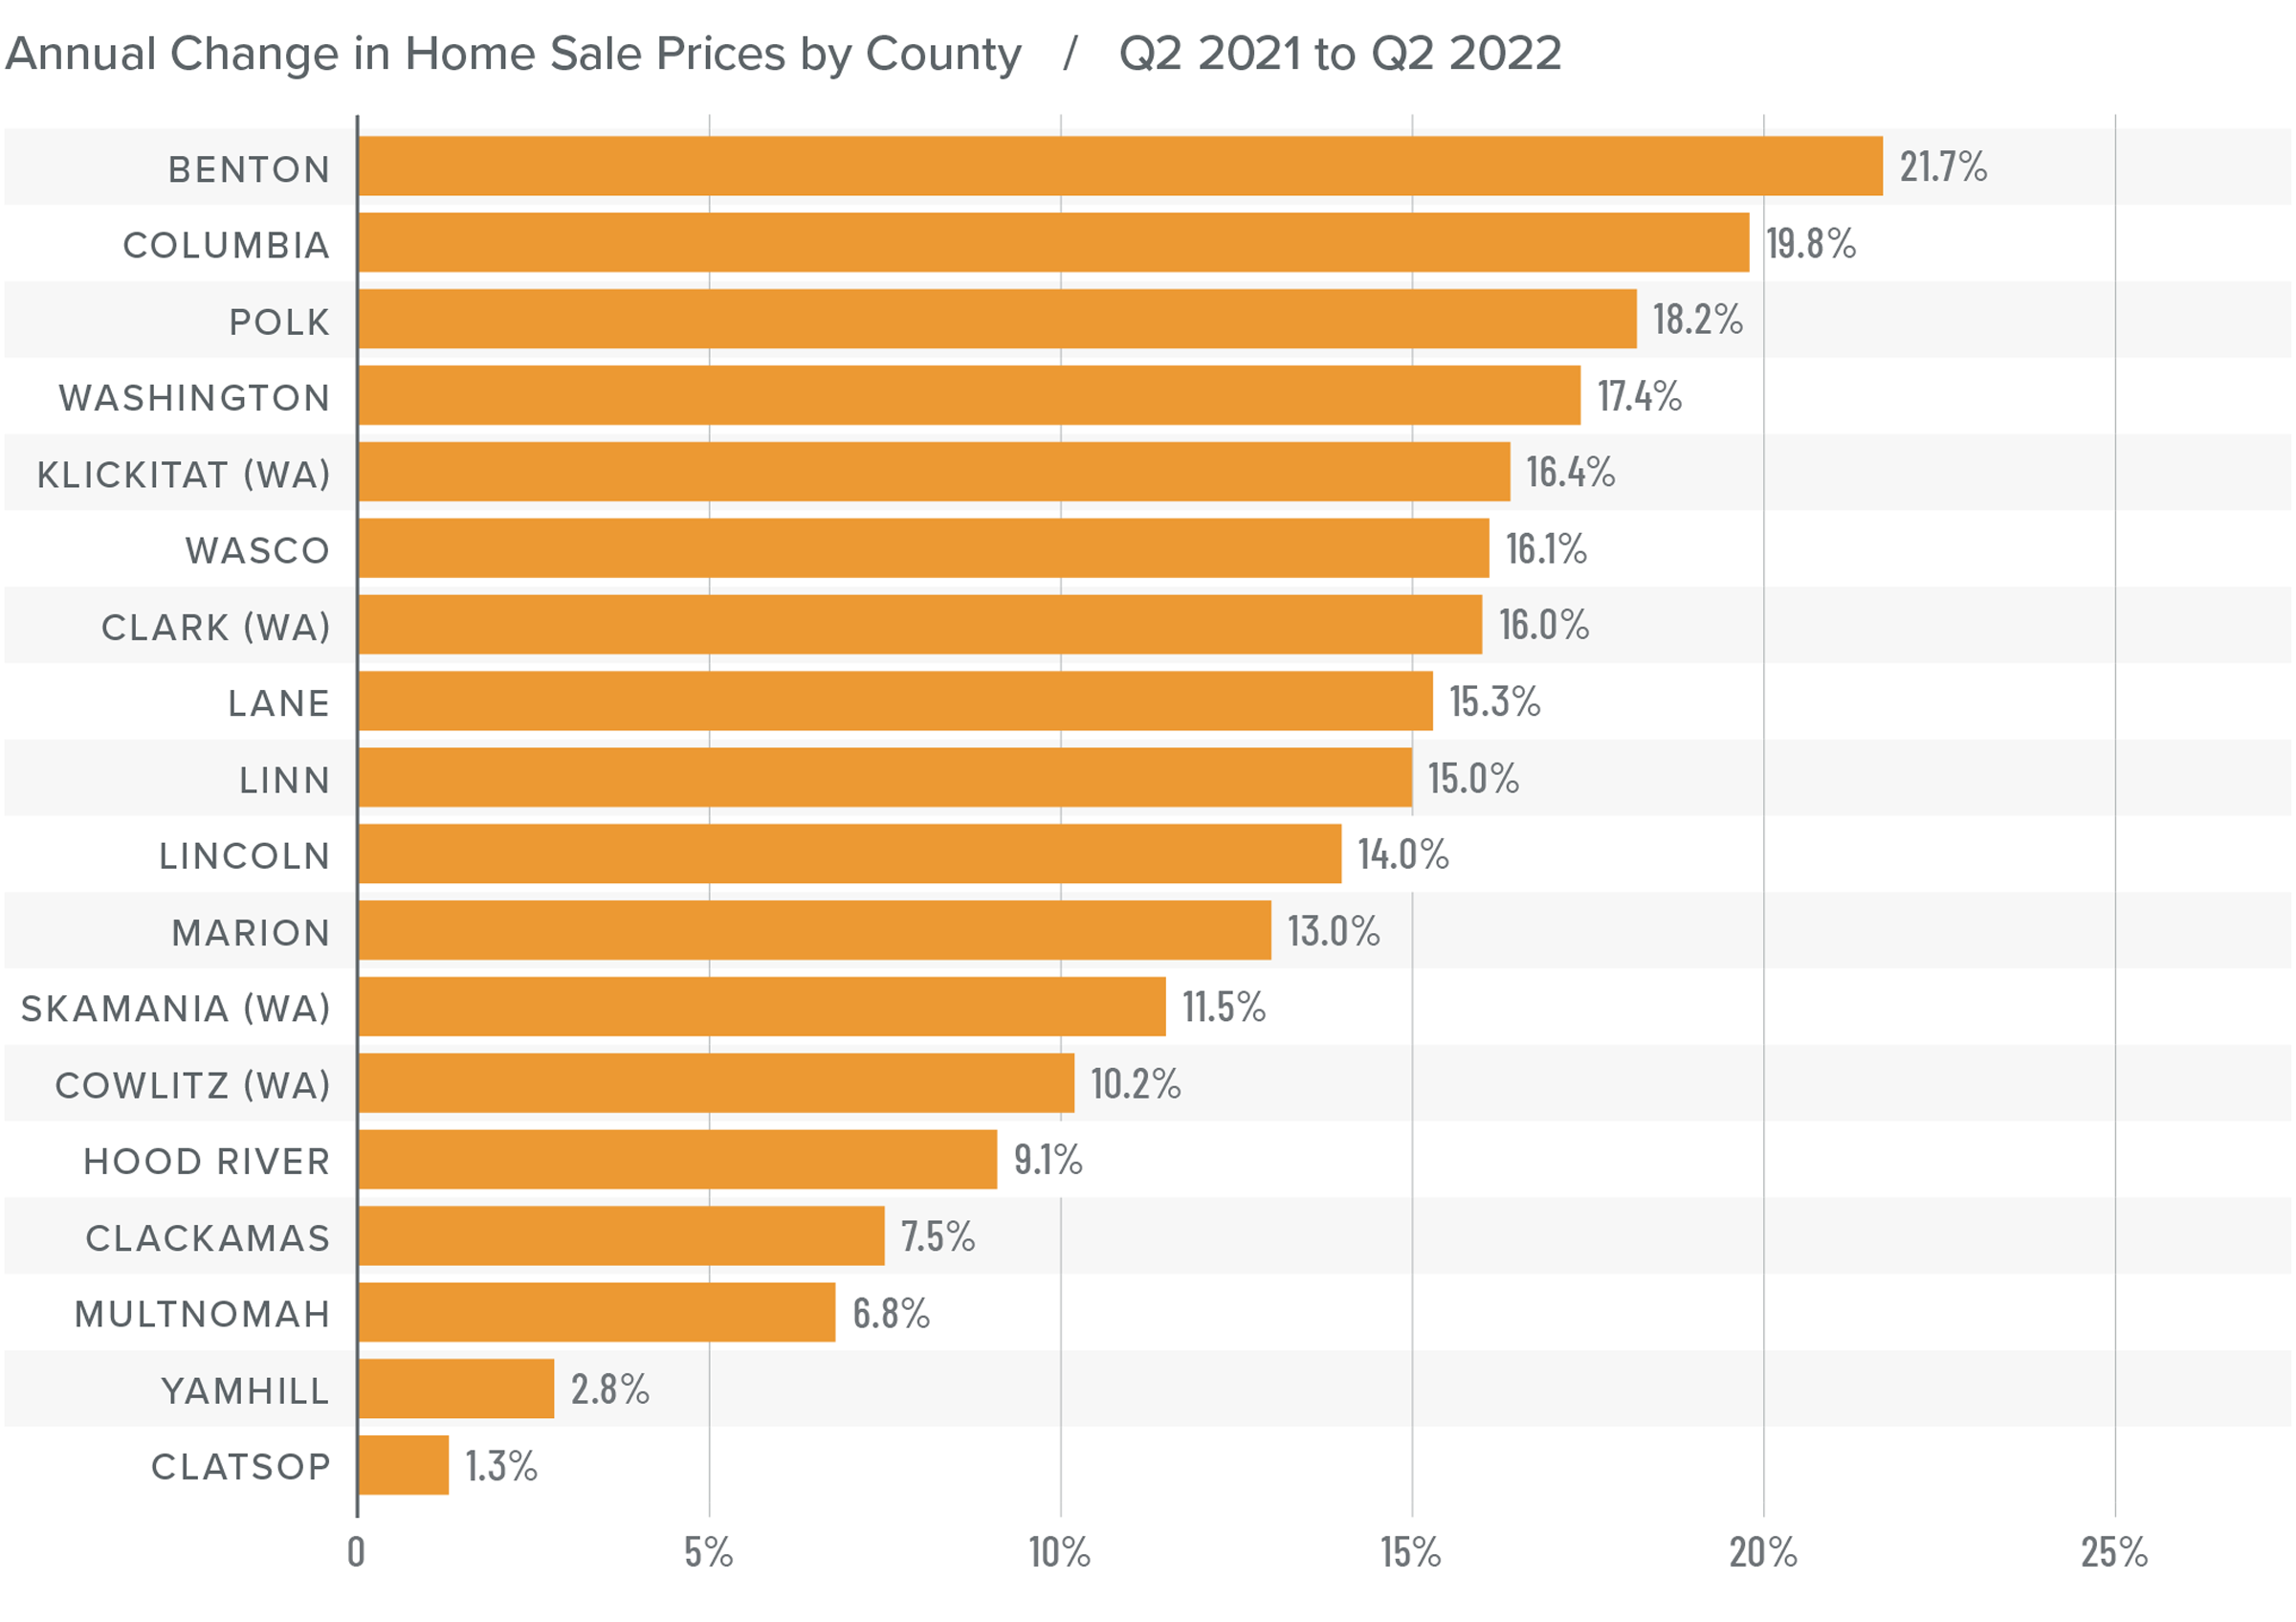
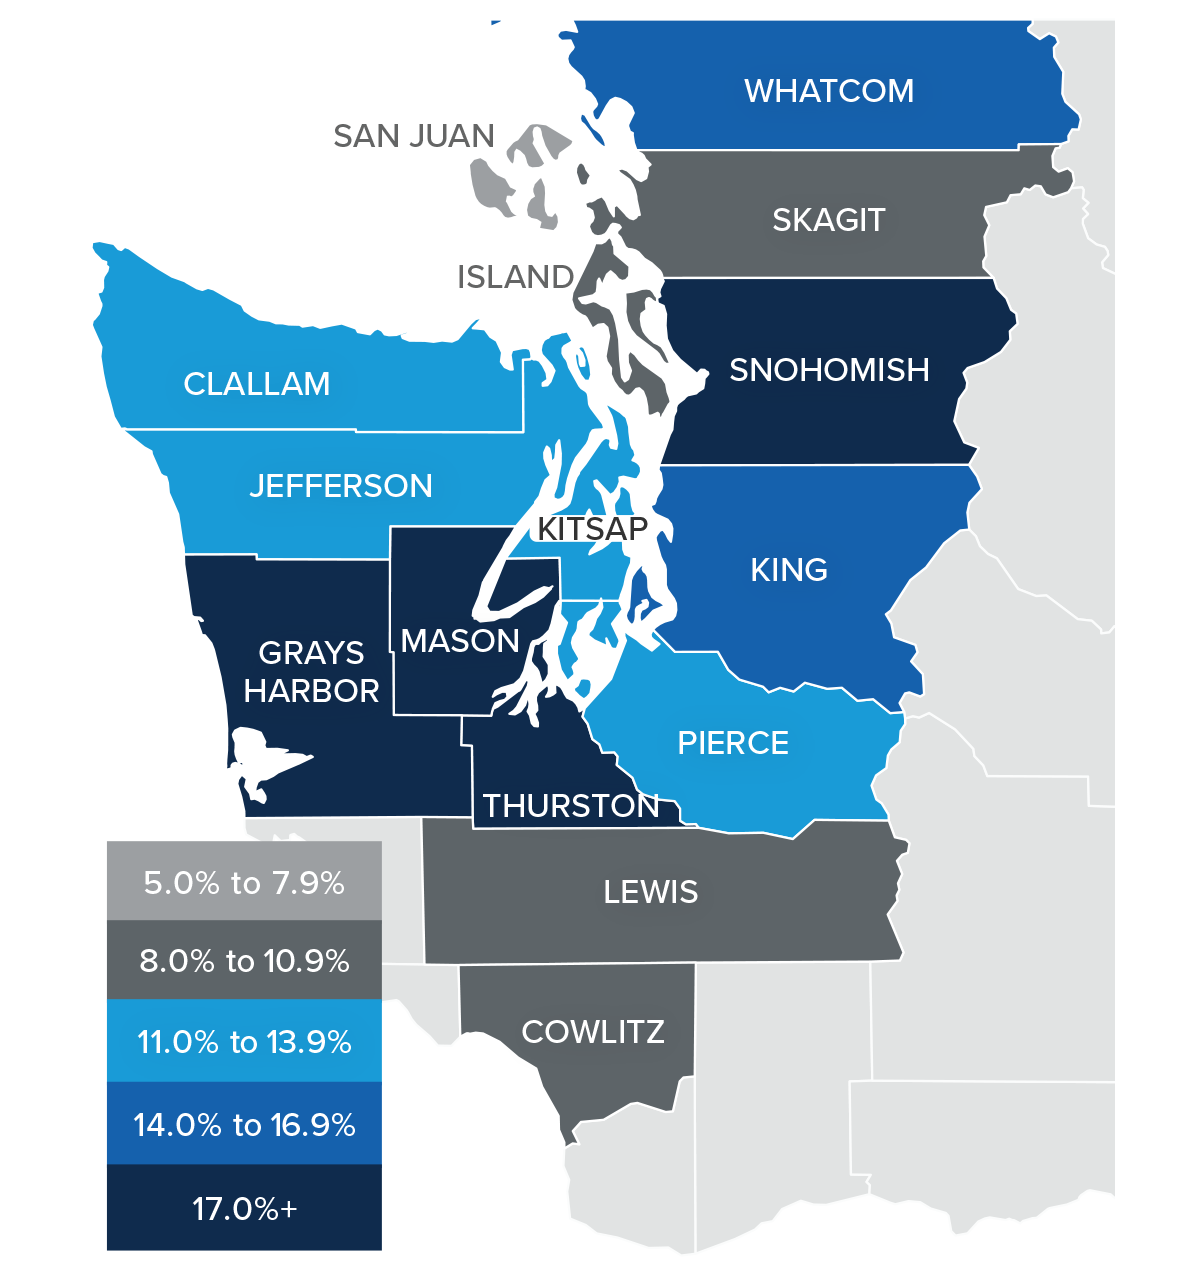
Southern California Home Prices
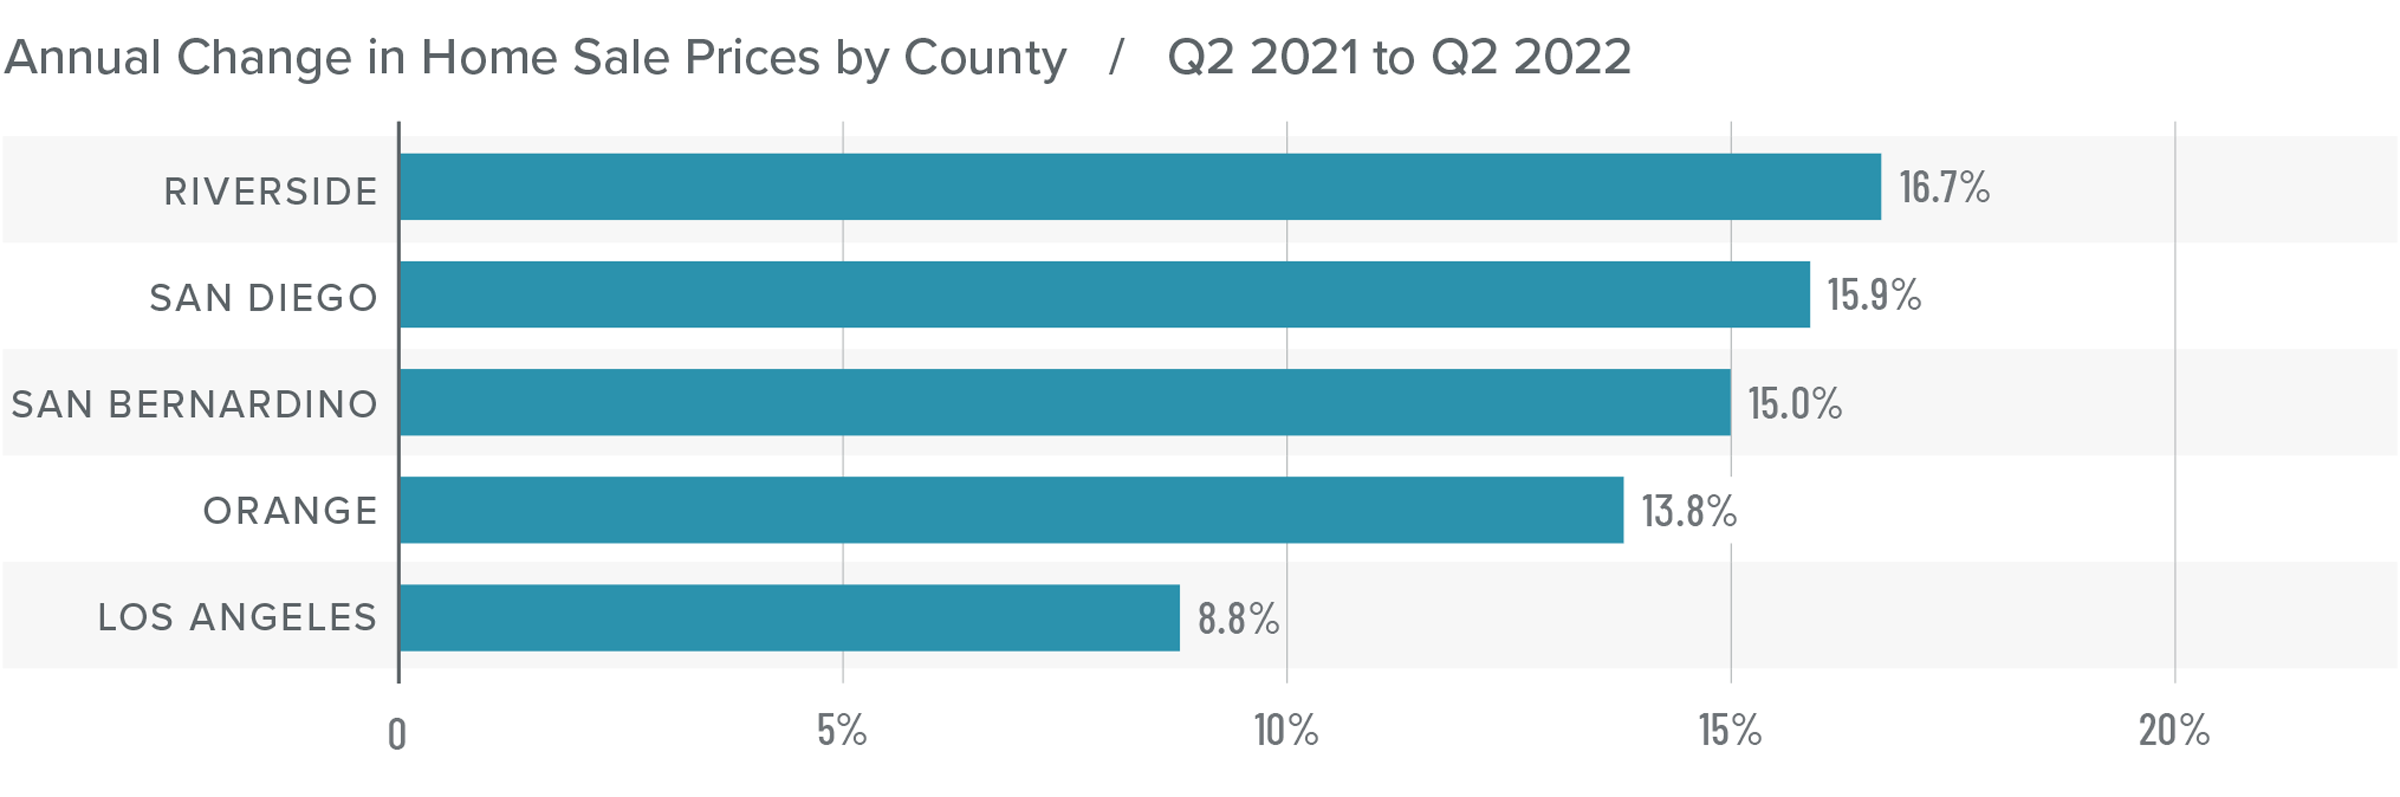
❱ Home prices in the second quarter rose 10.9% compared to a year ago and were 5.4% higher than in first quarter of 2022.
❱ Rising mortgage rates have not had as much of an impact as some expected, but increased financing costs appear to have taken at least some of the heat off the market, as demonstrated by the slowing pace of price growth compared to 2021.
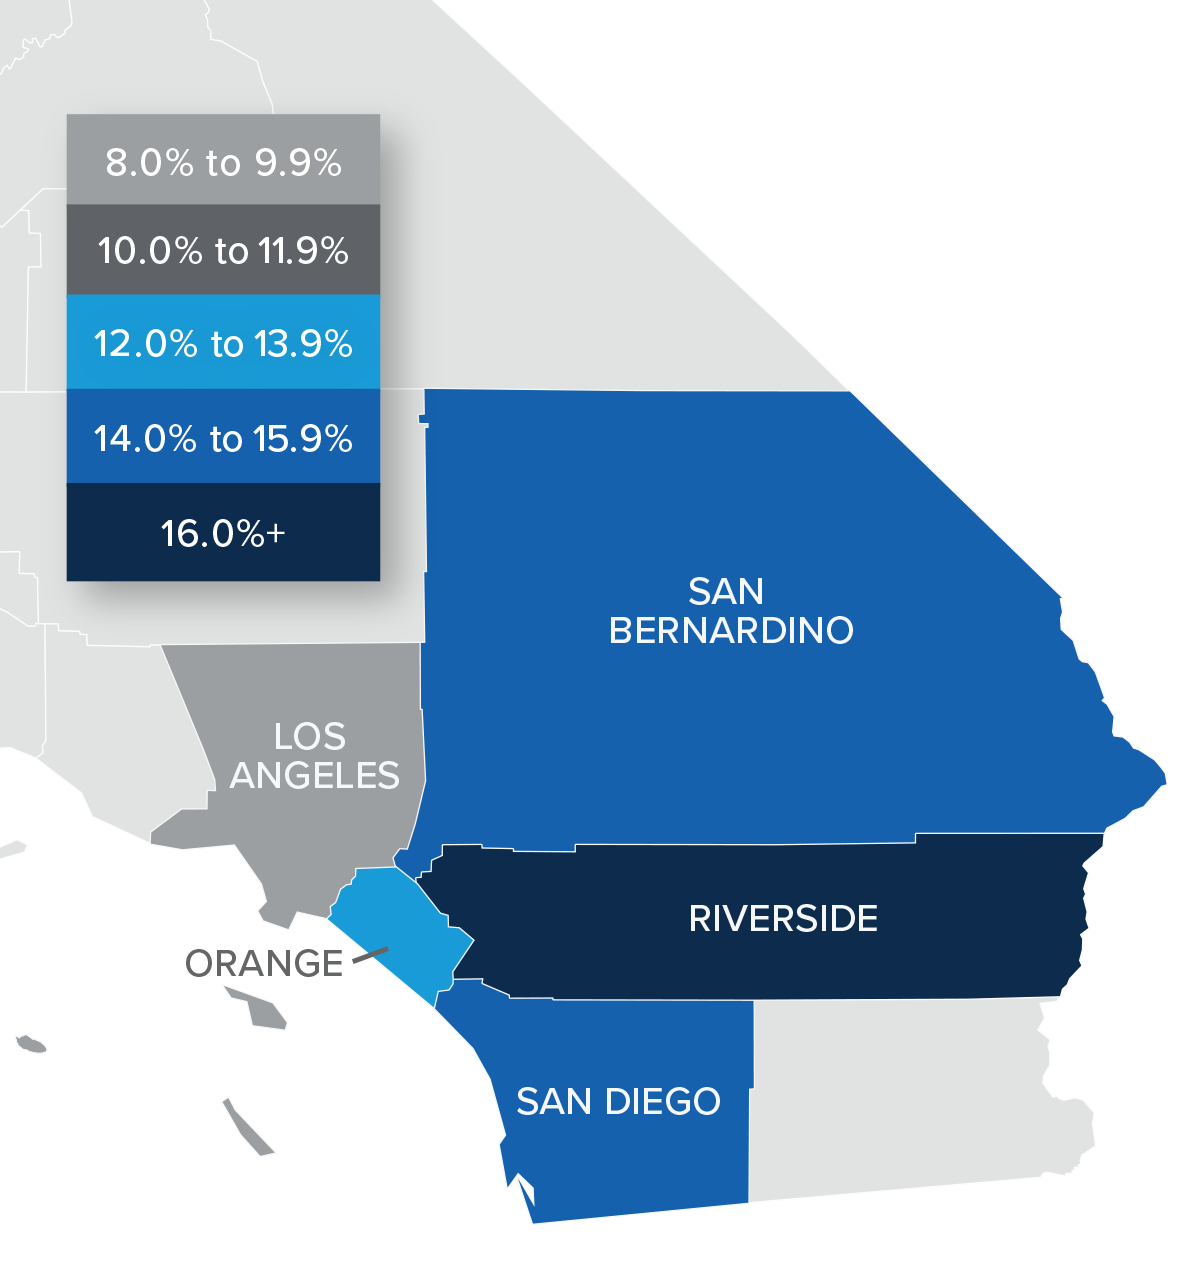
❱ There was double-digit price growth in every county other than Los Angeles. Riverside County led the way with prices rising by 16.7%. The rest of the region also saw very impressive sale price growth.
❱ With relatively high mortgage rates and more homes coming to market, I have started to watch list prices closely. Compared to the first quarter, median list prices are still up an average of 8.7%, suggesting that sellers remain rather bullish.
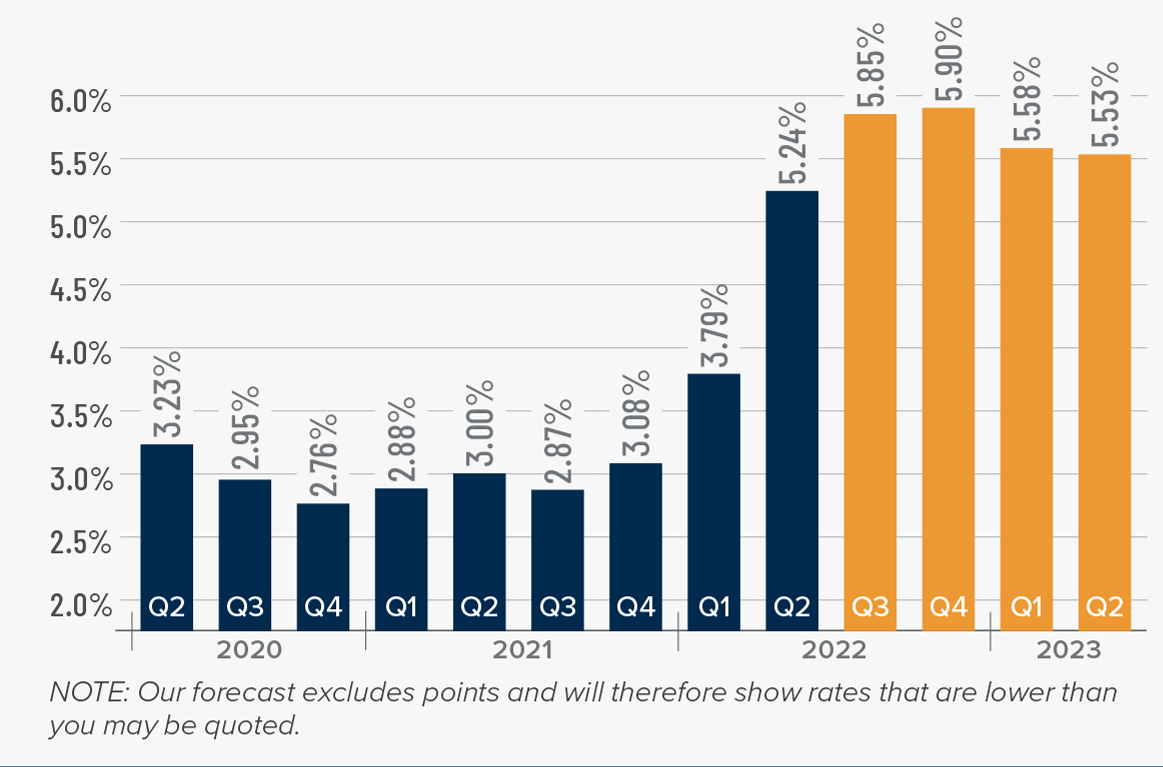
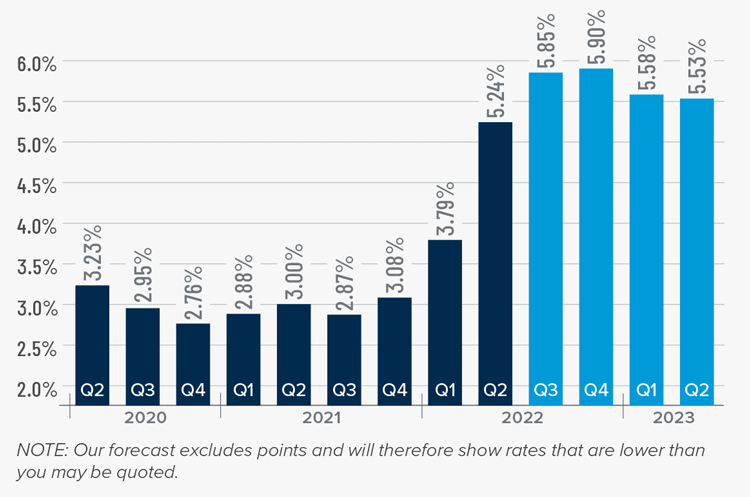
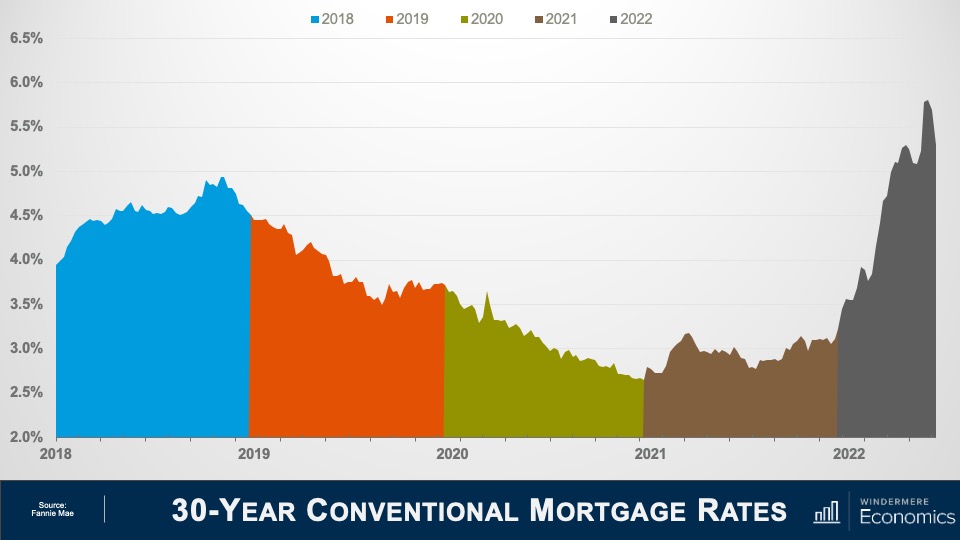
Mortgage Rates
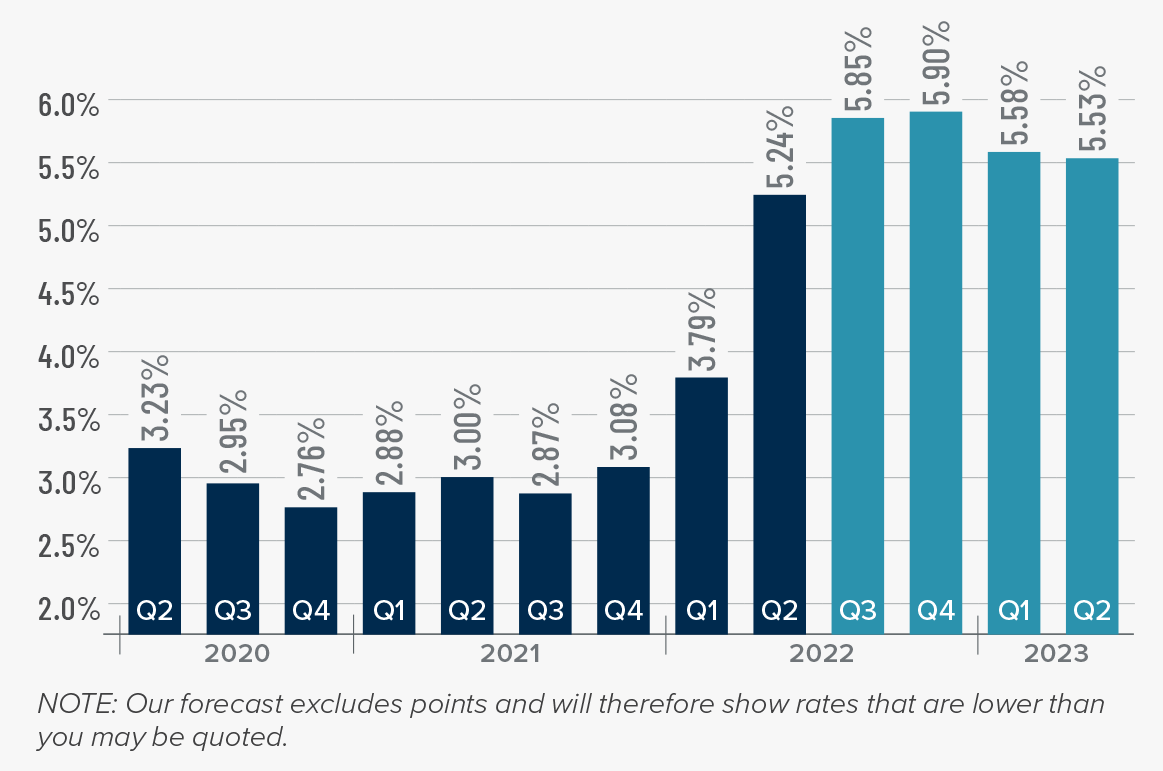
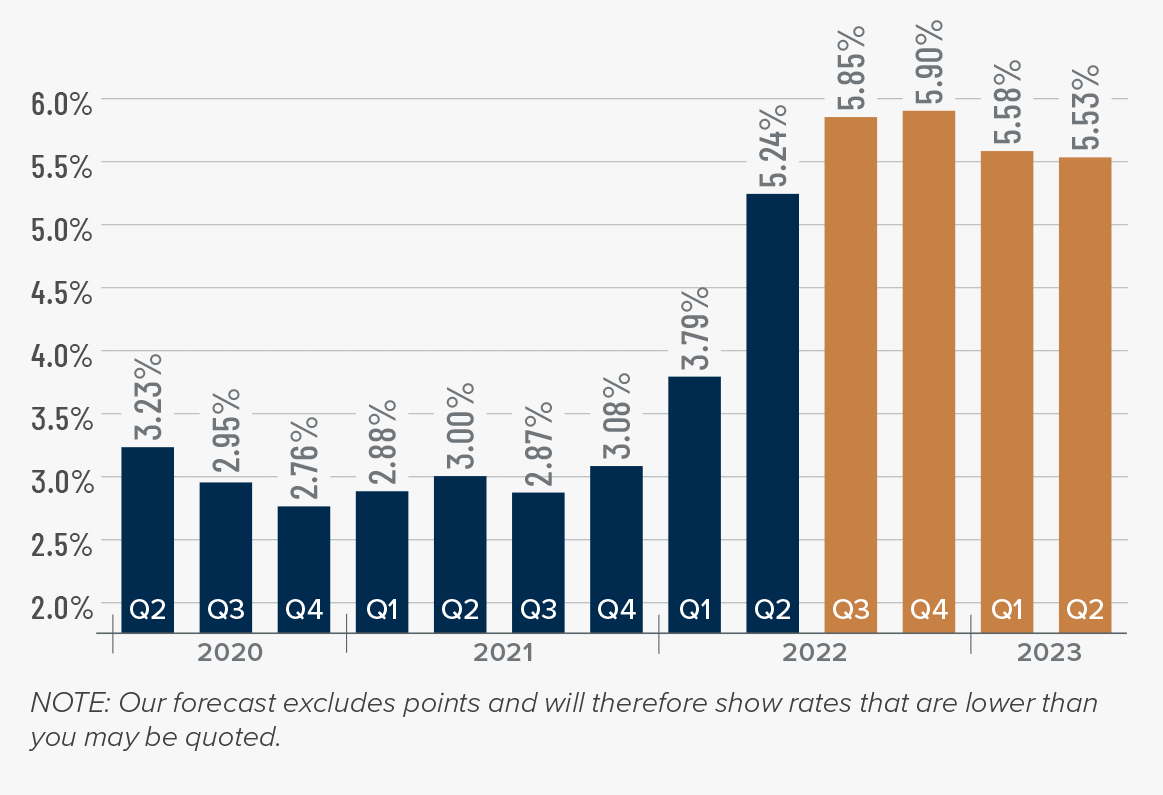
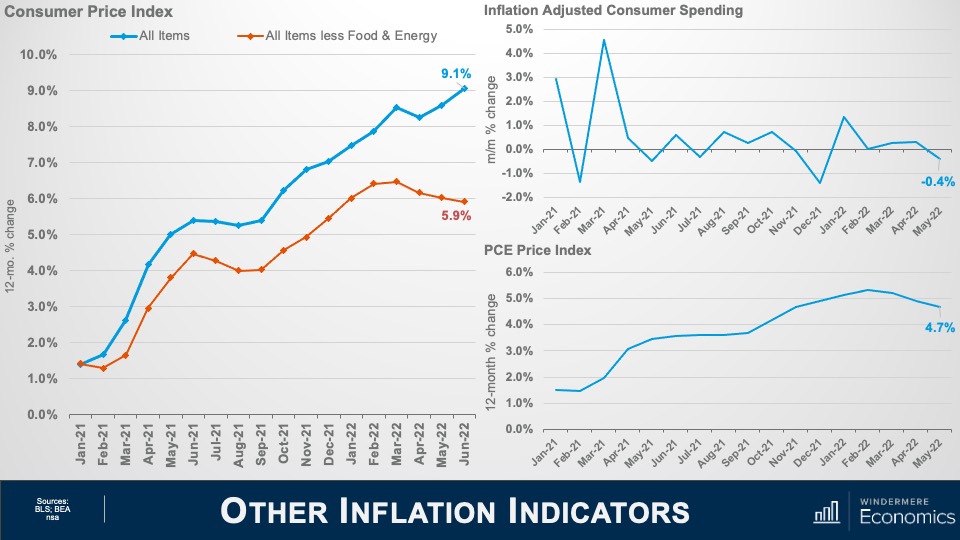
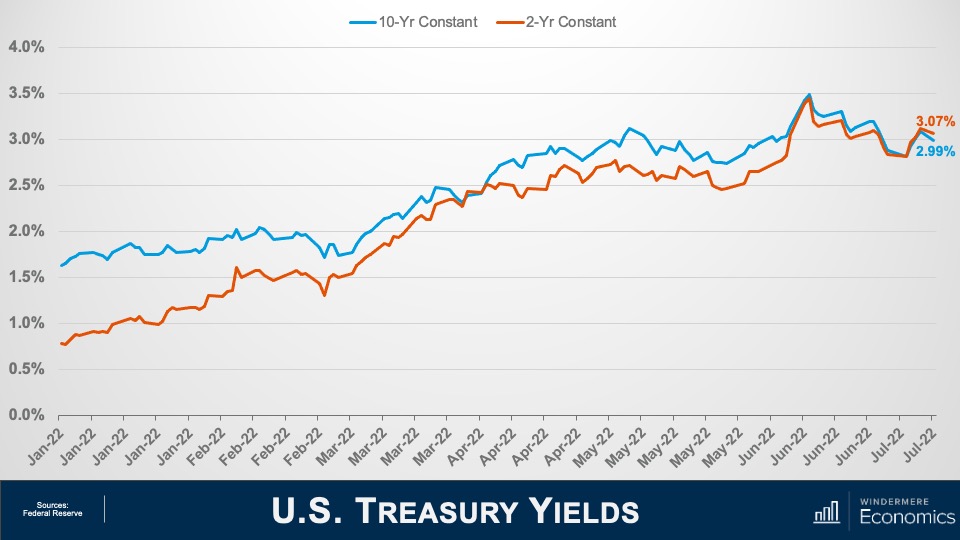
Although mortgage rates did drop in June, the quarterly trend was still moving higher. Inflation—the bane of bonds and, therefore, mortgage rates—has yet to slow, which is putting upward pressure on financing costs.
That said, there are some signs that inflation is starting to soften and if this starts to show in upcoming Consumer Price Index numbers then rates will likely find a ceiling. I am hopeful this will be the case at some point in the third quarter, which is reflected in my forecast.
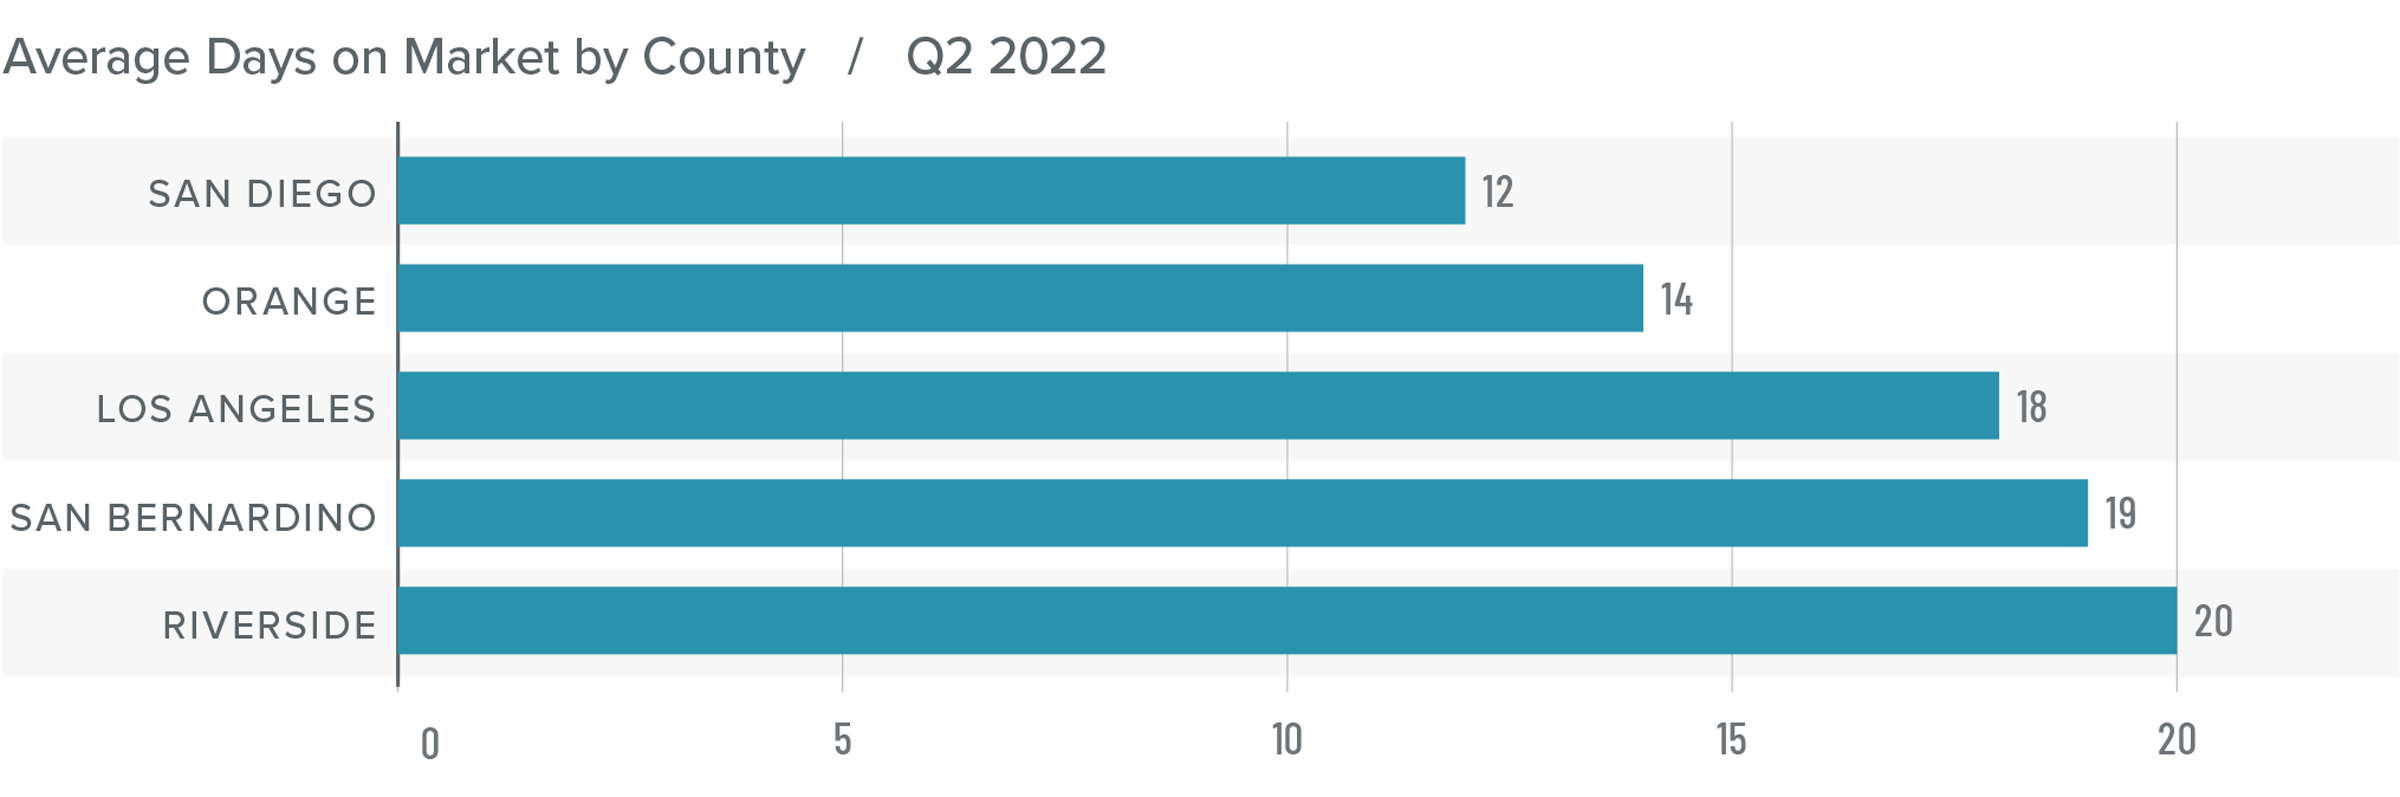
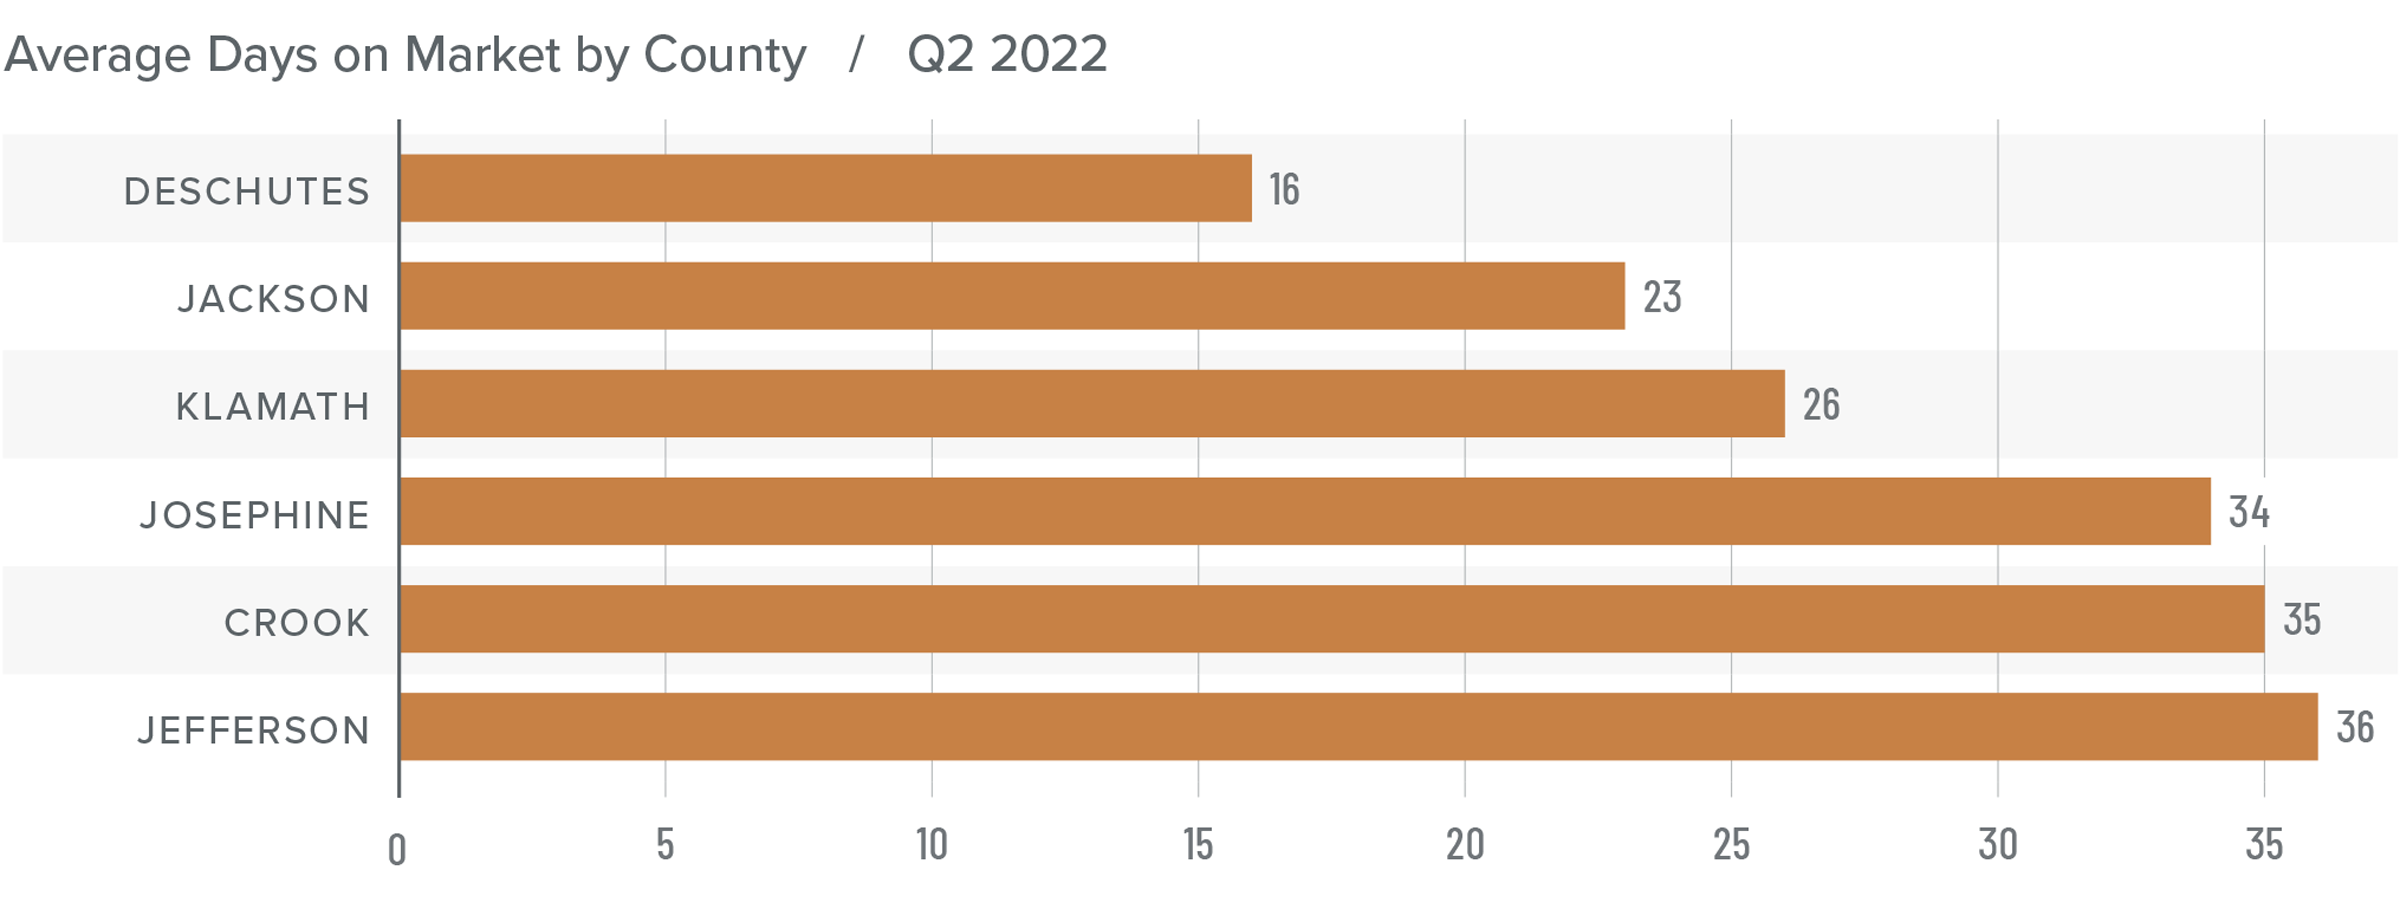
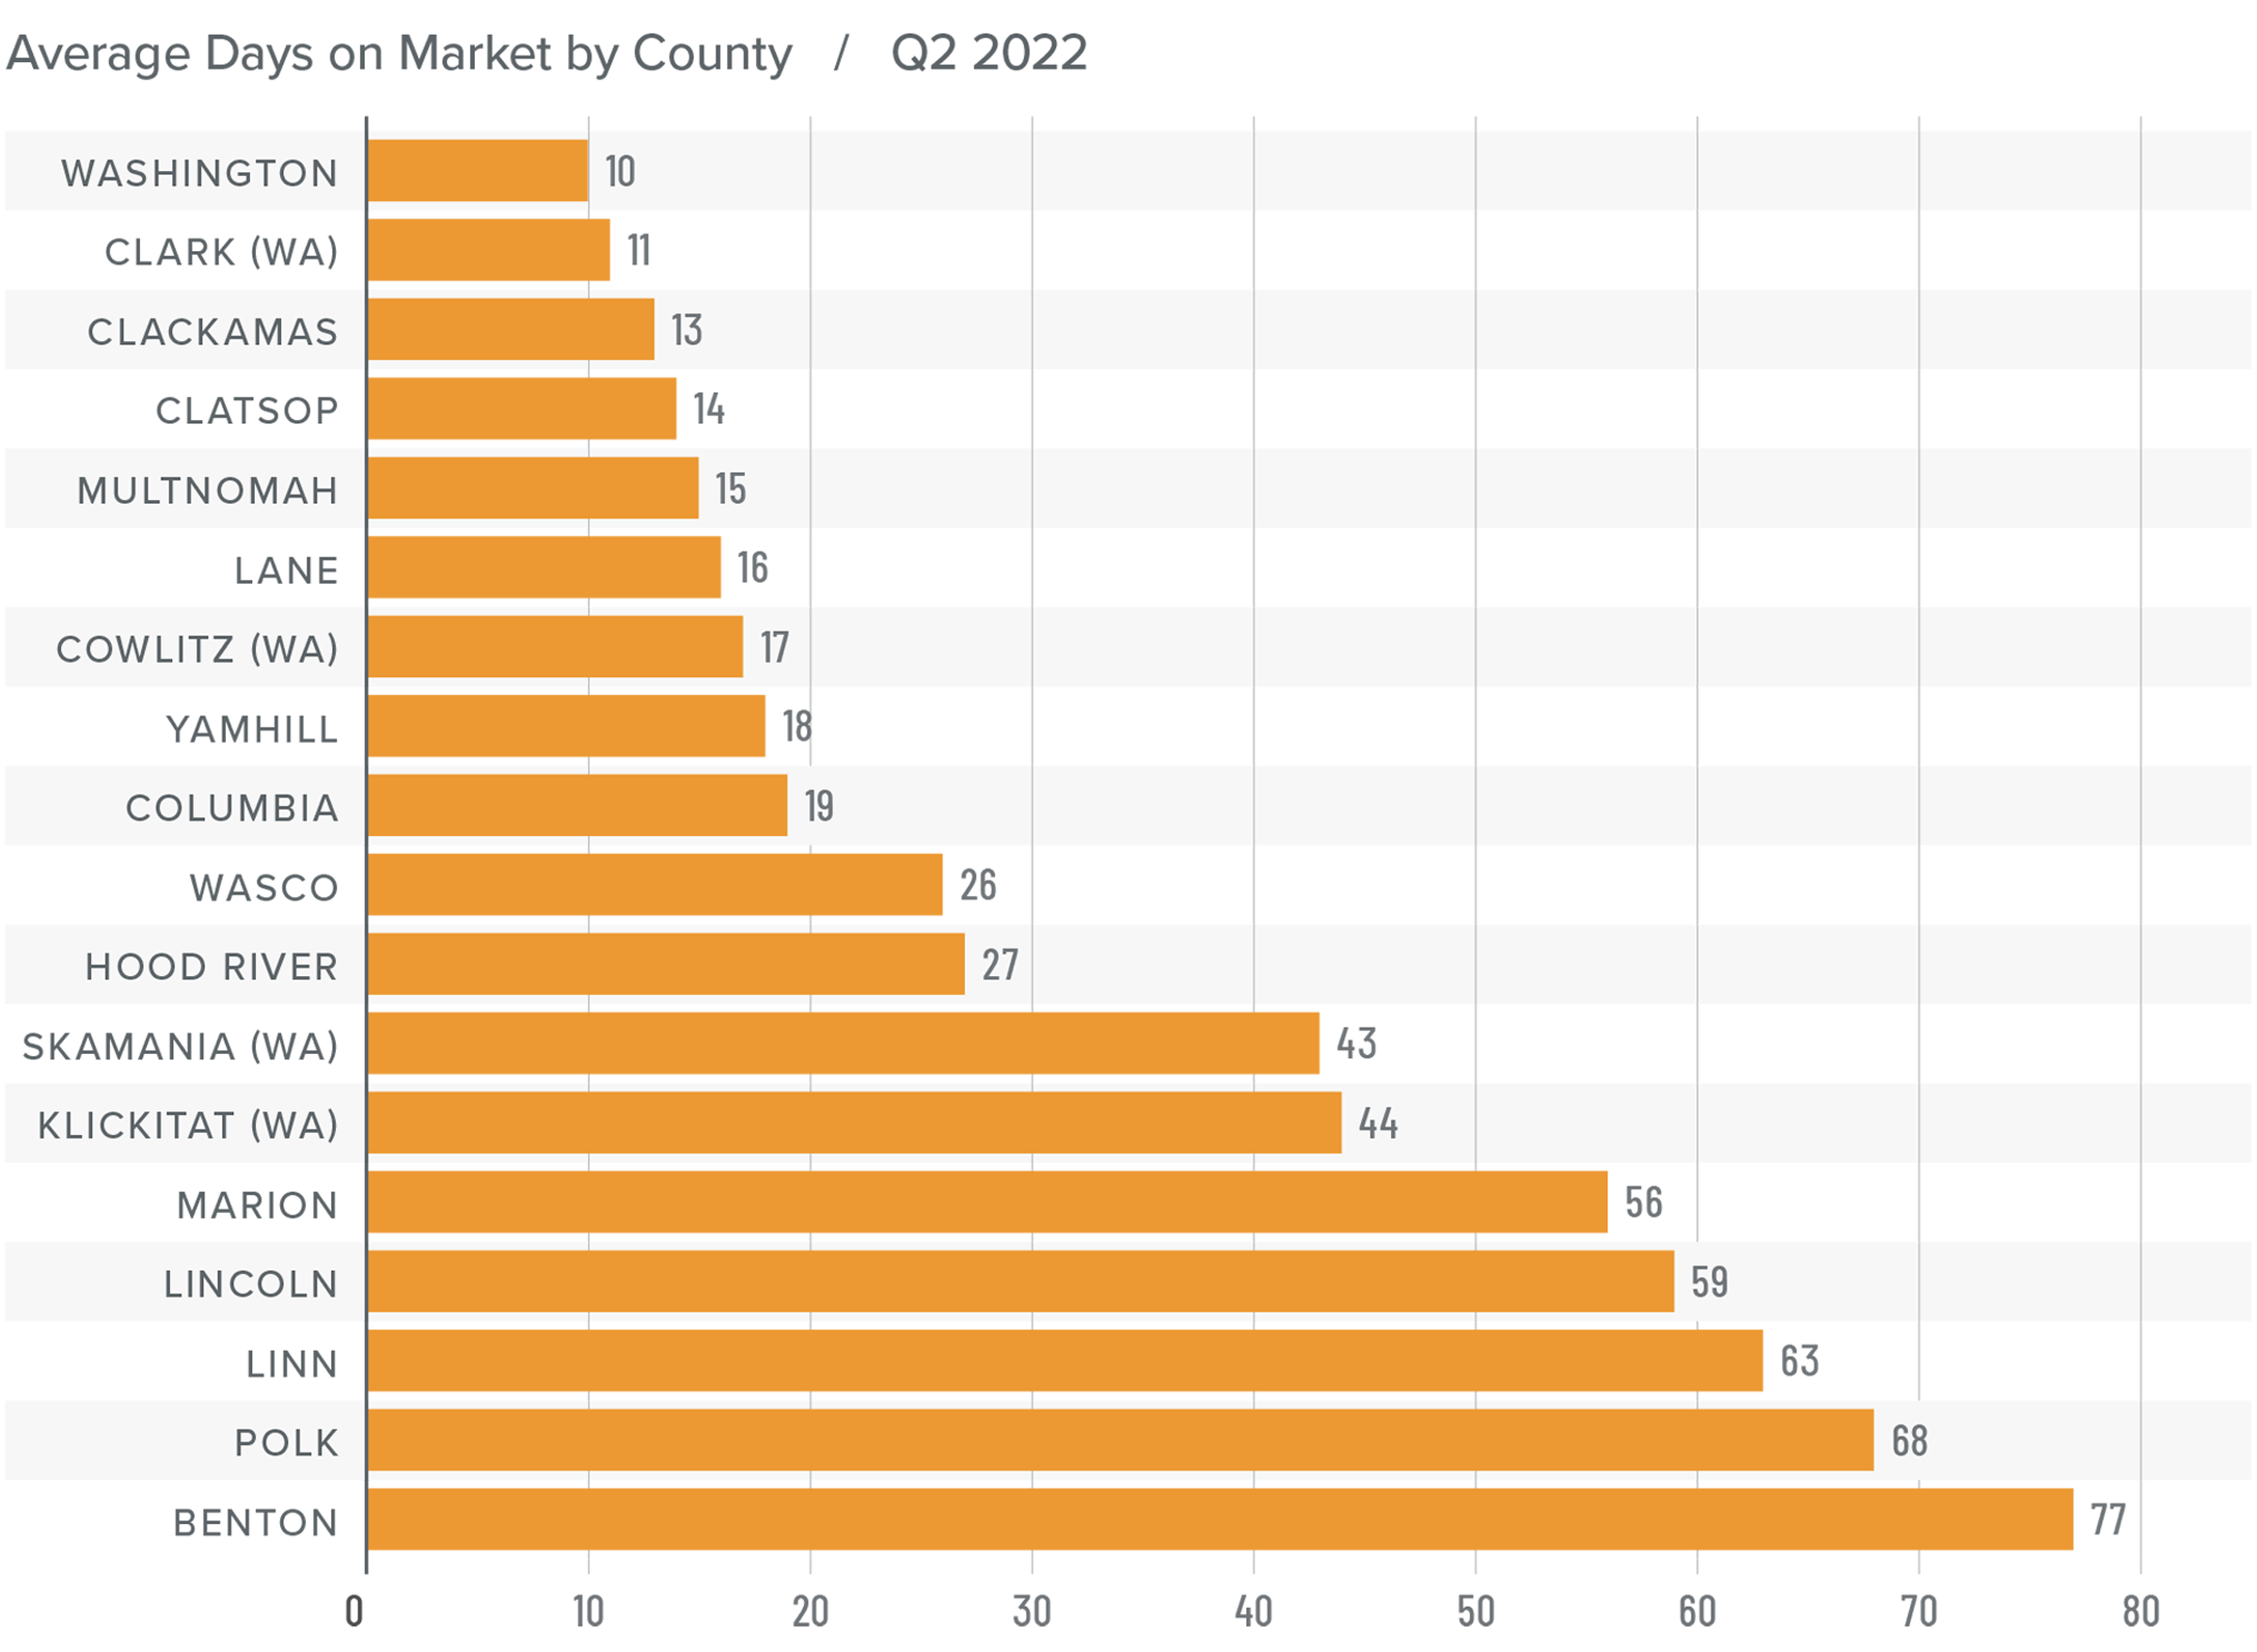
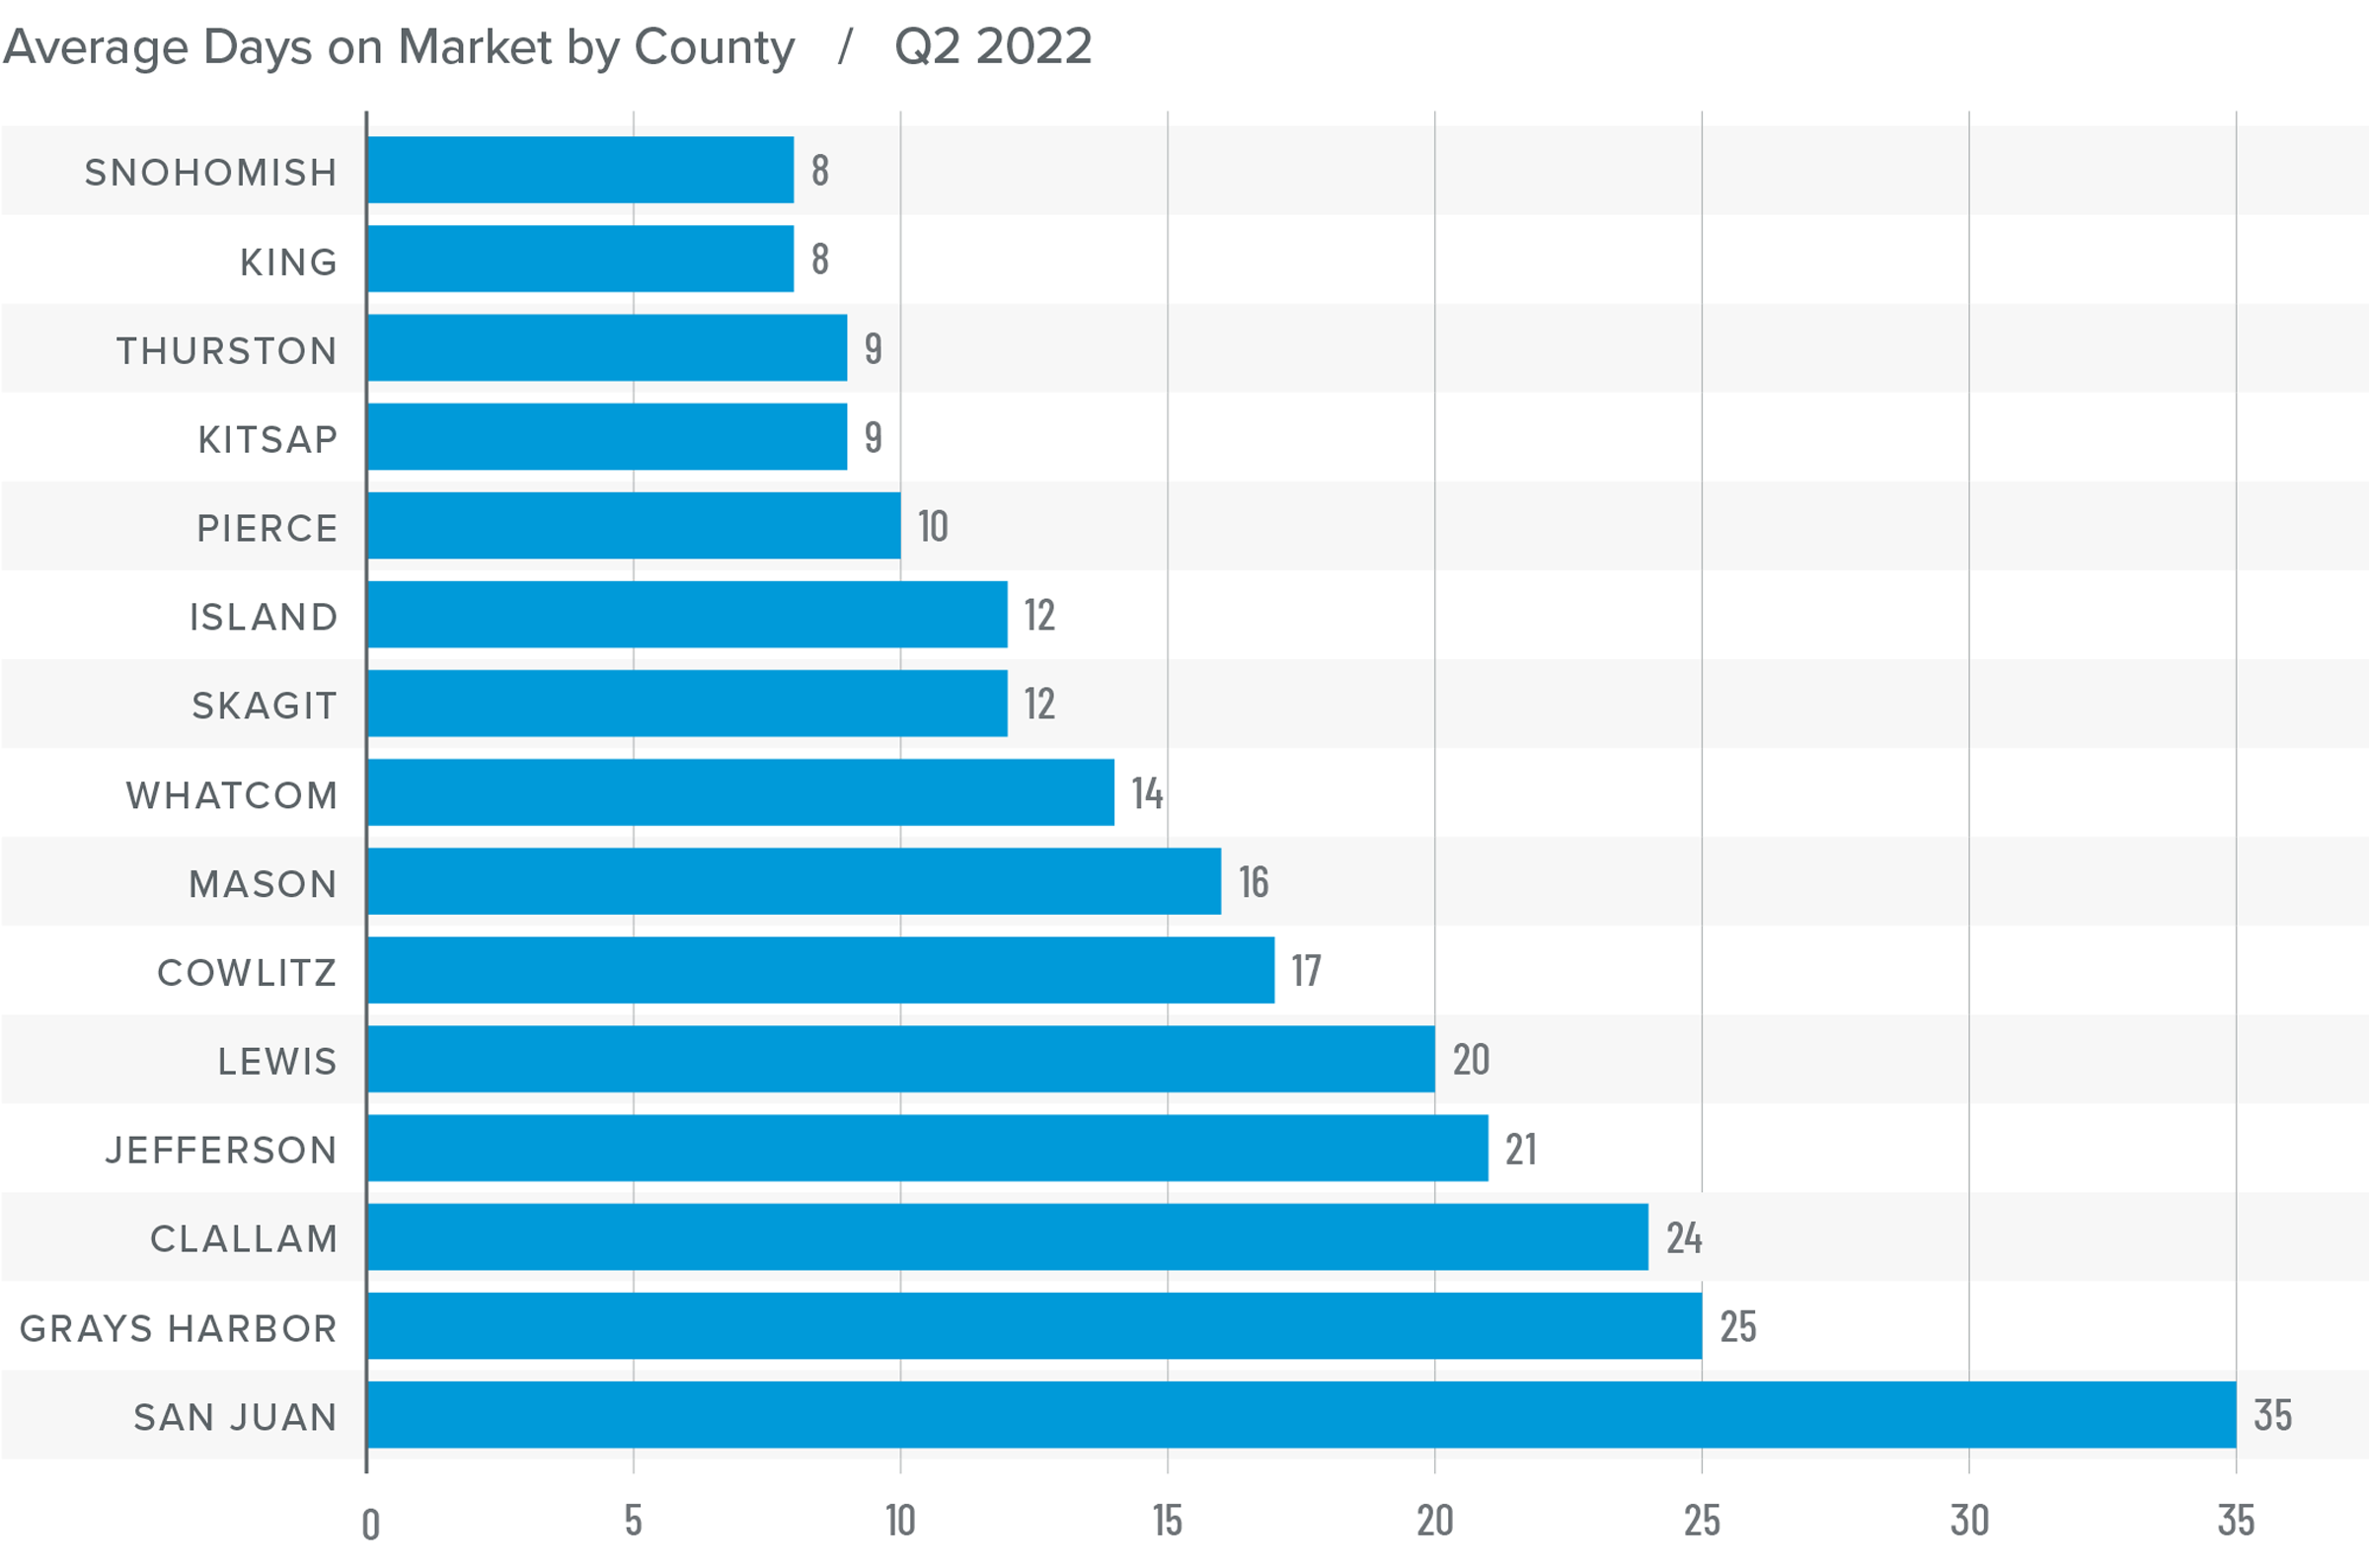
Southern California Days on Market
❱ In the second quarter of 2022, the average time it took to sell a home in the region was 16 days, which was 2 fewer days than a year ago and 5 fewer days than in the first quarter of the year.
❱ Compared to the first quarter of 2022, days on market dropped in all counties covered by this report, which was impressive given the higher number of homes for sale.
❱ Homes in San Diego County continue to sell at a faster rate than other markets in the region. All counties other than San Bernardino (where it took one more day for homes to sell than a year ago) saw market time drop.
❱ With inventory levels rising, some may think that the market is set for a correction, but I disagree. Sales are still higher than in 2019 and it took half the time to sell a home in the second quarter of this year than it did during the same period in 2019.
Conclusions
This speedometer reflects the state of the region’s real estate market using housing inventory, price gains, home sales, interest rates, and larger economic factors.
The trend in the job recovery remains positive, and the prospect of a return of all the jobs lost due to the pandemic is becoming more palpable. The housing market is still performing well, even in the face of higher inventory levels and rising financing costs. That said, the frenetic pace of activity of the past 18 months or so will slow, but not to a degree that is concerning.

More listings led to more sales, which is a little counterintuitive especially given far higher mortgage rates than we’ve seen in years. The market remains favorable to home sellers, and they are still in the driver’s seat.
About Matthew Gardner

As Chief Economist for Windermere Real Estate, Matthew Gardner is responsible for analyzing and interpreting economic data and its impact on the real estate market on both a local and national level. Matthew has over 30 years of professional experience both in the U.S. and U.K.
In addition to his day-to-day responsibilities, Matthew sits on the Washington State Governors Council of Economic Advisors; chairs the Board of Trustees at the Washington Center for Real Estate Research at the University of Washington; and is an Advisory Board Member at the Runstad Center for Real Estate Studies at the University of Washington where he also lectures in real estate economics.


")


