Design June 1, 2022

5 Ways to Incorporate Nature into Your Home

Home décor often focuses heavily on the latest and greatest trends. But even the most well decorated home can feel like it’s missing a natural element. Here are five simple ways you can incorporate nature into your home to make it feel more connected to the environment it inhabits.

5 Ways to Incorporate Nature into Your Home

1. Natural Light

Natural light has the power to breathe new life into your home. Place your furniture in your living room and/or dining room to make your get-togethers feel more connected to the outdoors and orient your workspace in your home office near a window to stay productive throughout the workday. By finding ways to let the sunshine in, your home will feel refreshed and lighter. Fortunately, this doesn’t require a heavy investment. Try sheer curtains or new blinds wherever your home’s large windows are. This will help to balance the light in the larger spaces around your home, so you don’t have to rely on artificial light sources.


A living room with the sun pouring in through the windows.

Image Source: Getty Images – Image Credit: TomMerton


2. Hardwood Floors / Wood Accents

To truly feel a connection to nature throughout your home, you’ve got to work from the ground up. Making the switch to hardwood floors will significantly impact the look and feel of your home, given the large surface area of such a project. A job of this scale is likely to require the help of a professional, and you may have to find a temporary housing solution while the remodel is being carried out. But you don’t have to go to great lengths to incorporate wood into your home.

Wood accents can deliver much of the same feeling. Experiment with different combinations of driftwood, bamboo, sculptures, and signage throughout various rooms to keep your home thematically consistent.


A living room with hardwood floors and various wood accents.

Image Source: Getty Images – Image Credit: Scovad


3. Organic Materials

Materials like stone, marble, and fabrics will not only help to incorporate nature into your home but will make it feel relaxing and cozy as well. A small collection of rocks or stone pebbles with trickling water in the bathroom work every time to evoke a natural tranquility. Stone or marble tile designs and/or backsplashes help to ground a space by providing an earthy foundation. Natural fibers like wool, cotton, and linen can be sprinkled throughout a home to deliver warmth and comfort while reinforcing a natural theme.


A modern bathroom with a marble backsplash.

Image Source: Getty Images – Image Credit: LumiNola


4. Decorating with Houseplants

Sometimes you don’t have to replicate nature to make your home feel more natural. You’ll be amazed at how refreshed the spaces feel by decorating with houseplants. However, there are certain rules you’ll want to follow when creating your own personal indoor ecosystem. Research the needs of each plant variety you’re interested in buying before making your final purchases. This will allow you to orient them appropriately throughout your home based on their sunlight needs. Plants that can survive with less sunlight are well suited for the darker corners of your home. If you’re not home often to tend to your plants, consider low maintenance varieties like succulents. Houseplants will add color to your home and improve the air quality while they’re at it. 


A man sprays water on the leaves of his houseplants.

Image Source: Getty Images – Image Credit: svetikd


5. Decorate with Earth Tones

All the aforementioned ways of incorporating nature into your home—natural light, wood accents, organic materials, houseplants—have a signature color palette. Once you’ve decided how these categories can fit into your home, you can decorate around them with complimentary colors.

Fortunately, you won’t be limited for choice. Earth tones run from darker, rich colors like brown and rust to lighter, vibrant colors like light green and sunlight yellow. The use of these colors can be carried out in your remaining accent pieces, such as towels, carpets, pillows, and more.


A living room decorated with earth tones.

Image Source: Getty Images – Image Credit: CreativaStudio

Market News May 23, 2022

Moving Patterns for U.S. Homeowners and Renters in 2021


This video is the latest in our Monday with Matthew series with Windermere Chief Economist Matthew Gardner. Each month, he analyzes the most up-to-date U.S. housing data to keep you well-informed about what’s going on in the real estate market. 


Hello there. I’m Windermere Real Estate’s Chief Economist Matthew Gardner and welcome to the latest episode of Monday with Matthew. Over the past few months, analysts like myself have been starting to get our hands on early numbers from the Census Bureau and, although we won’t get the bulk of the data for another several months, I thought it would be interesting to take a quick look at some of the information that the government has put out specifically as it relates to patterns.

This is a relevant topic given the pandemic, with many people wondering if we saw a mass shift in where we choose to live because of COVID-19. This belief that we packed up and moved because of the pandemic is, at face value, quite credible, especially given that home sales in 2021 were at levels we haven’t seen since 2006. But the reality, at least from the data we have received so far, actually tells a different story.

Moving Patterns for U.S. Homeowners and Renters in 2021

We Move More Infrequently

A graph showing the geographic mobility of both non-movers and movers in the U.S. from the years 2000 - 2001. The chart shows that 91.6 didn't make a move in 2021, versus 83.9% in 2000.


This first chart looks at people and not households and it shows that, contrary to popular belief,  we’re actually moving less frequently now then we have done in decades, with the share of people not moving in a single year rising from just about 84% to over 91½%. Of course, we are having fewer children now than we did, but not to the degree that would change the trend.

Unsurprisingly, Renters Move More Often than Owners

Two charts showing that on average, renters move more often than owners in the span of years between 2000 and 2021. Over this stretch of time, the percentage of renters staying put rose from 67.5% to 84%, while homeowners staying put rose from 90.9% to 95.1%.


And when we break this down between homeowners and renters there is quite the discrepancy between the two groups. Although the number of renters not moving has risen from 67½ percent up to 84% since 2000, the number of homeowners staying put has moved from almost 91% all the way up to 95% last year.

So, the data thus far is not suggesting that we saw any form of mass exodus following the pandemic, in fact we haven’t been moving as much for the past 2-decades, but people did move since COVID-19 hit and the reasons they did were fascinating. The following charts are broken up into four categories of movers: those who moved for family reasons; those who moved for employment related reasons; those that moved for housing related reasons; and finally, those that moved for other reasons.

Reasons to Move (1)

A chart showing the reasons why owners and renters moved. Moving due to a change in marital status was virtually the same, while more renters moved for things like getting a new job and moving closer to work. More owners moved due to retirement and because they lost their job.


So, starting with family-related reasons, it was not surprising to see the major reason for both owners and renters to move was to establish a new household, nor was it surprising to see a greater share of renters headed out on their own than homeowners. Finally, the share of those moving because of a change in marital status was essentially the same between renters and homeowners. And when we look at employment related reasons for people moving last year, a greater share of renters moved because of a new job than homeowners, and more renters moved to be closer to their workplaces than did homeowners. Again, not really surprising, given that a large share of renters work in service-based industries and therefore proximity to their workplaces is important. You will also see that a greater share of homeowners than renters moved because they lost their jobs and, finally—and not at all surprisingly—far more homeowners moved because they chose to retire than renters.

Reasons to Move (2)

A graph showing the housing-related reasons to move for both owners and renters. Noticeable differences include that more renters moved to find cheaper housing and to attend or leave college, while more owners moved for change of climate and health reasons.


And when we look at housing related reasons that people moved, a large share of owners and renters moved from their current home or apartment and into a new, bigger, better house or apartment. A statistically significant share looked to move into a better neighborhood, and I do wonder whether owners were doing this because of the ability to work from home and possibly move to a better location further away from their workplaces. And even though renters tend to stay closer to their workplaces, I wonder whether these renters weren’t in white-collar industries and that the ability to work from home has led them to move into an area that they perceive to be better suited to them.

And finally, a significant share of renters moved because of the fact that rents have been skyrocketing over the past 18-months or so. This clearly impacted some homeowners, too. And finally, under the “other” category, more renters than owners moved because they were either entering or exiting a relationship with a domestic partner, and more renters left to either go to college or because they had completed their degrees.

Health-related reasons for moving had a significant impact on homeowners over renters, and I found it particularly interesting to see a lot of owners saying that “climate” was a reason for their move. Of course, I can only hypothesize as to whether people are simply looking to move to warmer climates or whether climate change is starting to have an increasingly large influence on where we choose to live. My gut tells me that climate change is becoming a far more important consideration for homeowners, although we can’t deny that a lot of people, specifically on the East Coast, moved South during the pandemic.

These next few charts break down movers not just by whether they our owners or renters but also by ethnicity.

2021 Mobility by Ethnicity & Tenure: Owners vs Renters Movers and Non-Movers

Six pie charts showing the non-moving and moving percentages for 2021 among populations of White, Black, and Asian owners (95.1%, 95.6%, and 95.7% respectively for non-movers and 4.9%, 4.4%, and 4.3% respectively for movers) and White, Black, and Asian renters (83.7%, 85.3%, and 84.9% for non-movers respectively, and 16.3%, 14.7%, and 15.1% for movers respectively.)


Here you can see that homeowners across these three ethnicities were pretty much uniform in their desire to stay in their existing home with only 4 to 5% moving. And renters who, as we have already seen, did move more frequently last year than homeowners, were also in a very tight range at between 83 and 85%.

2021 Mobility by Ethnicity & Tenure: Owners vs Renters Movers and Non-Movers (2)

Six pie charts showing the non-moving and moving percentages for 2021 among populations of Hispanic, Mixed (White & Other), and Mixed (Black & Other) owners (94.8%, 95%, and 94.9% respectively for non-movers and 5.2%, 5%, and 5.1% respectively for movers) and Hispanic, Mixed (White & Other), and Mixed (Black & Other) renters (87.7%, 83.6%, and 85.2% for non-movers respectively, and 12.3%, 16.4%, and 14.8% for movers respectively.)


And the same can be said about Hispanic owners and mixed race families, with about 95% not moving last year. Now this is modestly lower than White, Black, or Asian households, but the difference is very marginal. As for renters, between 83 and almost 88% of them within these three ethnicities moved last year, but you will see a bigger share of Hispanic renters stayed put as opposed to all the other ethnicities shown here.

2021 Mobility by Ethnicity & Tenure: Moves In & Out of State

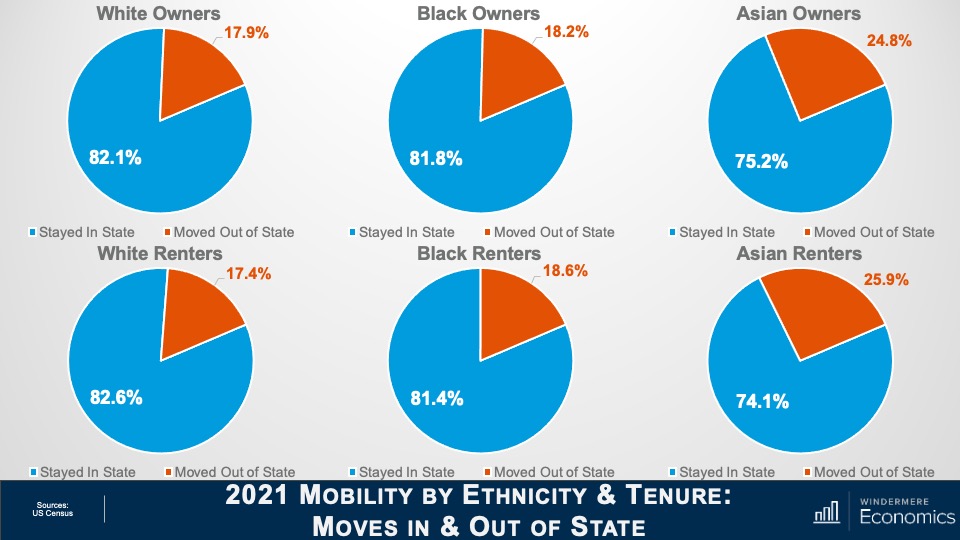
Six pie charts showing the percentages of staying in state vs moving out of state for 2021 among populations of White, Black, and Asian owners (82.1%, 81.8%, and 75.2% respectively for those who stayed in state and 17.9%, 18.2%, and 24.8% respectively for out-of-state movers) and White, Black, and Asian renters (82.6%, 81.4%, and 74.1% for those who stayed in state respectively, and 17.4%, 18.6%, and 25.9% for out-of-state movers respectively.)


Looking closer now at those who did move, even though fewer Asian households moved when compared to all other ethnicities, far more left the state than stayed, and the same was true for Asian renters with over a quarter moving out of state.

2021 Mobility by Ethnicity & Tenure: Moves In & Out of State (2)

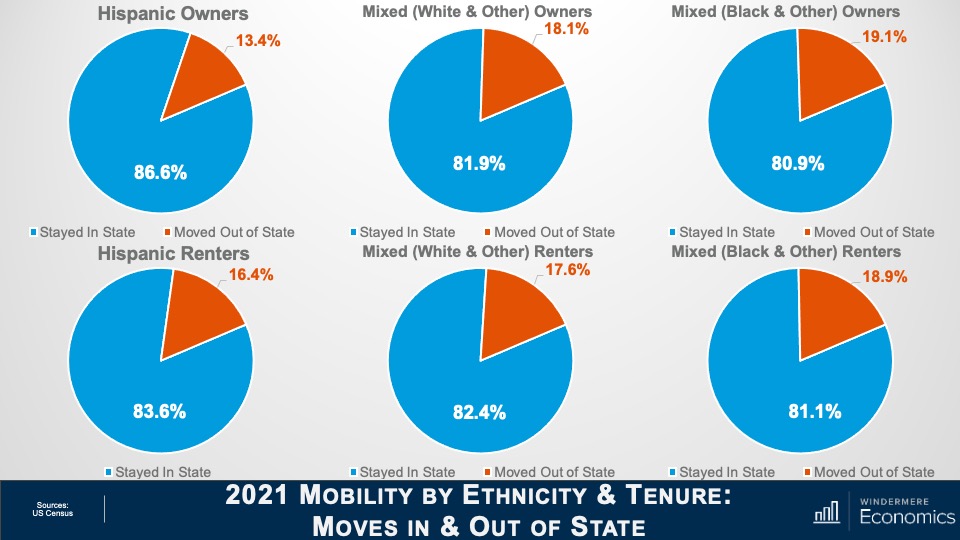
Six pie charts showing the percentages of staying in state vs moving out of state for 2021 among populations of Hispanic, Mixed (White & Other), and Mixed (Black & Other) owners (86.6%, 81.9%, and 80.9% respectively for those who stayed in state and 13.4%, 18.1%, and 19.1% respectively for out-of-state movers) and Hispanic, Mixed (White & Other), and Mixed (Black & Other) renters (83.6%, 82.4%, and 81.1% for those who stayed in state respectively, and 16.4%, 17.6%, and 18.9% for out-of-state movers respectively.)


Again, a greater share of the Hispanic homeowners who did move last year stayed in the state where their old house was, and the share of mixed households was roughly at the average for all ethnicities. And the share of Hispanic and mixed-race renters who stayed in State was also about average.

What I see from the data is that the huge shift that many expected during COVID has not been affirmed—at least not by the numbers we have looked at. That said, we are sure to see numerous revisions because of the issues that COVID 19 has posed on Census takers, so we may get a different story as more data is released and revisions posted. What I found to be most interesting in the numbers we have looked at was the massive increase in renters moving in with their “significant others.” But I am not surprised, given that there are around 48½ million people aged between 20 and 30, and this is their time!

And I was also interested in the share of the population who moved due to climate. I will be doing some more digging around in the darkest recesses of the Census Bureau website to see if I can find out more about this. Although I can’t confirm it, my gut tells me that climate—and specifically climate change—will be a factor of growing importance when people are thinking about where they want to live.

And there you have it. As always, if you have any questions or comments about this particular topic, please do reach out to me but, in the meantime, stay safe out there and I look forward to visiting with you all again next month.

Bye now.

Living May 18, 2022

Home Safety and Security

It’s true that your home is an investment and an asset, but most importantly, it’s your livelihood, so taking measures to adequately protect it is well worth your time. An unfortunate reality of being a homeowner is that your home can be a target for mischievous and/or criminal acts.

Fortunately, there are tools and systems you can use to mitigate damage from these kinds of attacks and keep your home safe, in both everyday home life and during the selling process. Sometimes the best part of security systems is the peace of mind that comes with knowing your home is protected. Many of our personal items can be replaced thanks to homeowners insurance, but you cannot put a price on feeling safe at home.

Home Safety and Security

Technology

As time goes on, home technology continues to improve and become more closely integrated with the way we think about a home’s basic functions. There are countless products that can help to automate the systems in your home while better protecting it. When considering these tools, educate yourself about the risks the devices may pose if the proper safeguards aren’t in place. For example, some smart speakers and voice-activated assistants may make everyday home life easier but can leave the door open for potential breaches of personal information if the proper security measures aren’t taken.
Smart Home Devices

The concept of a “smart” home has shifted over the years, but what does this term really mean? And what makes a device “smart”? In essence, a smart device is one that uses technology to make home life easier, more efficient, and more convenient, saving you time in the process. Often using automation and/or remote control, these products allow you to customize the systems in your home to best fit your lifestyle and the needs of your household.

Home Security Apps

Home security apps help to manage your home’s security systems all in one, centralized location. This makes it easy to closely monitor your home even when you’re far away. These apps are typically capable of connecting to door and window sensors, cameras, thermostats, and control lights while allowing you to set alarms and various other home protectants. These apps can offer peace of mind that your home is safe, even when you’re not there.

Alarm Systems

If you are considering an alarm, you have an array of options that vary from self-install motion detection kits to full-service home security systems.  If you choose to set up your alarm system yourself, you’ll want to install motion detectors on your doors and windows, especially if they can be easily accessed on the ground floor. These kits will often offer a 24-hour support line whose services may come at an extra fee.

Full-service security systems can include everything from an alarm system and panic buttons to and integration with your smoke detectors and/or fire prevention system. These services can be expensive up front, but usually have a reasonable monthly rate. In some cases, having a home security system installed can reduce your insurance rates.


A closeup of someone’s hand setting the code for their home alarm system.

Image Source: Getty Images – Image Credit: BrianAJackson


Upgrade Your Locks

After you’ve moved into your home, it’s a good idea to change the locks. This will give you peace of mind that, once the new locks are installed, no one outside of your household will be able to access your home. Also consider getting a high-quality front-door deadbolt. A poorly installed or weak one can make it easier for an intruder to kick in your door. Front door locks come in many forms, from the traditional models with keys to digital options that require passcodes or fingerprints. It’s also a good idea to check all the locks on your windows. Some older models are easy to jimmy open with a little wiggling. For ground floor windows, you may want to consider double locks.

Security Cameras

Nowadays, security cameras are widely available for home installation. When shopping around, compare different products’ capabilities to find the one that best suits your own security needs. Installing security cameras in high-visibility locations with clear sight lines can help to deter intruders. At the very least, they ensure that you’ll have evidence of an intrusion, should one occur. With so many home security products available, you won’t have trouble finding a system that’s easy to set up. Professional systems, however, generally have more robust monitoring services and require professional expertise to install.

Exterior and Interior Home Lighting

Having exterior lights and/or flood lights on timers or motion sensors is a good way to deter nighttime intruders. Add sensor lights to key entry points on your home, including the front door, back door, and/or basement entries. If you have an unused side yard, consider lighting there too. Keeping your home well-lit makes unwanted visitors weary of being seen.

If you will be gone from your home for an extended period of time, consider using timed lighting options in your home to give the appearance that someone is home. You can select timers for bedrooms or living areas and program a radio or TV to provide some white noise while you’re away.

The Importance of Community for Home Safety

Programs like Neighborhood Watch and NextDoor are very successful in some communities, by creating an environment where everyone is looking out for each other. Building close-knit relationships with your neighbors can go a long way in making you feel safe at home. Whether this is through a formalized program, or a shared agreement with your community, developing relationships with your neighbors is a great way to keep your home safe.

Selling May 16, 2022

What Happens When a Buyer Backs Out of a Real Estate Transaction?

Yes, the dream scenario for selling a home is that the entire process goes off without a hitch. But the reality is that sometimes there will be bumps in the road, and the best thing you can do is work closely with your agent to be prepared for them. One such obstacle is when a buyer decides to terminate their contract to purchase your home after all the terms have been agreed to. So, what’s a seller to do? Here’s a quick overview of how to prepare for this situation and the important role contingencies play when selling your home.

What Happens When a Buyer Backs Out of a Real Estate Transaction?

To be clear, a buyer can back out of a real estate transaction. The outcomes of doing so vary greatly. In certain cases, the buyer walks from the table with all their money intact. In others, they will have some fiduciary responsibility to the seller. If a buyer is hesitant about purchasing a home, the best time to back out of the deal is before their offer is accepted. As things progress, the ramifications of a buyer backing out can get messier. Once the purchase agreement is signed by both parties, it becomes legally binding, and the sale of the property can proceed.

After your agent and the buyer’s agent agree on purchasing terms, the buyer will place their earnest money—a deposit of funds to indicate that the buyer is serious about their offer and intends to pay the seller—in escrow to make sure they distribute properly when the deal goes through. Whether the buyer is on the hook for the funds in escrow depends on the terms of the contract, how far along you are in the selling process, and the corresponding state laws where the home is being sold. If a buyer backs out of the deal for a reason that was not stipulated in the real estate contract, then the funds will typically go to the seller. Still, this scenario can leave sellers scratching their heads. It’s not as if they’ve done anything wrong, and they thought they had found the right buyer, only to have the carpet ripped out from under them at the last minute. So, how can you protect yourself when selling your home?


A real estate agent and his clients examine a real estate contract.

Image Source: Getty Images – Image Credit: Paperkites


The Importance of Contingencies

This situation highlights the importance of contingencies. Contingencies exist to protect buyers and sellers from the unknowns of a real estate transaction. Buyers will typically include contingencies in their offer to specify the criteria that will allow them to walk away from the deal unscathed and the timeframes for doing so. As a seller, it’s critical that you work closely with your agent to understand the terms of the buyer’s offer. Read about Common Real Estate Contingencies to understand the ins and out of the different contingencies buyers will generally tie to their offer.

What to Do After a Home Buyer Backs Out

Backup Offers

Backup offers are made with the knowledge that an existing offer is already on the table. They stipulate that if the first offer falls through, the second buyer’s offer is accepted. Talk to your agent about the possibility of accepting backup offers when you sell your home. Whether a buyer backs out due to buyer’s remorse, something they discover in the home inspection process, or for any other reason, backup offers can act as a remedy for their indecision by keeping the line moving to the next buyer.

If a backup offer isn’t on the table, the seller is left with the decision of whether to sell again. It’s true that a relisted home may elicit questions from buyers. They will want to know why the home is being relisted and what went wrong with the previous offer. It’s important to coordinate your relisting strategy with your agent and discuss what disclosures are appropriate. It may be discouraging to deal with a buyer backing out but remember that selling a home is all about finding the right fit. A buyer walking away doesn’t mean your home isn’t worthy of a winning offer, it just means that you haven’t found the right buyer yet.

For more information on selling your home and how to navigate buyers’ offers, connect with an experienced, local Windermere agent today.

Design May 11, 2022

Asian-Inspired Home Décor and Design

In the pursuit of designing a home just the way you envision, there are countless sources of inspiration to pull from. Asian-style interiors are known for their ability to bring a sense of calm into a space. This helps to create something everything homeowner can see the value in—a relaxing home environment. In recognition of Asian Pacific American Heritage Month, we’ve compiled a short list of popular Asian-inspired home décor and design themes to consider incorporating into your home.

Asian-Inspired Home Décor and Design

Connection to Nature

One of the principal tenets of Asian design is a connection to nature. Using natural materials, a nature-influenced color palette, and houseplants in your home are all ways you can begin to create an interior that borrows from themes of Asian design. The bathroom is often a focal point for incorporating Asian-inspired natural materials. Using stone, wood, pebbles, and other materials will help your bathroom feel like it’s out in nature. Light stone tile in the shower will help to create the backdrop for a cascading water effect over smaller rocks and pebbles, while decorative wood elements can help tie the space together. These are just a few Asian-inspired design themes that can help take your bathroom to the next level.

Using natural colors will help to create a timeless aesthetic in your home. Whether your use of this color palette is exercised in large surfaces areas, such as wall paint, or in smaller accent pieces, such as complimentary décor items, natural colors will help deliver the serenity you’re looking to curate in your home. When decorating with indoor plants, organize them throughout your home based on their needs. For example, place plants that require more sunlight exposure in open areas and plants that have greater watering needs in easy-to-reach locations.


A Japanese garden just outside a studio room of a modern home.

Image Source: Getty Images – Image Credit: t_kimura


Feng shui

Feng shui, a practice that has existed in Chinese culture for thousands of years, has been largely influential to Western home design. Feng shui was founded on the idea of balancing oneself with their environment. In the modern world, the practice of feng shui has evolved into a relationship between humans and the objects with which we share our living spaces. Feng shui can often have the greatest impact in the bedroom. If there’s something off about the orientation of your bed, it can be tough to get consistent, healthy sleep. A slight change in your bedroom’s feng shui may be just the adjustment you need to revitalize the space.

Minimalism

The connection between Japanese Zen philosophy and Western minimalism goes back centuries. Tenets of Zen culture such as simplicity, open space, and removing unnecessary features directly influenced America’s own minimalist design pursuits. Nowadays, minimalism in home design is most often exemplified in the way we arrange our spaces, in eco-friendly decoration, and through the use of clean geometric lines. This focus on the essential not only has aesthetic value, but can also have greater environmental benefits, such as reducing waste.

For more information on design inspiration from across the globe, learn more about the influence of Spanish architecture:

What is Spanish Style Architecture?

Living May 9, 2022

Choosing the Right Fence and Gate for Your Home

Whether you are looking to improve your curb appeal, create more security or privacy, or cordon off a side garden, a fence or gate can be a practical and creative solution. With so many options to choose from, it can be difficult to decide which material is best for your home. By focusing on your budget and which materials best complement your home, you’ll eventually find your answer. Here are some options to get you started in your search. 

Different Types of Fencing

Consider your priorities before choosing materials. Perhaps your fencing will serve the exclusive purpose of providing a designated area for pets and/or children to play, or you’re more focused on matching the wood grain with that of your home, or maybe you’ve simply always dreamed of having a white picket fence. When compiling your budget, account for materials and labor if paying a professional. If you plan to install on your own, know that a fence installation can be a physically demanding project. If your fencing is going into soft soil, you’ll have an easier time with installation. But for those who will be post-hole digging into rocky dirt or gravel, you can expect a challenge. 

Natural Fences

Consider using a natural fence such as shrubbery, hedges, or trees to create a perimeter around your property. Natural fences create a barrier while bolstering your landscaping design and help to create a flow between your garden beds, yard, and the house itself. In comparison to other fencing solutions, natural fences may be a more affordable option, especially if you can plant them on your own. However, unless you’re buying full-grown shrubbery, natural fencing will take time to grow, whereas other types of hard-material fencing are functional as soon as they are constructed.

White Picket Fence

White picket fences, though traditional and simple in design, are effective. They are easy to maintain while complementing various home styles. Due to their sturdiness, they do well to keep pets in your yard and provide a safe designated area for them to roam. White picket fences reflect light and can make the colors in the shrubbery/plant life surrounding them pop. For the green thumbs that aspire to grow a flourishing garden, a white picket fence may be the perfect solution for magazine-quality grounds. However, with white picket fences, their strength is also their weakness. White is more prone to noticeable stains, meaning you can expect to set aside time for touch up painting at least once a year if you want to keep your fence purely white.

Wood Fences

There are many types of wood to pick from when choosing fencing. Local climate looms large in the decision-making process. It’s important to understand how the wood will hold up throughout the seasons and what kinds of treatments and/or stains are required to keep it from weathering. Wood fences work with many home styles. You’ll often see natural wood-colored fences used to reflect the aesthetic of Craftsman homes, while different paint colors and stains may be used to complement a more modern home style.

Different Types of Gates

Garden Gates

  • Ivy or Flower Archway: Use a simple wooden arch gate to allow flowers, ivy, or grape vines to grow along the gate creating a framed, lush entryway.
  • Vintage Gate: Use an old, wired gate to create a rustic vintage feel that leads to your personal garden.
  • Driftwood: Create your own gate by collecting wood or driftwood. You can then use twine, wire, or rope to create your own design.

 Driveway Gates

  • Security Gates: Using a security gate is one of the easiest ways to make your home safer and more secure.  There are many types of security gates, but steel provides protection without the need for much maintenance.  
  • Side Yard Gates: If you don’t have a driveway gate, consider getting a side yard gate for added security and privacy.
  • Ornate Gates: Ornate gates don’t always create privacy but can create a beautiful entryway while also offering more control over who has access to the property.

For more on home improvement, read our guide to home lighting: How to Find the Right Lighting for Your Home

Market News May 5, 2022

Q1 2022 Northern California Real Estate Market Update

The following analysis of select counties of the Northern California real estate market is provided by Windermere Real Estate Chief Economist Matthew Gardner. We hope that this information may assist you with making better-informed real estate decisions. For further information about the housing market in your area, please don’t hesitate to contact your Windermere Real Estate agent.


Regional Economic Overview

Northern California added 60,900 jobs in the first quarter of 2022, and 213,300 jobs have returned over the past year. With total employment now at 3.02 million, the markets covered by this report have recovered all but 24,800 of the 473,900 jobs lost during the pandemic. With solid growth in the region, the unemployment rate fell from 3.6% at the end of 2021 to 3.1% in March of this year. By county, the lowest jobless rate was in Santa Clara County (2.5%), and the highest rates were in Solano and Shasta counties, where 4.6% of the workforce remains unemployed. The region’s labor force grew in the quarter but remains below pre-pandemic levels. This is likely to mean that businesses will continue to find it hard to attract new employees, which could slow the pace of growth going forward. That said, I feel confident that all the jobs lost to COVID-19 will have been recovered by the spring.

Northern California Home Sales

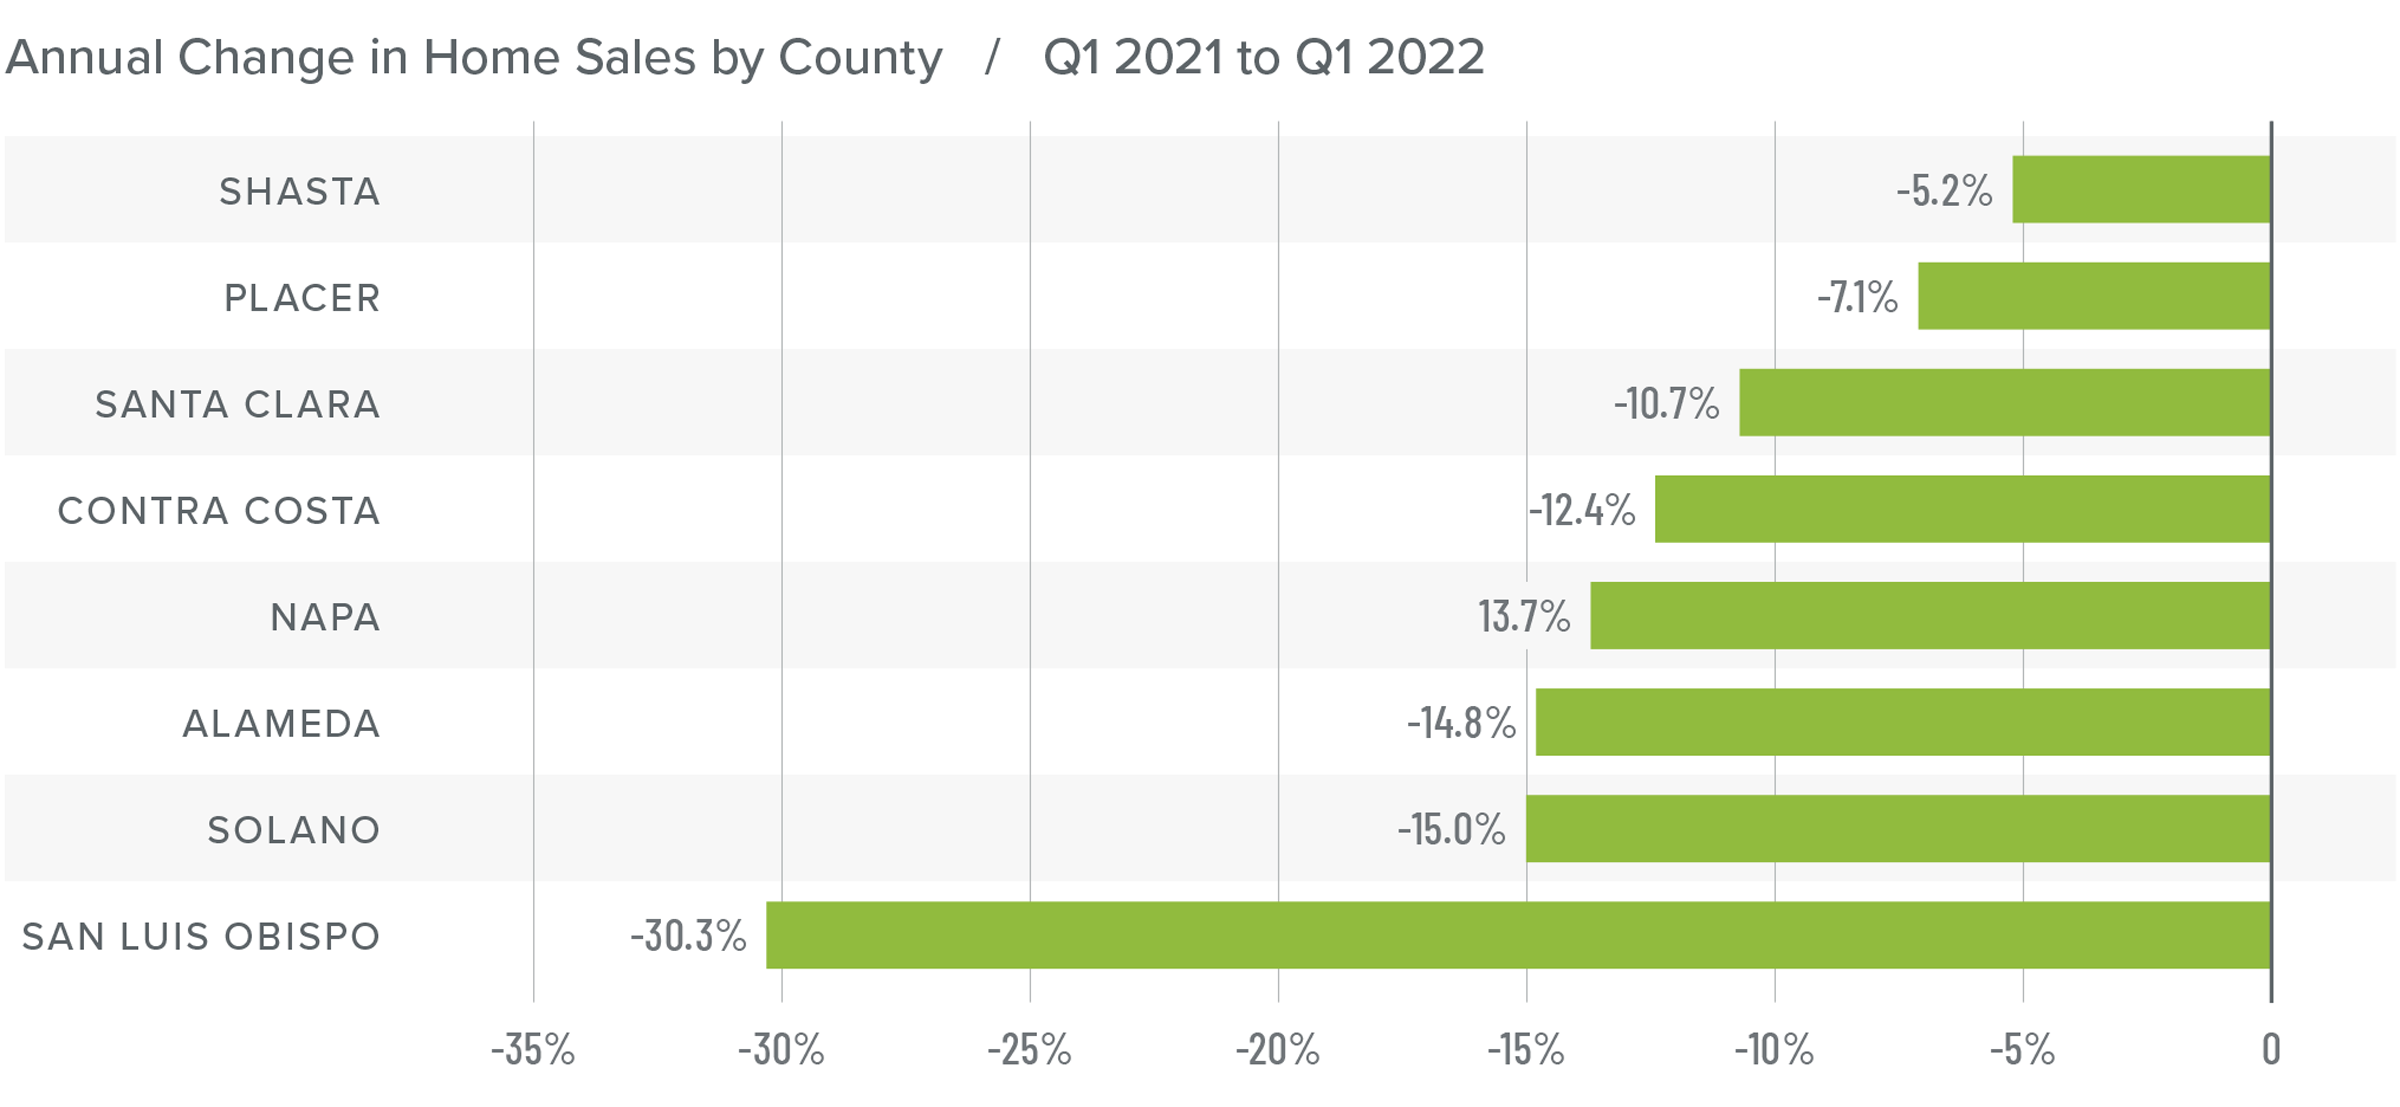
In the first quarter of the year, 10,347 homes sold, which is a drop of 12.4% compared to a year ago. Sales were 27.2% lower than in the fourth quarter of 2021.

Year over year, sales fell in all counties contained in this report. Solano County saw a modest drop, but there were fairly significant decreases across the rest of the region.

With listing activity rising 17% compared to the fourth quarter of 2021, the drop in sales was a little surprising.

Pending home sales ticked up from the final quarter of 2021, suggesting that we may see some growth in sales in the second quarter of this year.

A bar graph showing the annual change in home sales for various counties in Northern California between Q1 2021 and Q1 2022.

Northern California Home Prices

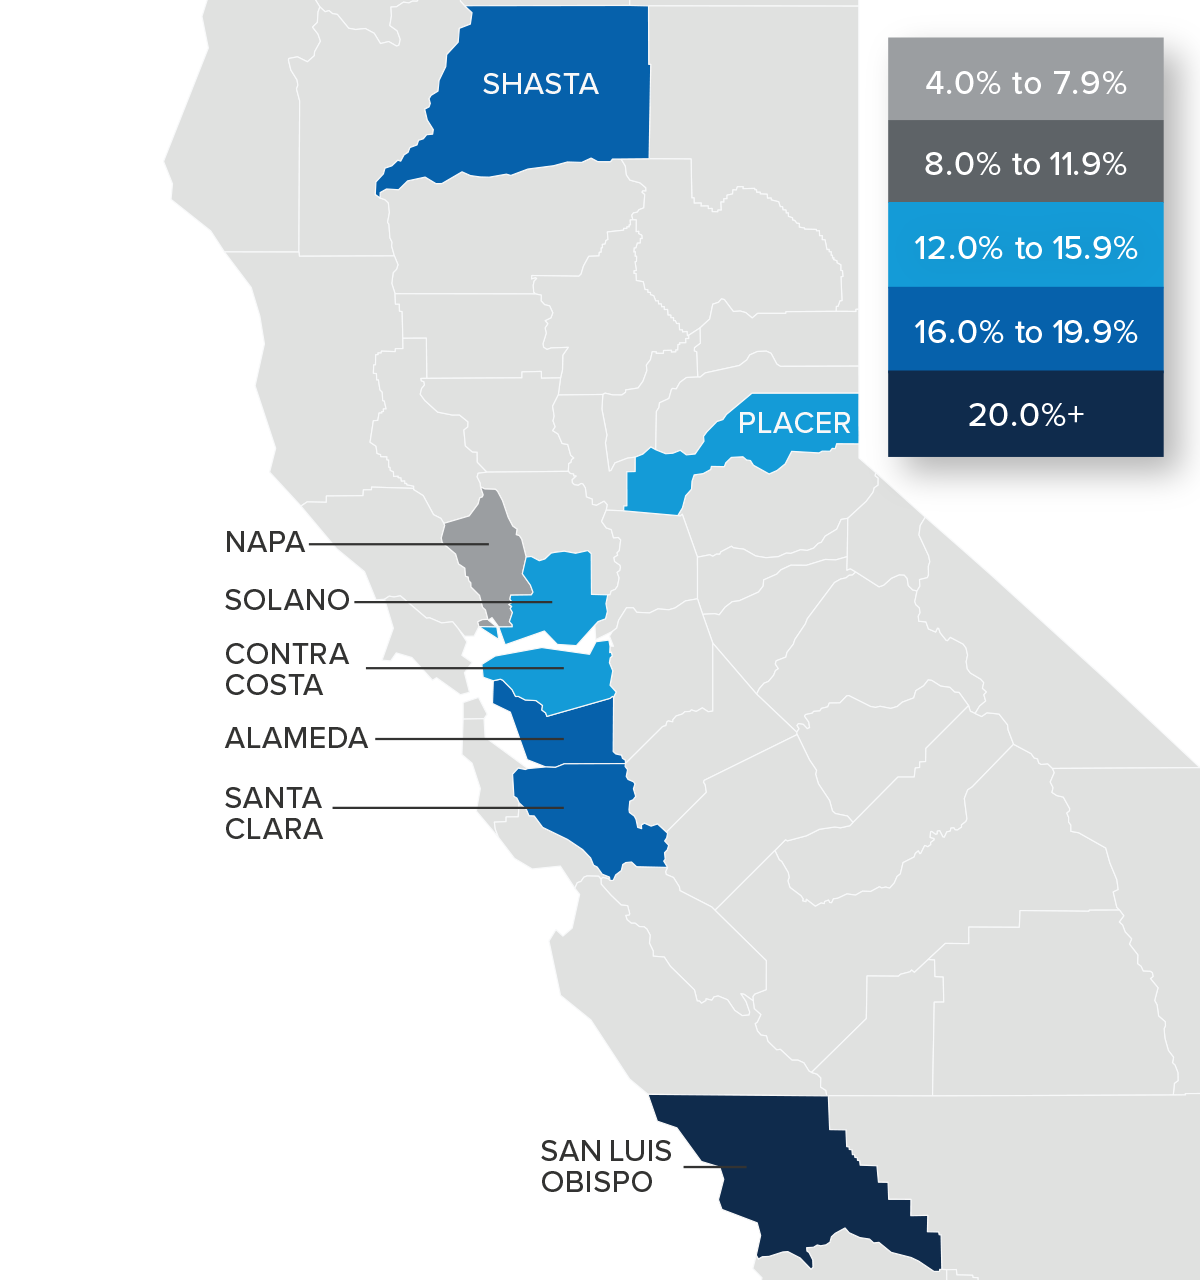
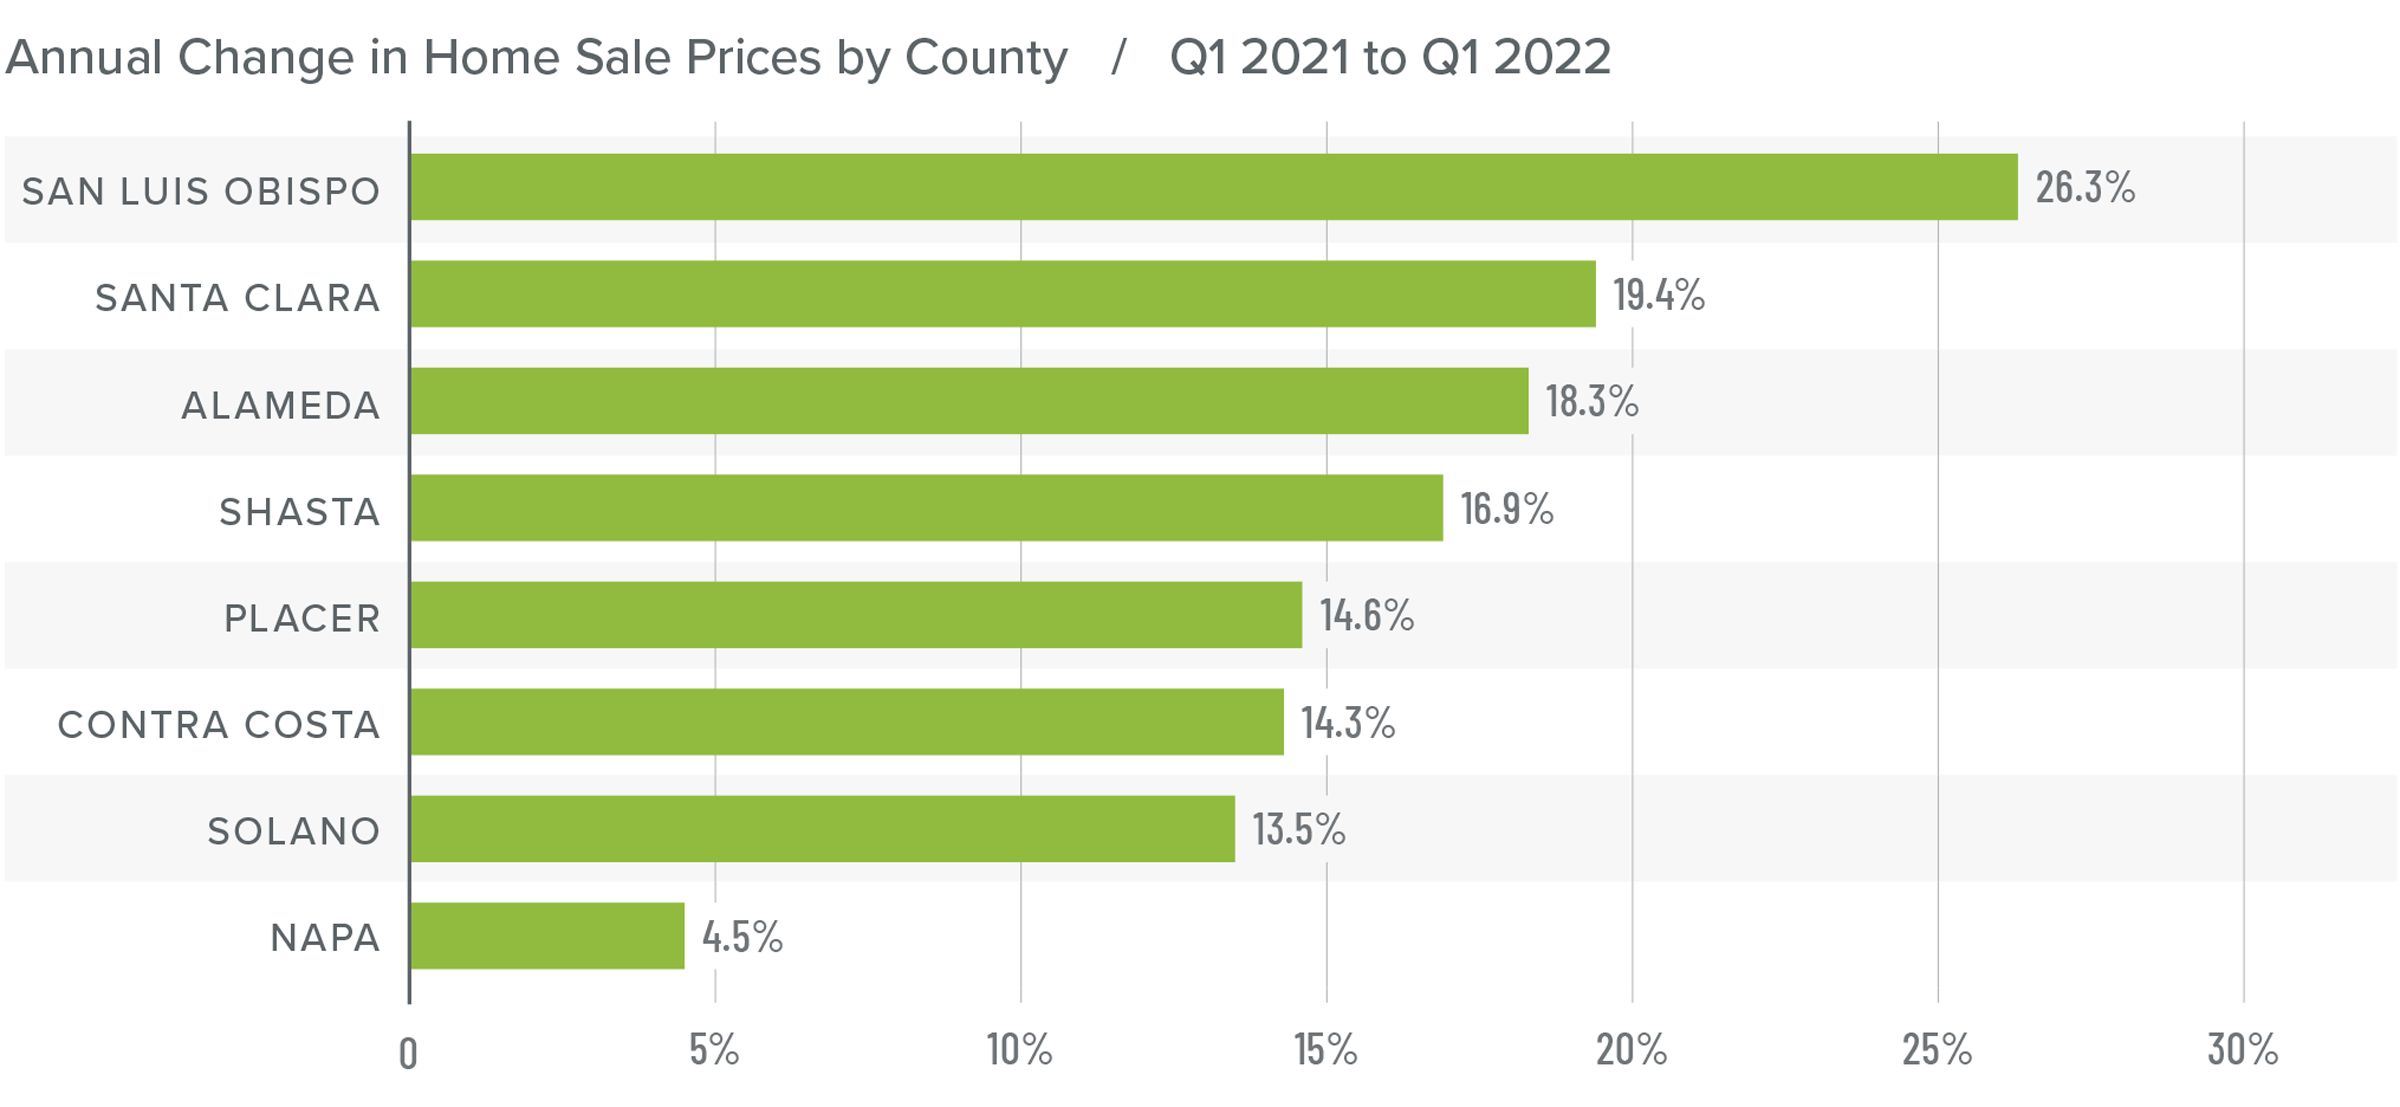
Even with sales pulling back, the average home price in the region rose an impressive 17.2% year over year to $1.215 million. Compared to the final quarter of 2021, home prices rose 4%.

The most affordable county relative to average prices continued to be Shasta. Santa Clara was again the most expensive market.

Prices rose by double digits in all counties other than Napa compared to a year ago. Prices were also higher everywhere but Napa County compared to the fourth quarter of 2021.

Rising prices continue to impact affordability in the region and the significant jump in mortgage rates in the first quarter will not help matters. Any effects of rising rates on prices were not evident in the first quarter, but the second quarter should be more telling.

A map showing the year-over-year real estate market percentage changes in various counties in Northern California for Q1 2022.

A bar graph showing the annual change in home sale prices for various counties in Northern California from Q1 2021 to Q1 2022.

Mortgage Rates

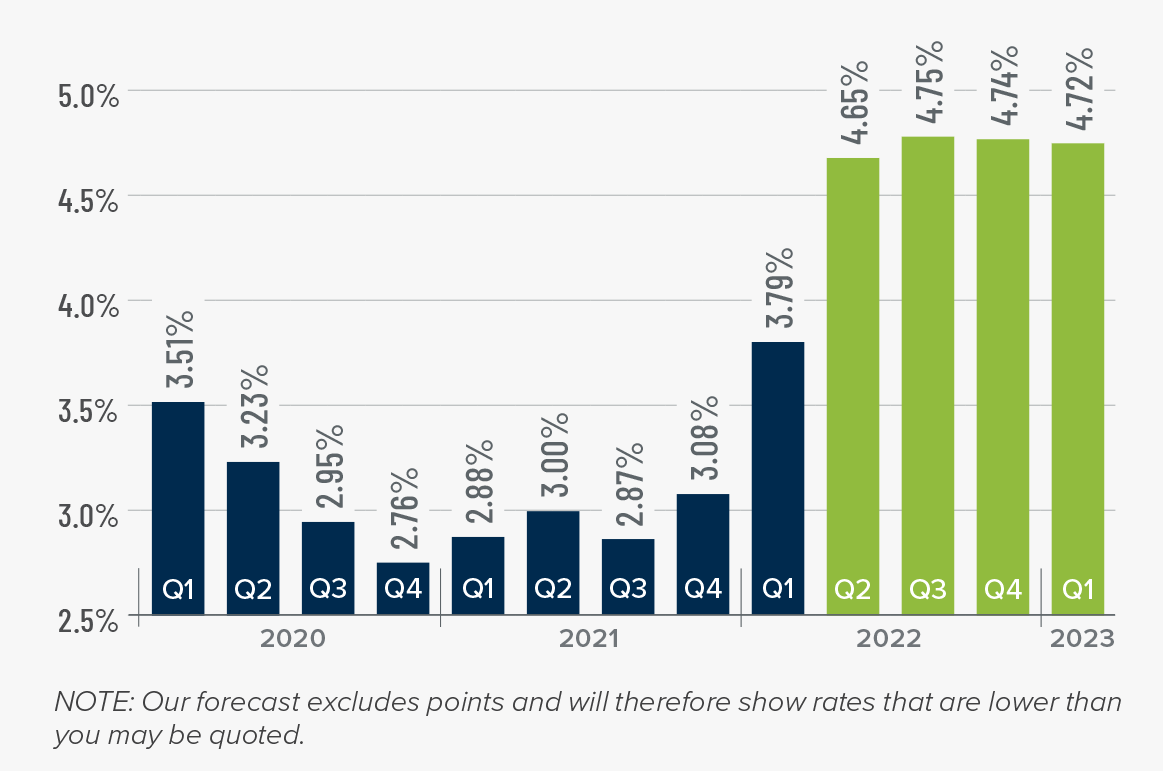
Average rates for a 30-year conforming mortgage were 3.11% at the end of 2021, but since then have jumped over 1.5%—the largest increase since 1987. The speed of the surge in rates is due to the market having quickly priced in the seven-to-eight rate increase that the Fed is expected to implement this year.

Because the mortgage market has priced this into the rates they are offering today, my forecast suggests that we are getting close to a ceiling in rates, and it is my belief that they will rise modestly in the second quarter before stabilizing for the balance of the year.

A bar graph showing the average rates for a 30-year conforming mortgage, plus Matthew Gardner's mortgage rate forecasts for Q2 2022 through Q1 2023.

Northern California Days on Market

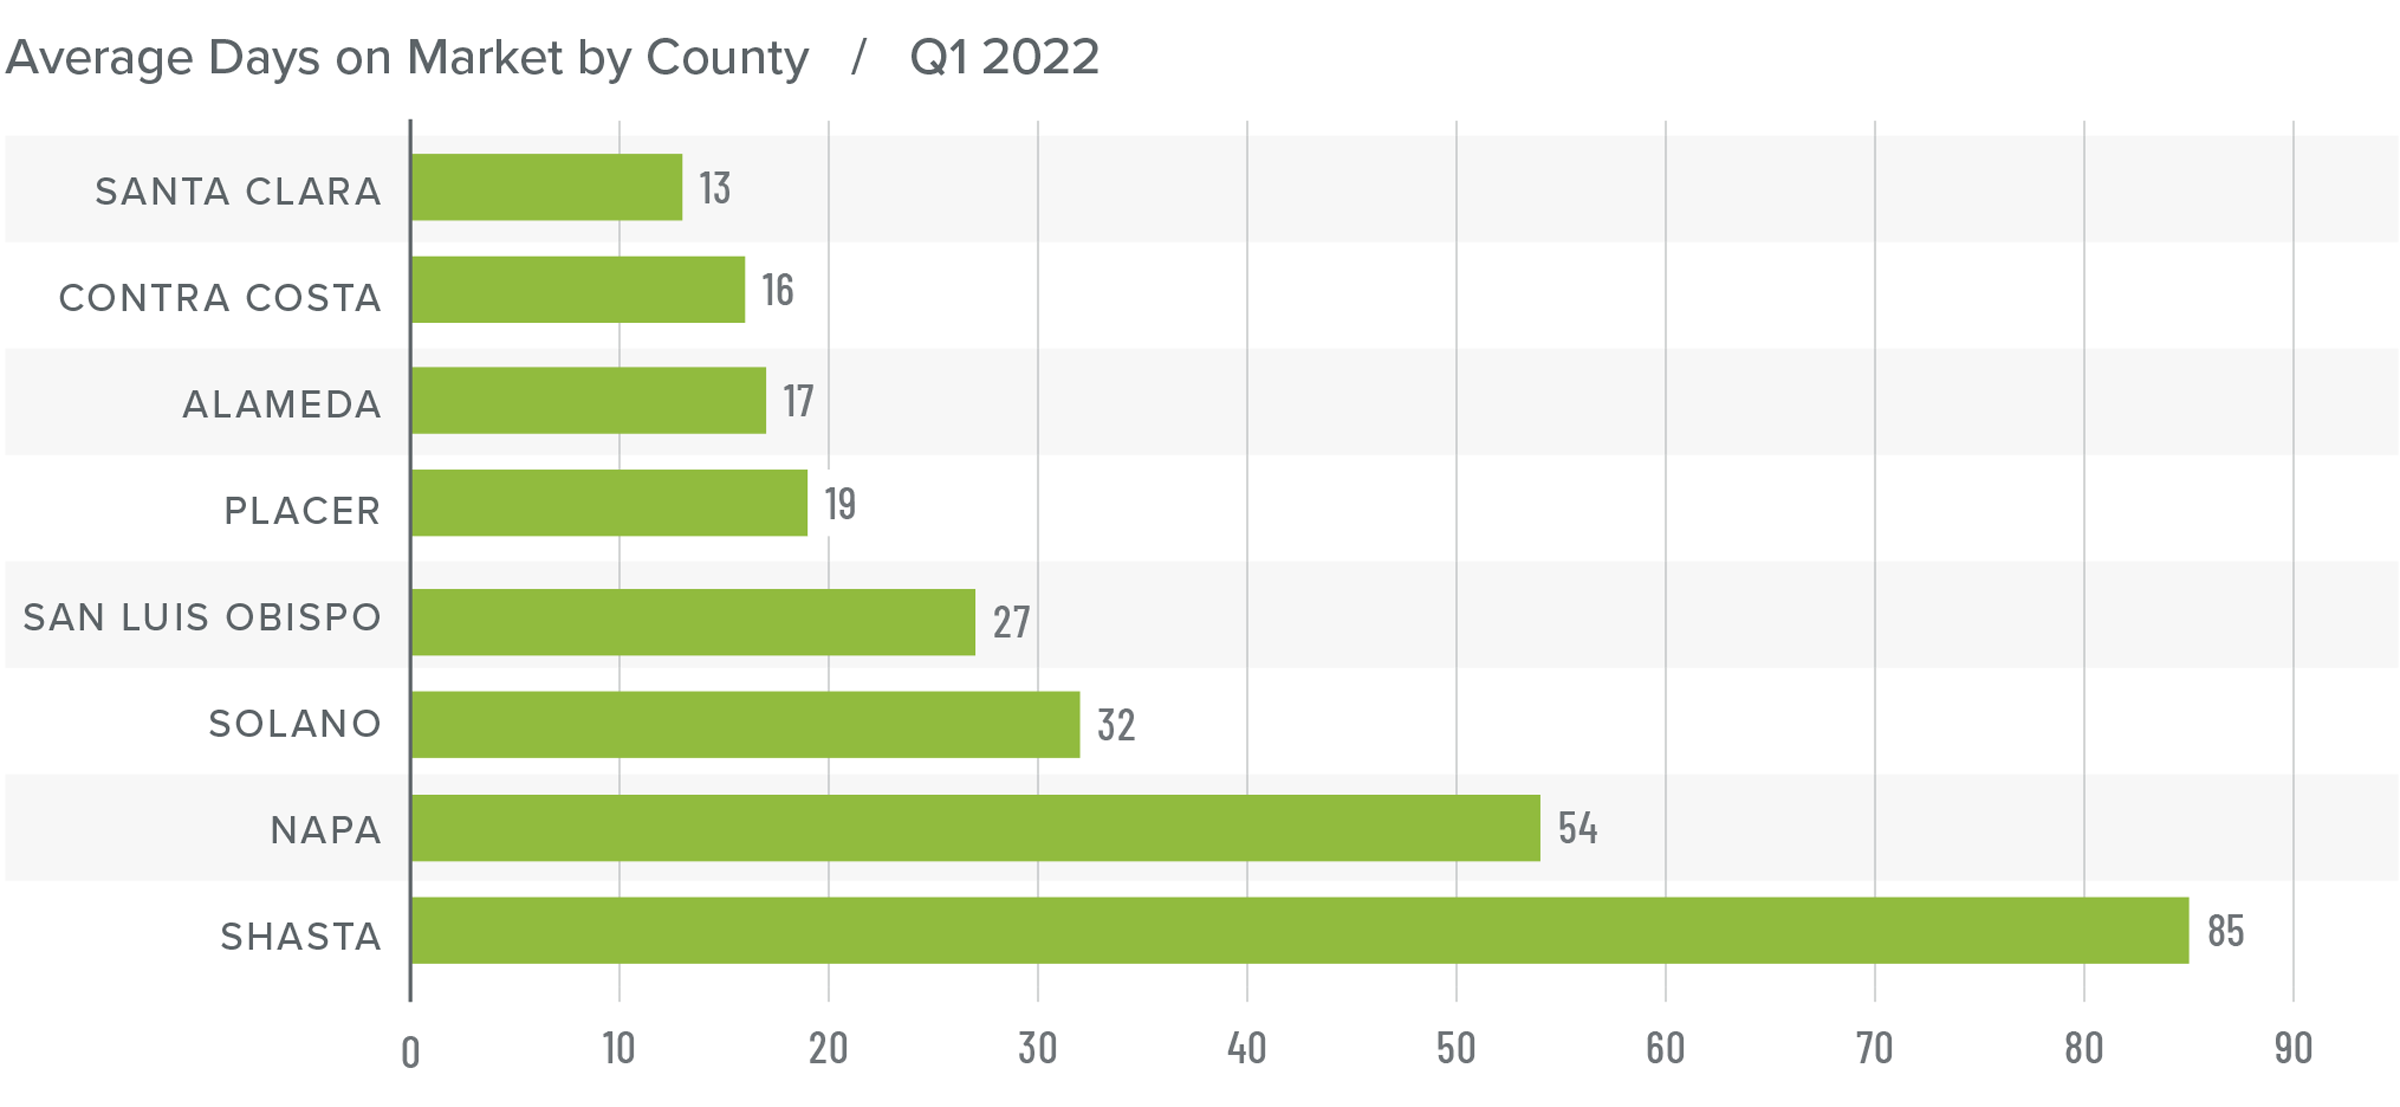
The average time it took to sell a home in the Northern California counties in this report dropped seven days compared to the first quarter of 2021.

The amount of time it took to sell a home dropped in every county other than Solano (+1 day) compared to a year ago. Days on market fell everywhere except Shasta, Placer, and San Luis Obispo compared to the fourth quarter of 2021.

In the first quarter, it took an average of 33 days to sell a home, which matched the fourth quarter of 2021.

The greatest drop in market time from a year ago was in Napa County, where it took 14 fewer days to sell a home.

A bar graph showing the average days on market for homes in various counties in Northern California during Q1 2022.

Conclusions

This speedometer reflects the state of the region’s real estate market using housing inventory, price gains, home sales, interest rates, and larger economic factors.

The jump in home prices compared to the prior quarter may be a surprise to some given the rapid increase in mortgage rates. However, when rates rise, there is typically a lag in time before we know the impact on the market. The increase in the number of homes for sale means there is more choice for buyers which, combined with higher financing costs, should start to taper the pace of price appreciation as we move into the spring buying season. Affordability continues to be a concern, but the market does not appear to be overly affected thus far. Average listing prices in most counties are increasing, which suggests that sellers remain confident for the time being.

A speedometer graph indicating a seller's market in Northern California during Q1 2022.

Although prices continue to increase at a significant pace, the growth in listing activity combined with lower sales may suggest that the market may be starting to slow from the frenetic pace of the past few years. With all the data here, I have moved the needle a little towards home buyers, although it clearly remains a seller’s market.

About Matthew Gardner

Matthew Gardner - Chief Economist for Windermere Real Estate

As Chief Economist for Windermere Real Estate, Matthew Gardner is responsible for analyzing and interpreting economic data and its impact on the real estate market on both a local and national level. Matthew has over 30 years of professional experience both in the U.S. and U.K.

In addition to his day-to-day responsibilities, Matthew sits on the Washington State Governors Council of Economic Advisors; chairs the Board of Trustees at the Washington Center for Real Estate Research at the University of Washington; and is an Advisory Board Member at the Runstad Center for Real Estate Studies at the University of Washington where he also lectures in real estate economics.

Living May 4, 2022

Tips For Emergency Preparedness

With homeownership comes the responsibility of having to plan ahead for life’s unknowns. Emergencies come in many forms, depending on your local climate. So whether its more likely that you and your household need to prepare for the potential of a wildfire, a flood, or a winter storm, it’s crucial to have resources on hand to limit the damage to your home and to protect your household.

Tips for Emergency Preparedness

A good place to start when putting together your emergency kit is to compile basic resources you and your household will need to support yourselves outside of your home. Keep all items together in an easily accessible location. The general rule is to have at least one gallon of water per person, per day. This is useful for drinking, food preparation, and general hygiene. The Red Cross suggests keeping a two week’s supply of water at your home and three days worth in the case of evacuation. The following information is based on the American Red Cross’s emergency preparedness website.

What to include in your home emergency kit

  • A two-week supply of non-perishable food that is easy to prepare
  • Flashlight and extra batteries
  • Battery-powered or hand-crank radio
  • 2 absorbent compress dressings (5 x 9 inches)
  • 25 adhesive bandages (assorted sizes)
  • 1 adhesive cloth tape (10 yards x 1 inch)
  • 5 antibiotic ointment packets (approximately 1 gram)
  • 5 antiseptic wipe packets
  • 2 packets of aspirin (81 mg each)
  • 1 blanket (space blanket)
  • 1 breathing barrier (with one-way valve)
  • 1 instant cold compress
  • 2 pair of non-latex gloves
  • 2 hydrocortisone ointment packets (approximately 1 gram each)
  • Scissors
  • 1 roller bandage (3 inches wide)
  • 1 roller bandage (4 inches wide)
  • 5 sterile gauze pads (3 x 3 inches)
  • 5 sterile gauze pads (4 x 4 inches)
  • Oral thermometer (non-mercury/non-glass)
  • 2 triangular bandages
  • Tweezers
  • First aid instruction booklet

To-Go Bag

Keep a to-go bag on hand to ensure that you and your household have easy access to essential items such as medication, toiletries, chargers, cash, and more. 

  • If you or family members have medications, make sure you have at least a seven day supply
  • Multi-purpose tool (Swiss army knife)
  • Sanitation and personal hygiene items
  • Hand sanitizer
  • Toothbrushes and toothpaste
  • Personal wipes       

Personal documents

  • Copies of personal documents (medication list and pertinent medical information, proof of address, deed/lease to home, passports, birth certificates, insurance policies)
  • Family and emergency contact information
  • Extra cash
  • Extra cell phone chargers
  • Emergency blanket(s)

Car Kit

In the case of an evacuation or car emergency you should have a supply kit that can last up to three days.

  • A three-day supply of water in the case of an evacuation (one gallon per person per day)
  • Three days’ worth of non-perishable food
  • First aid kit
  • Flashlight with extra batteries
  • Extra phone charger
  • Emergency blanket
  • Map of your area

Pets

If you have pets, you will want to pack additional supplies to ensure their safety in the event of an emergency. It’s a good idea to have a week’s worth of food for each pet, a gallon of water per day, medication on hand, an additional leash, a crate, and any relevant sanitation materials (pet bags, litter, etc.).
Keeping Your Sanity

If you have small children, you may want to include activities for them to stay occupied without the help of electricity. Small games, coloring books and supplies, and other items can be stashed in the emergency kit to keep the family occupied.

For more information on preparing for potential emergencies and disasters, read our blog post about preparing for a fire at home. 

How to Prepare for a Fire at Home

Market News May 4, 2022

Q1 2022 Nevada Real Estate Market Update

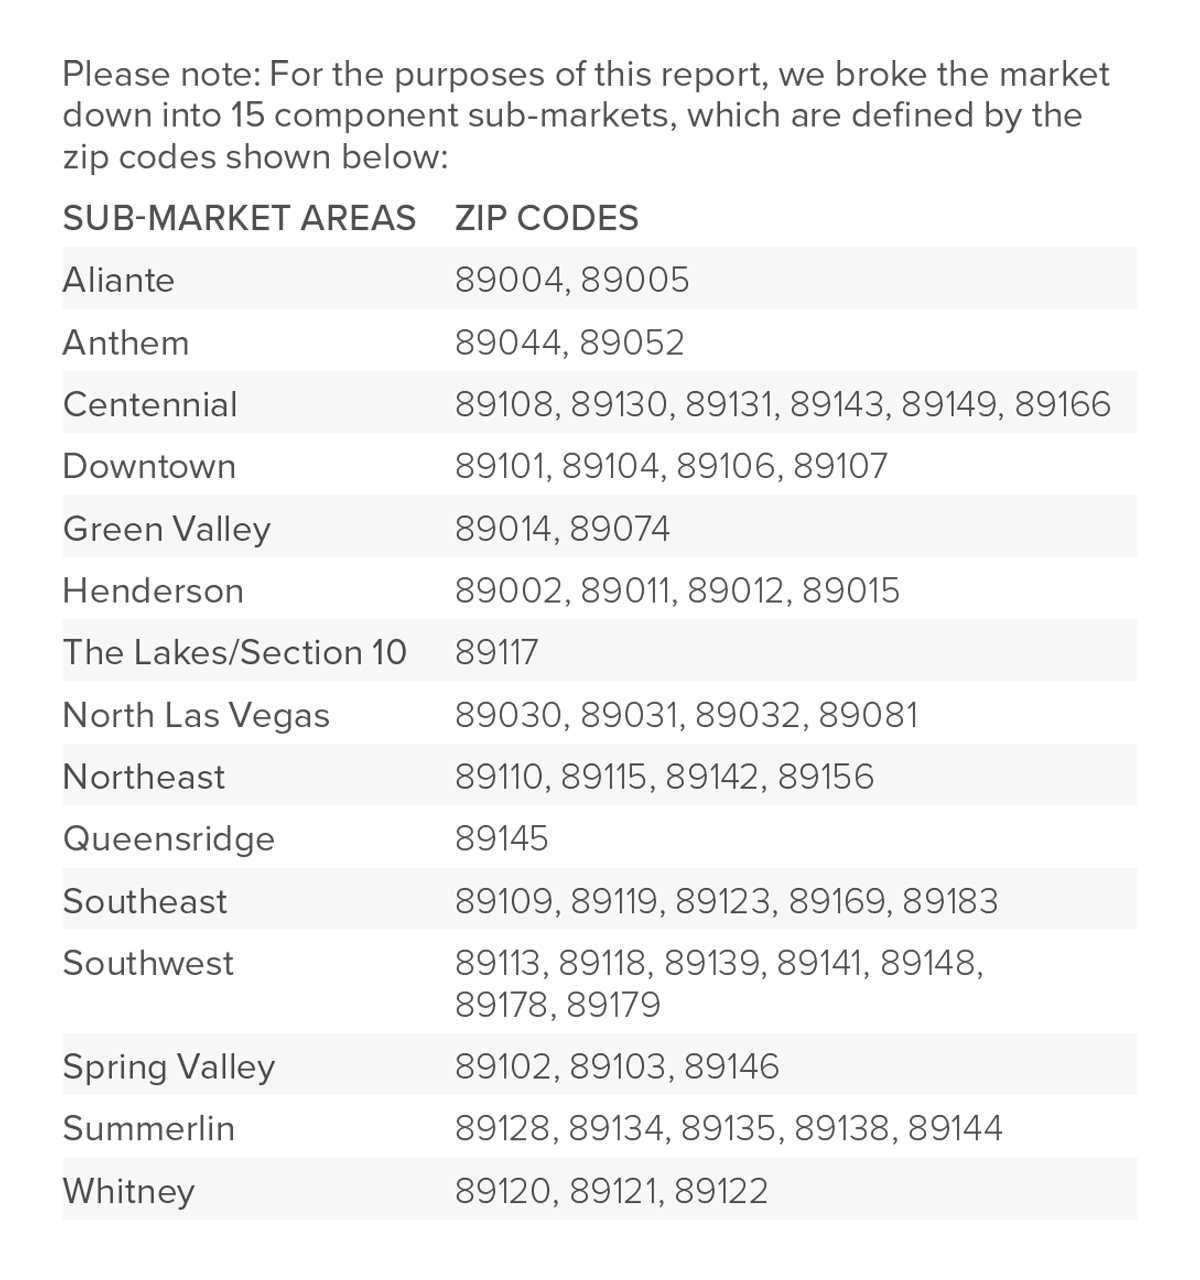
The following analysis of select counties of the greater Las Vegas real estate market is provided by Windermere Real Estate Chief Economist Matthew Gardner. We hope that this information may assist you with making better-informed real estate decisions. For further information about the housing market in your area, please don’t hesitate to contact your Windermere Real Estate agent.


Regional Economic Overview

Jobs continue to return to the Las Vegas market and the area has now recovered all but 13,100 of the 287,000 jobs that were lost during the pandemic. With almost 10,000 jobs added per month over the past year, I am hopeful that the area will return to preCOVID employment levels by spring. With rising employment, the jobless rate continues to drop. The latest data shows an unemployment rate of 5.3%, which is well below the pandemic-induced rate of 31.1%. If there is cause for concern, it is that the labor force remains at pre-pandemic levels. If employers are unable to find qualified workers, the pace of the job recovery may start to slow. As the country moves toward “post-COVID” life, I expect that leisure travel will continue to increase, which would be very good for a hospitality-driven market such as Las Vegas. This will certainly aid in the overall economic recovery in the region.

Nevada Home Sales

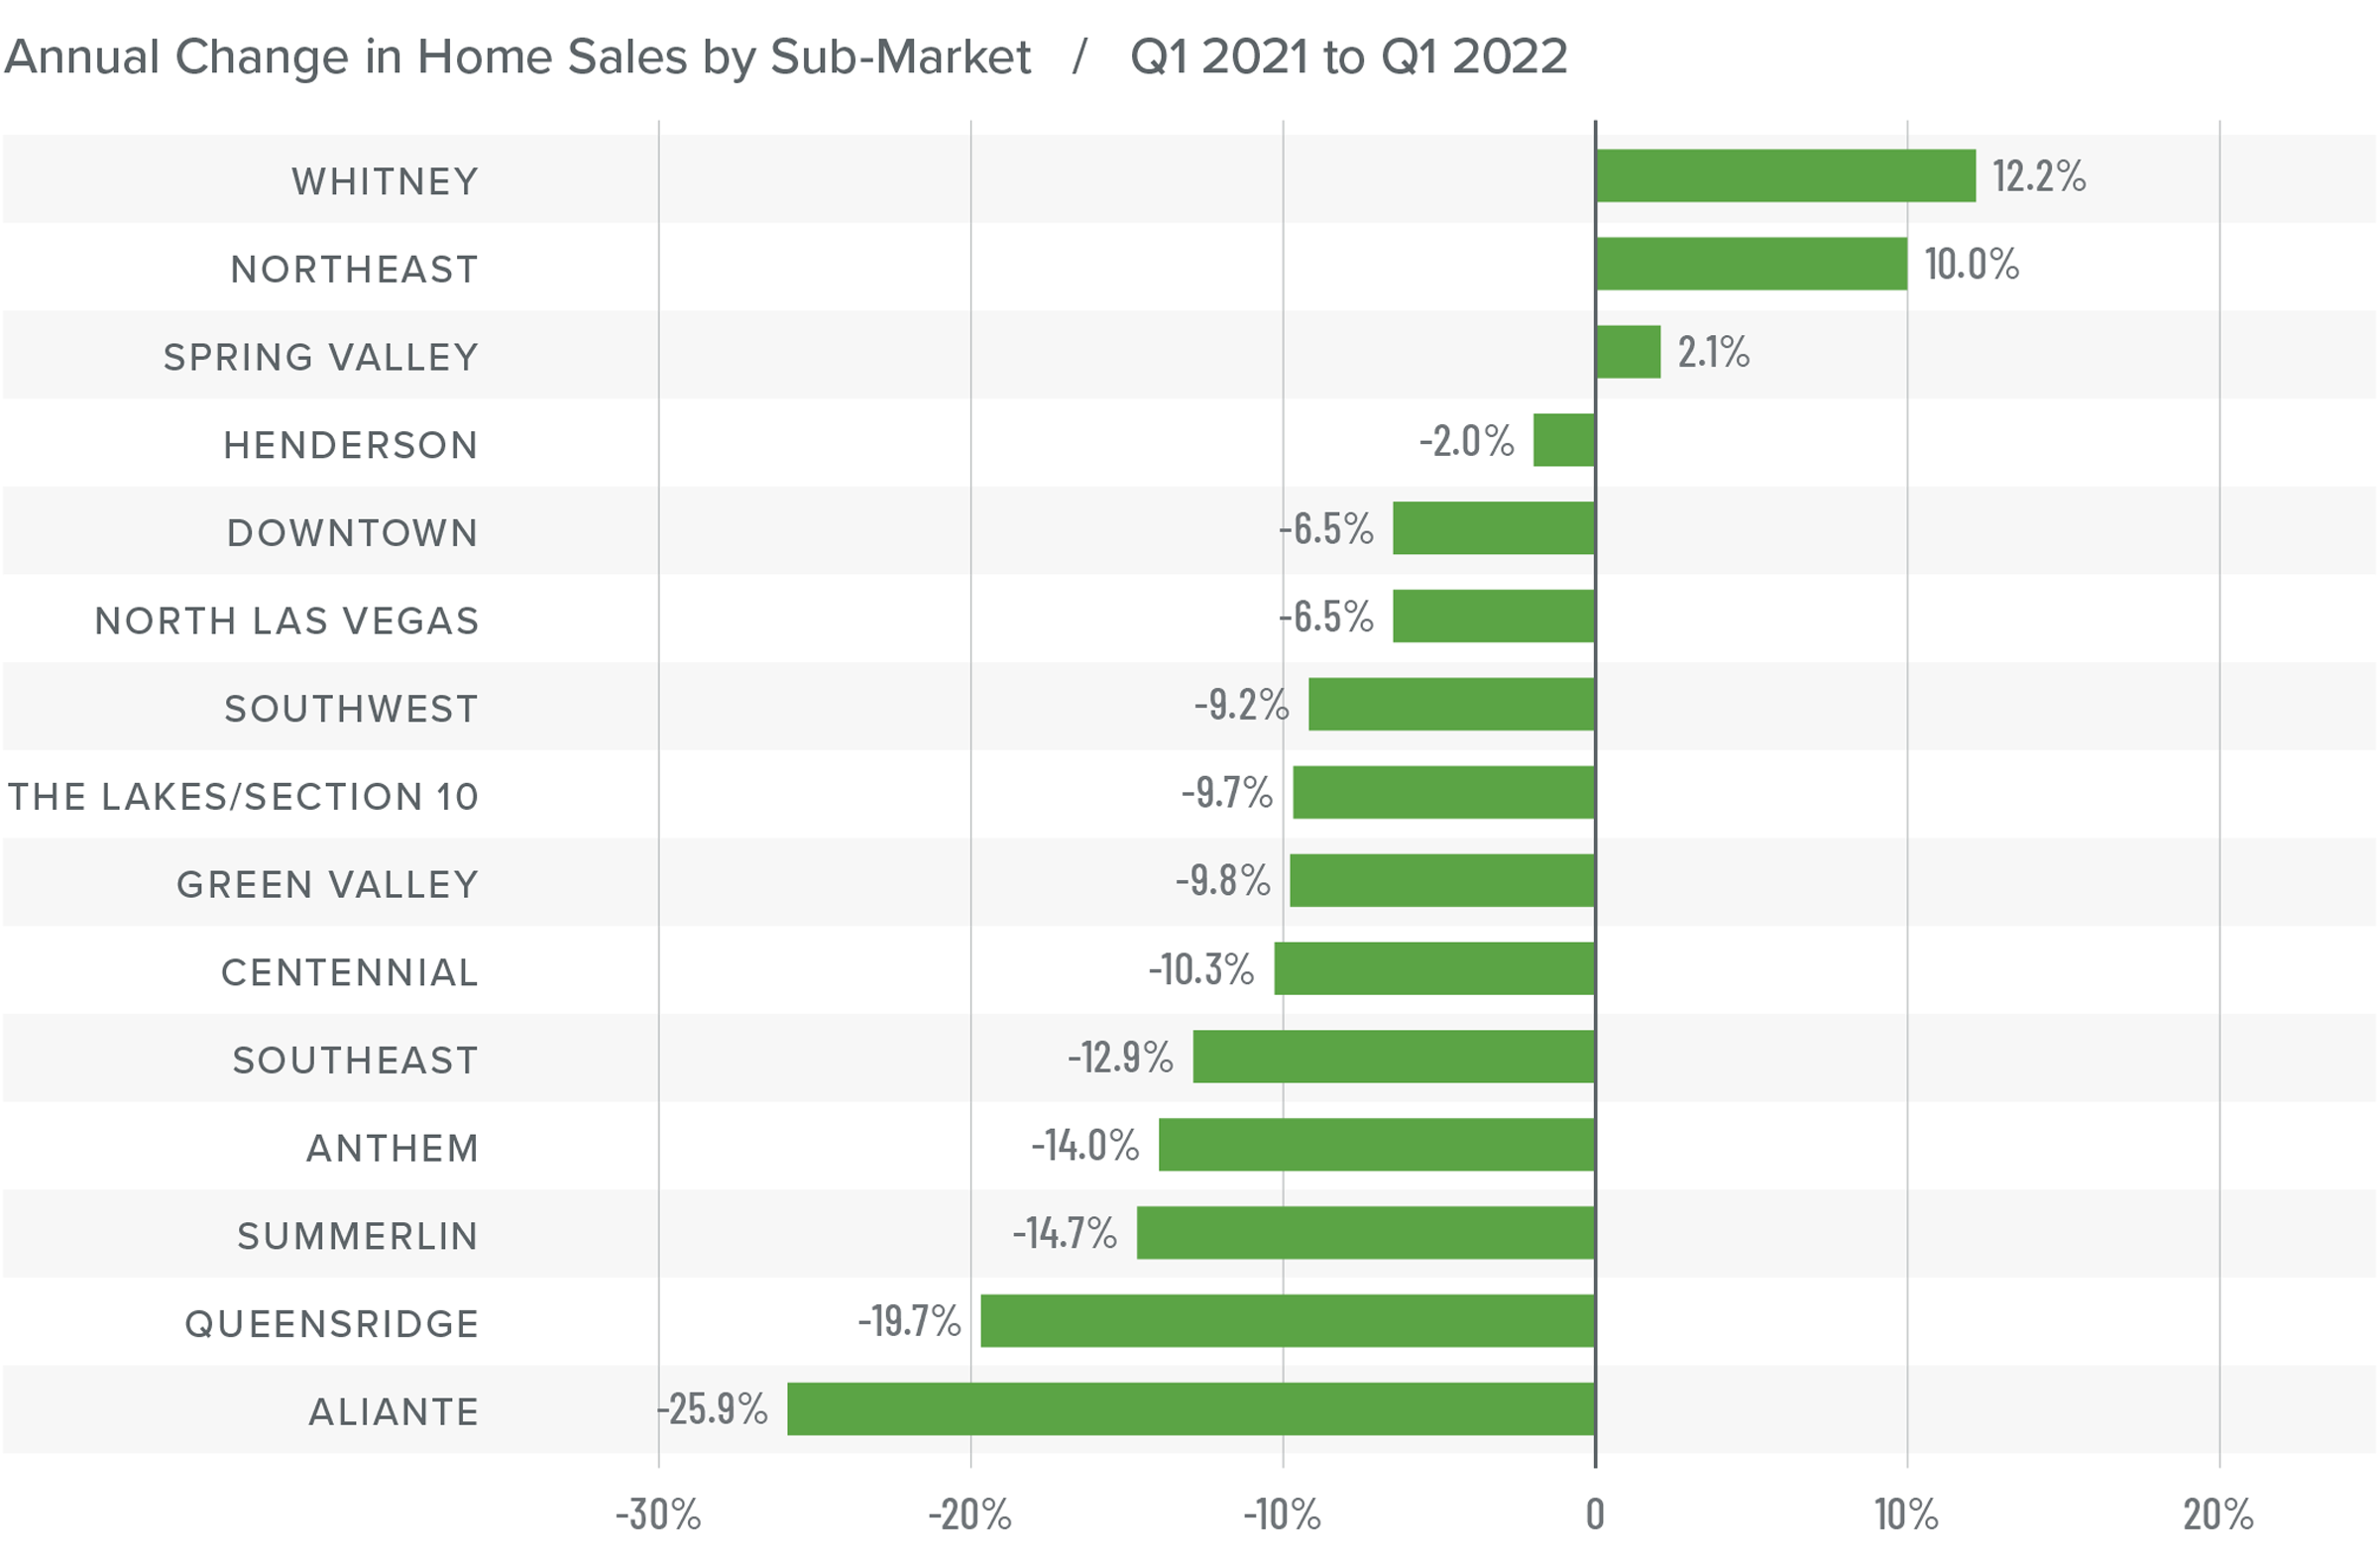
A total of 9,122 homes sold in the first quarter of the year—a drop of 7.3% compared to the same period a year ago. Sales were 10.8% lower than in the fourth quarter of 2021.

Sales rose in three of the neighborhoods contained in this report but dropped in all other areas compared to the first quarter of 2021. Compared to the previous quarter, all neighborhoods saw fewer sales.

Supply constraints persist, which is limiting sales. The average number of homes for sale was down 20% year over year and down an even more substantial 31% compared to the final quarter of 2021.

Pending sales, which are an indicator of future closings, increased 1.6% compared to the prior quarter, suggesting that closings in the second quarter of 2022 may show very slight improvement from the current numbers.

A bar graph showing the annual change in home sales for various areas in Greater Las Vegas, Nevada between Q1 2021 and Q1 2022.

Nevada Home Prices

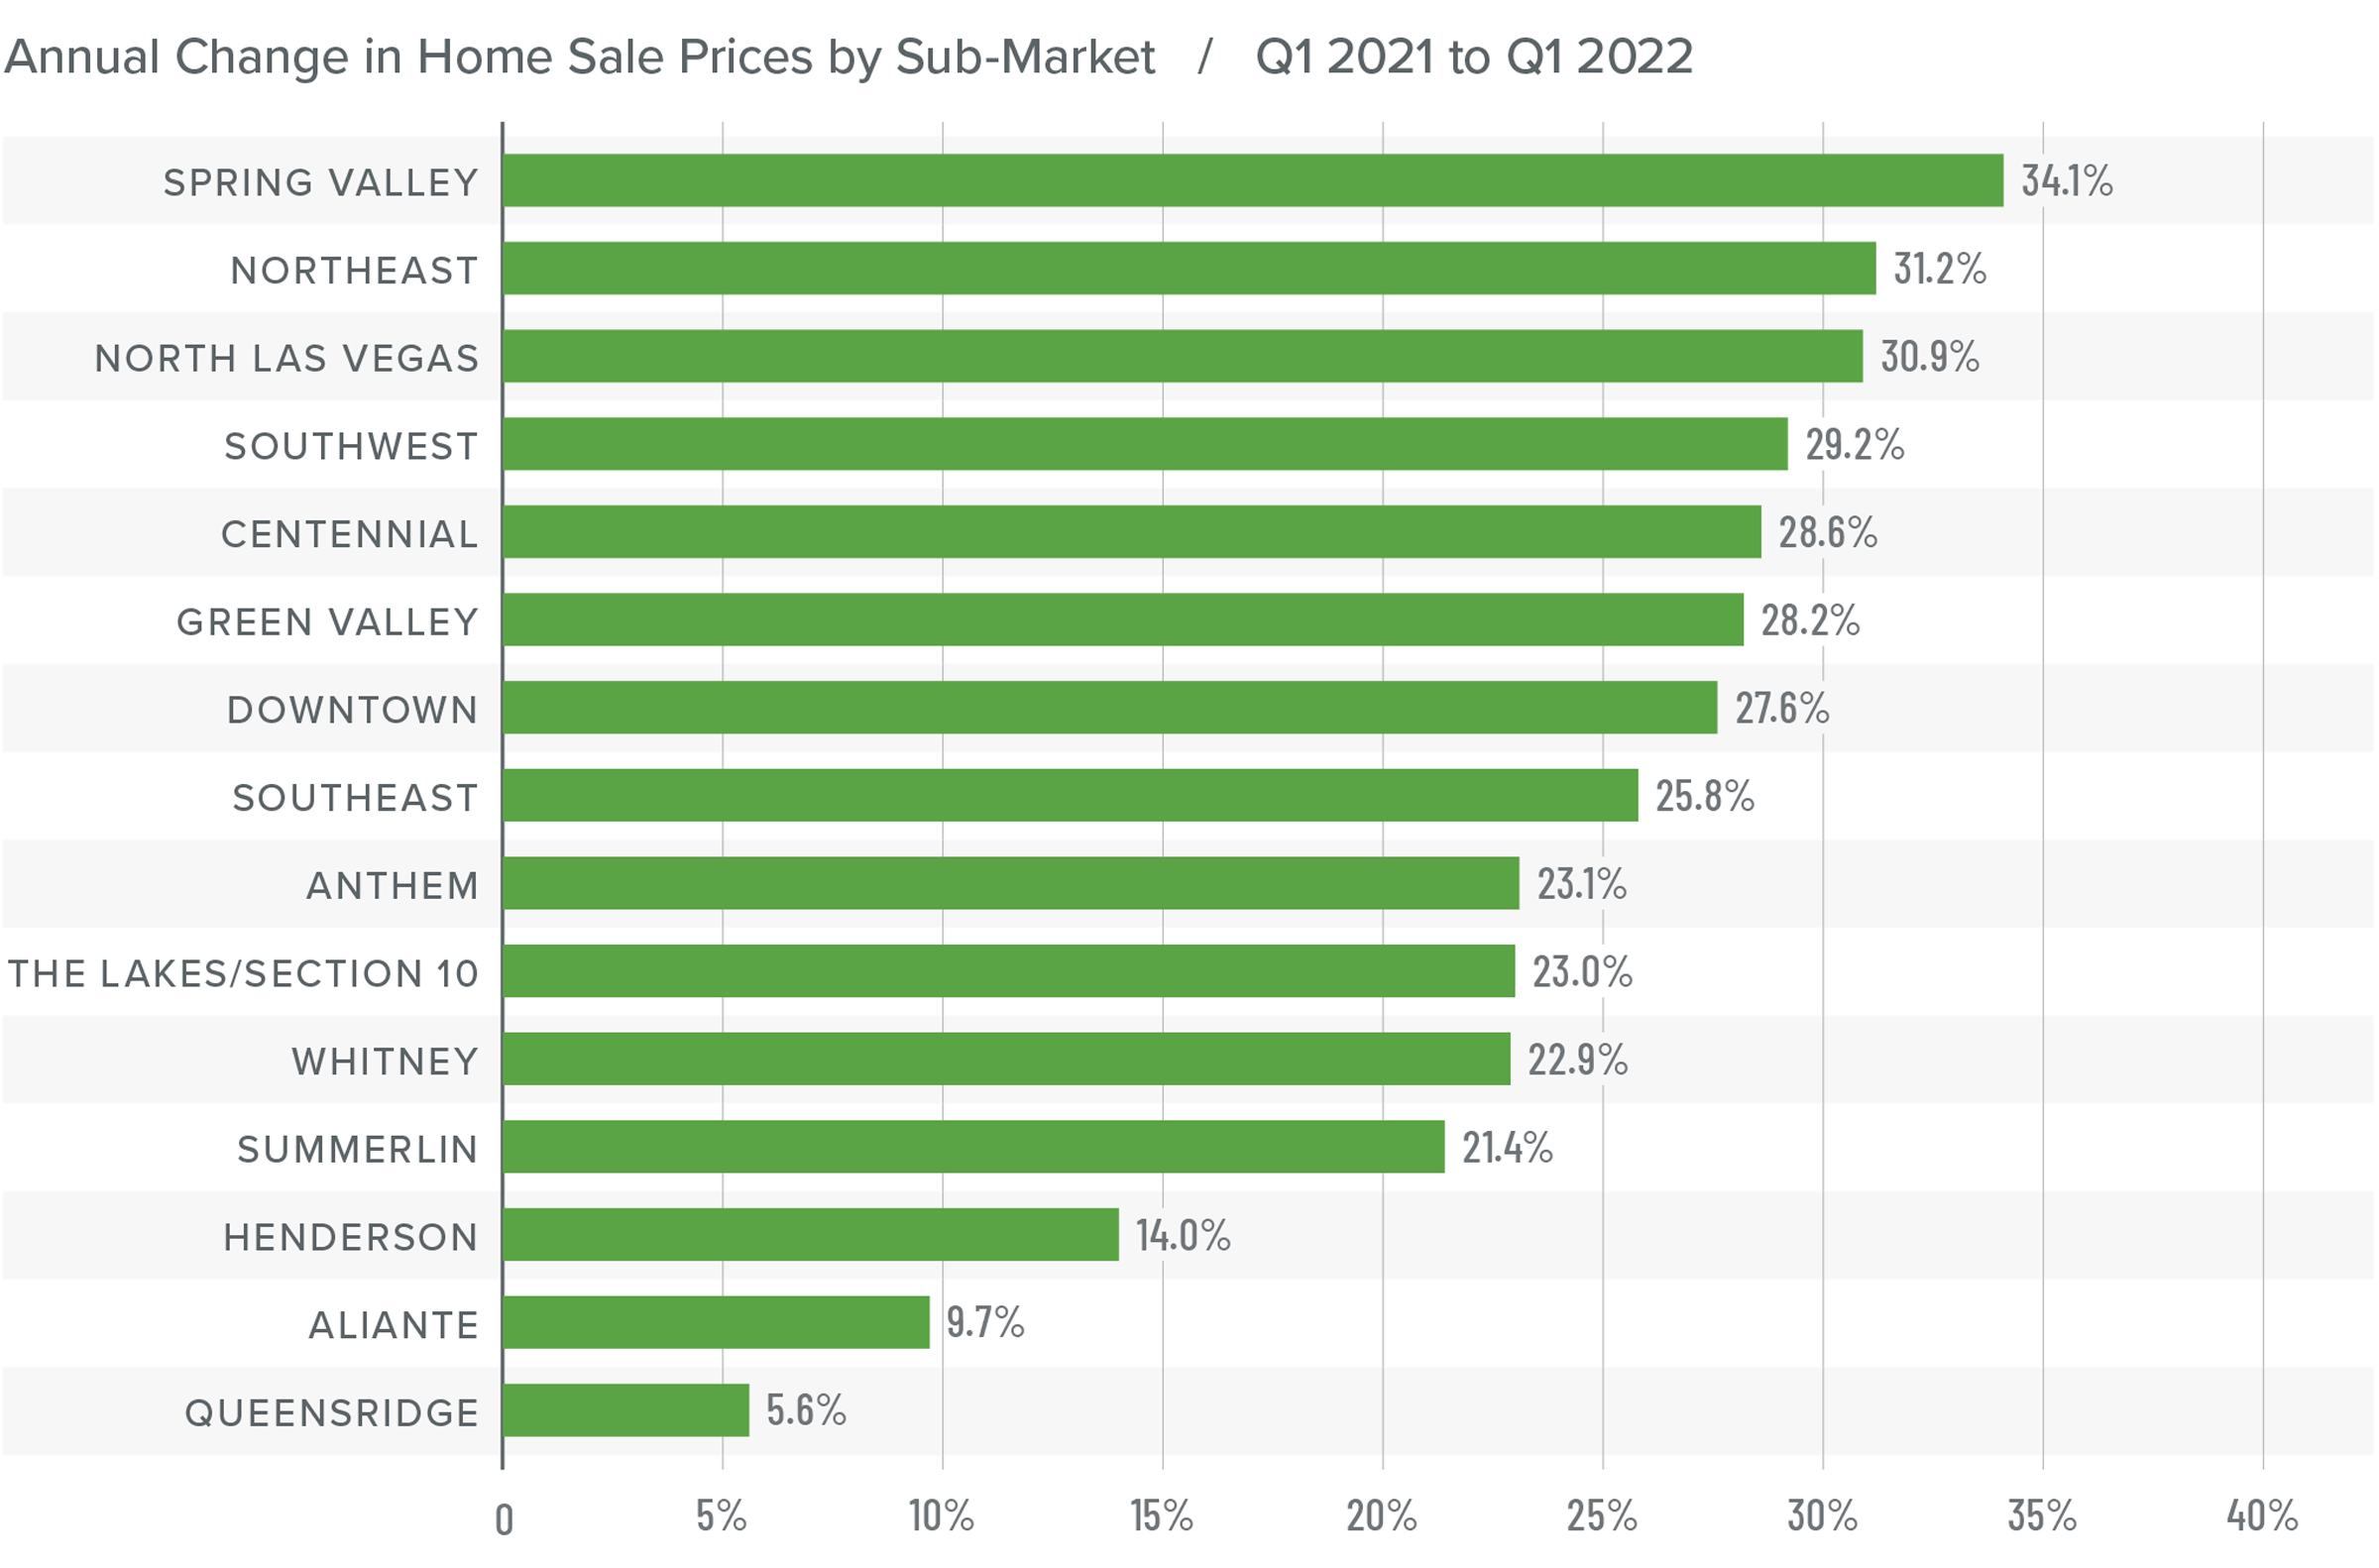
Home prices rose 23% from a year ago to an average of $485,820 and were 5.8% higher than in the fourth quarter of 2021.

I consider listing prices to be a leading indicator for shifts in the market. That they continue to trend higher suggests that sellers remain very confident that the market will be able to accommodate the higher financing costs buyers are facing.

Prices rose by double digits in all but two neighborhoods compared to the same quarter last year and rose in all markets other than Aliante compared to the fourth quarter of 2021.

The data suggests that rising mortgage rates have not impacted the market yet, but there is normally a lag between rising rates and any effect on prices or demand. The market clearly has more buyers than sellers, but it will be interesting to see if prices continue to rise at their current pace in the face of higher financing costs.

A map showing the year-over-year real estate market percentage changes in various areas of Greater Las Vegas, Nevada for Q1 2022.

A bar graph showing the annual change in home sale prices for various areas of Greater Las Vegas, Nevada from Q1 2021 to Q1 2022.

Mortgage Rates

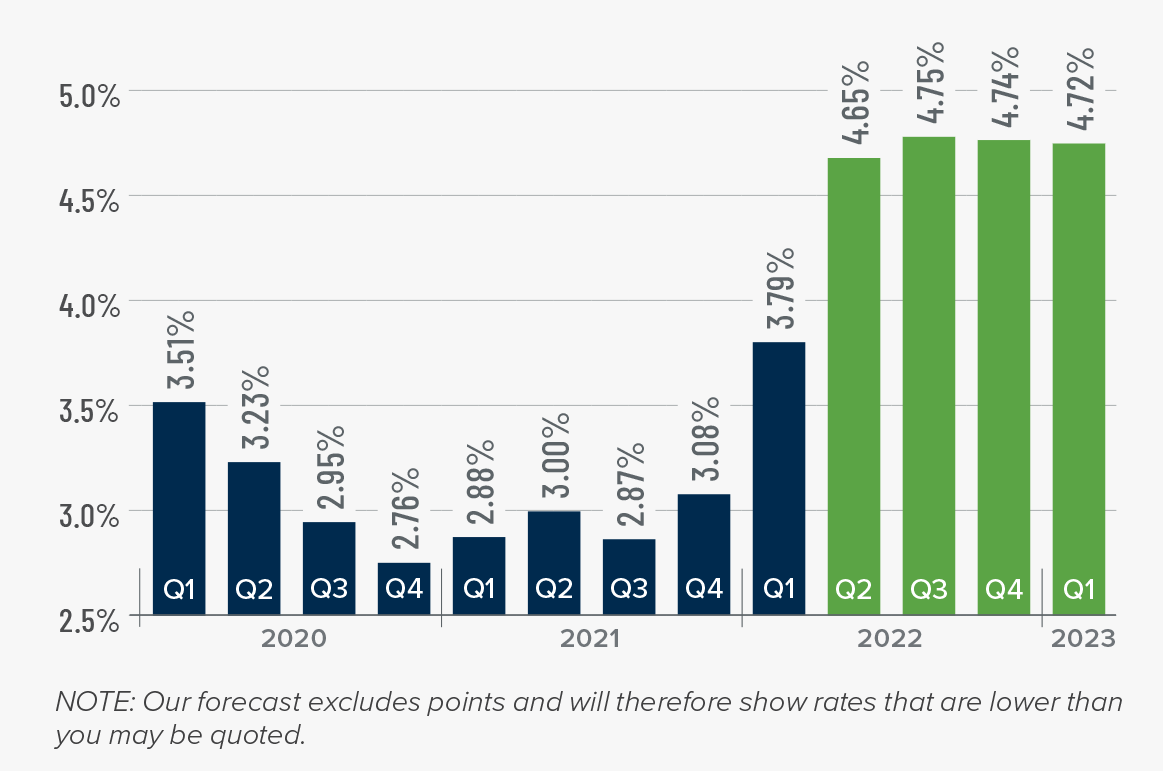
Average rates for a 30-year conforming mortgage were 3.11% at the end of 2021, but since then have jumped over 1.5%—the largest increase since 1987. The speed of the surge in rates is due to the market having quickly priced in the seven-to-eight rate increase that the Fed is expected to implement this year.

Because the mortgage market has priced this into the rates they are offering today, my forecast suggests that we are getting close to a ceiling in rates, and it is my belief that they will rise modestly in the second quarter before stabilizing for the balance of the year.

A bar graph showing the average rates for a 30-year conforming mortgage, plus Matthew Gardner's mortgage rate forecasts for Q2 2022 through Q1 2023.

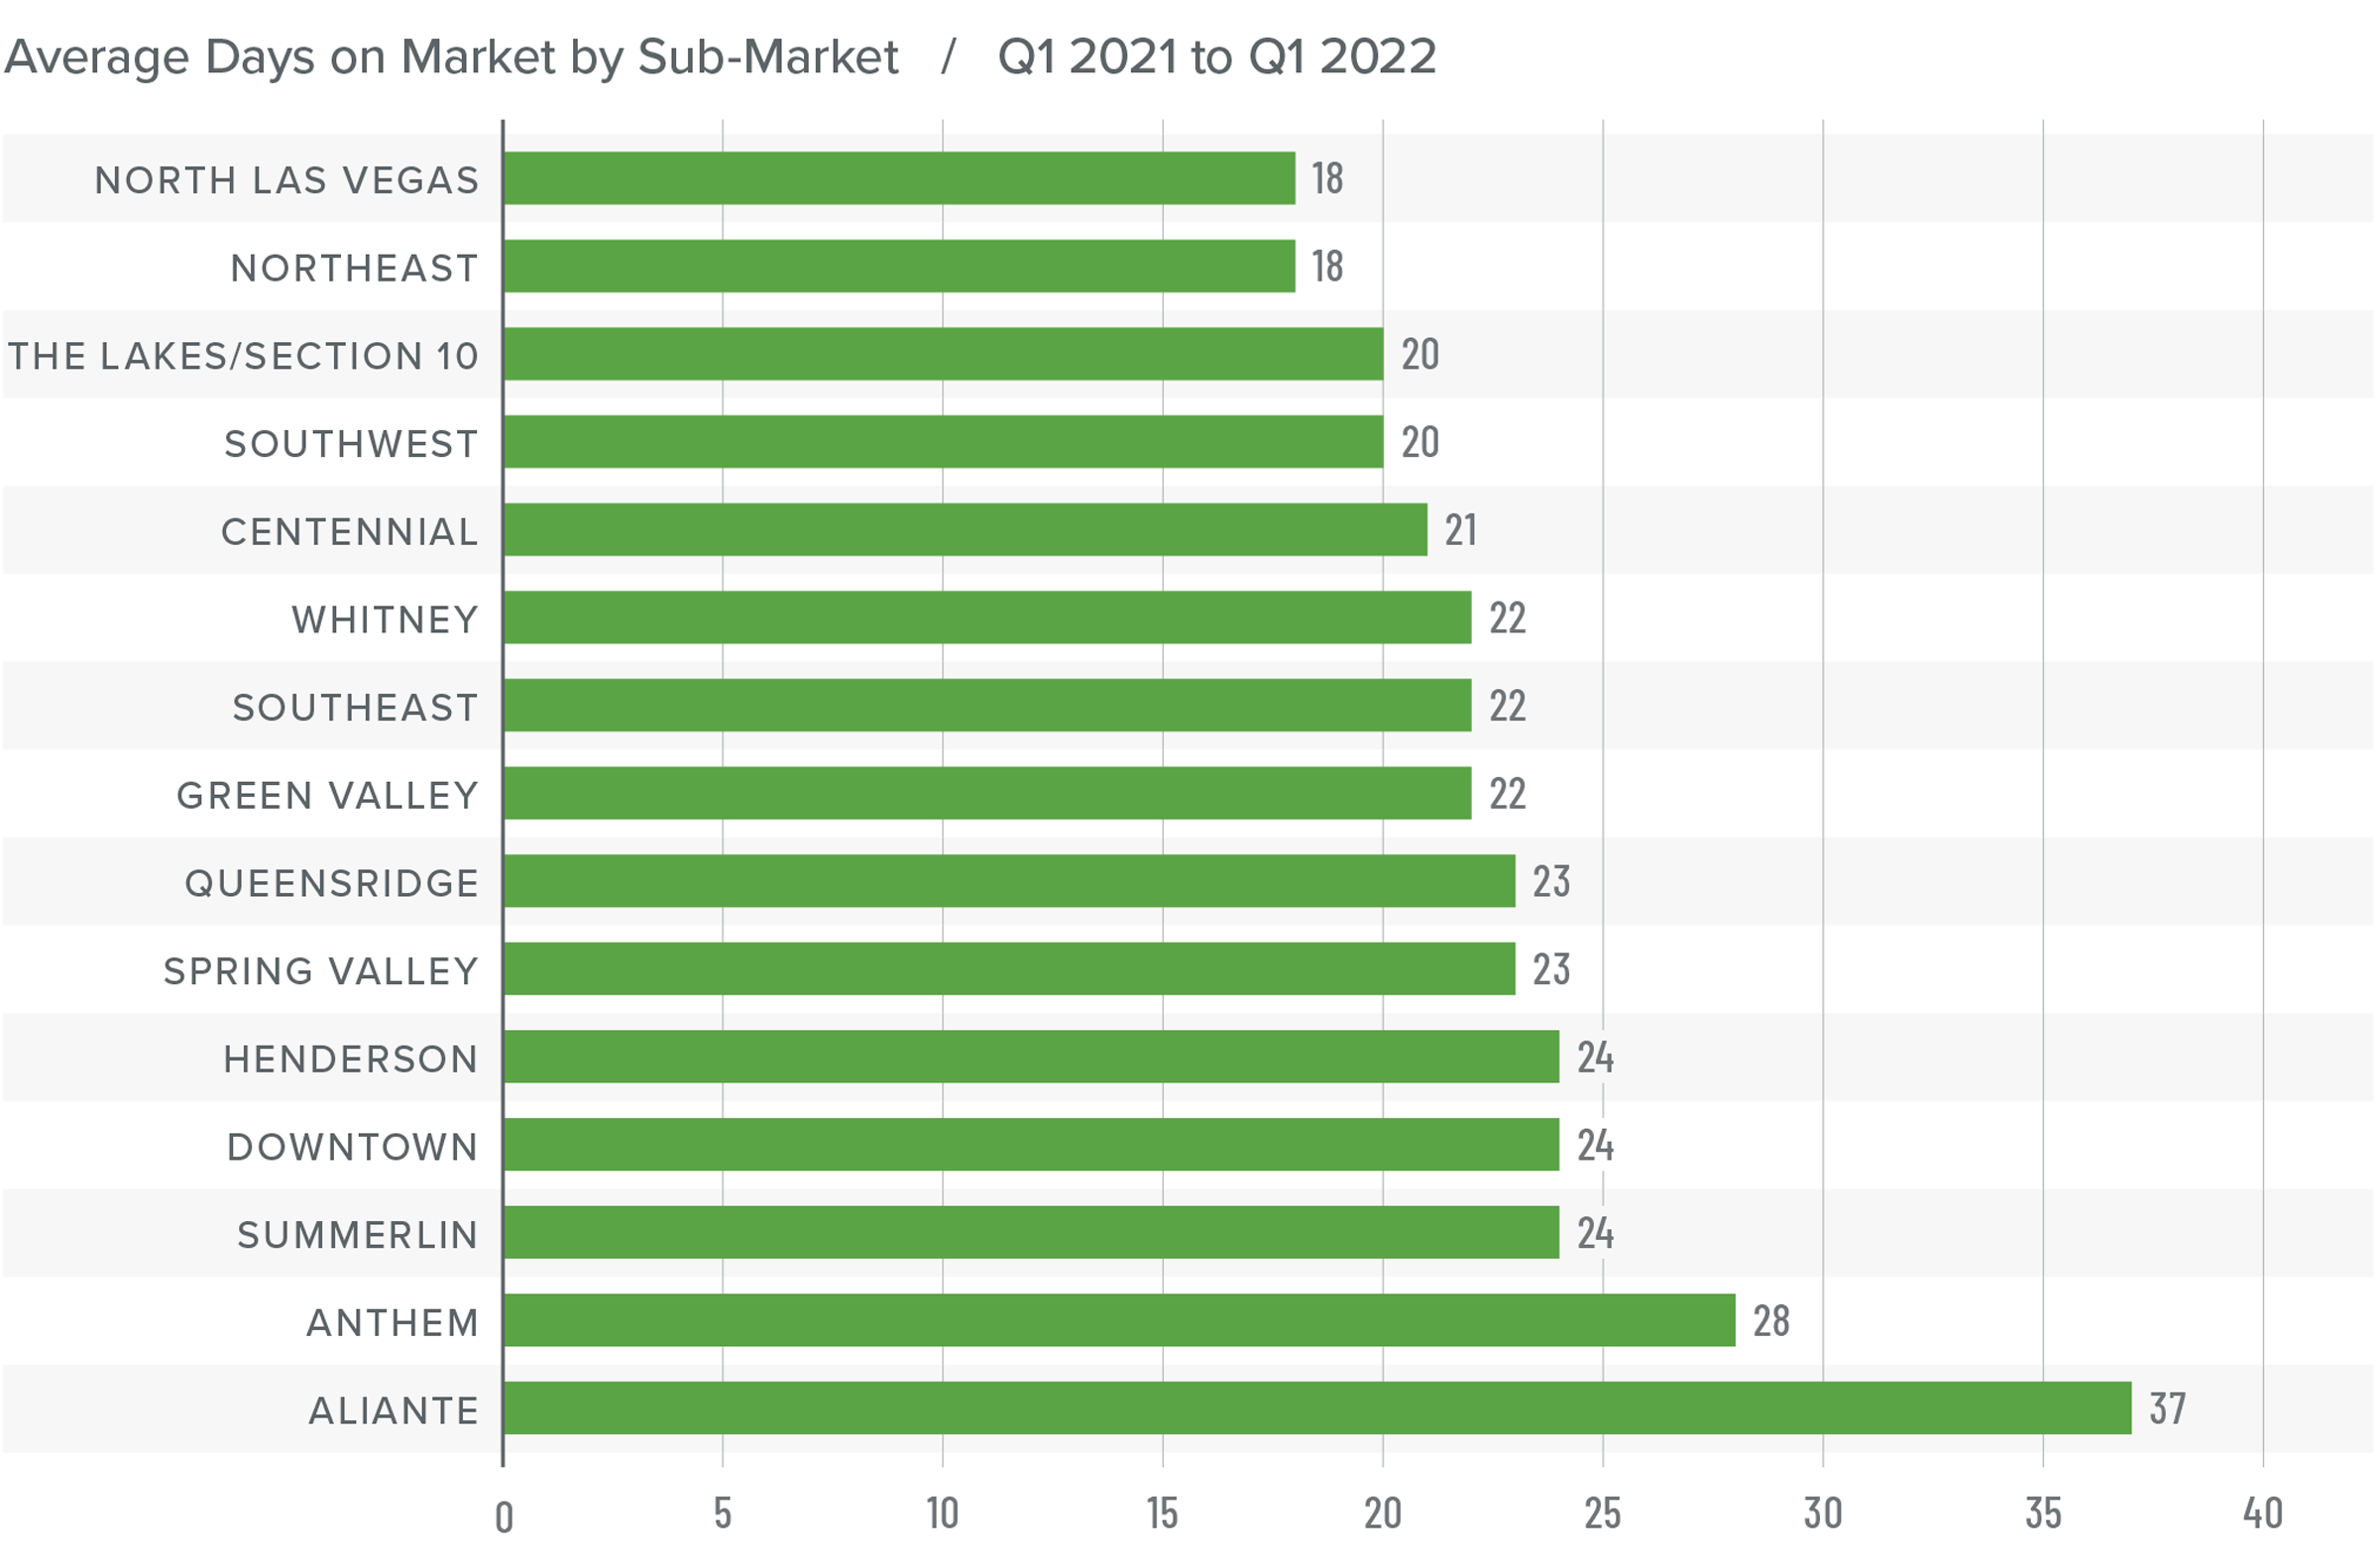
Nevada Days on Market

The average time it took to sell a home in the region dropped 16 days compared to the first quarter of 2021.

It took an average of 23 days to sell a home in the quarter, which matched the average market time in the fourth quarter of 2021.

Days-on-market dropped across the board compared to a year ago, but rose in Aliante, The Lakes/Section 10, Southeast and Southwest Las Vegas, Spring Valley, and Northeast Las Vegas compared to the prior quarter.

The greatest drop in market time was in The Lakes/ Section 10 neighborhood, where the length of time it took to sell a home fell 33 days compared to a year ago.

A bar graph showing the average days on market for homes in various areas of Greater Las Vegas, Nevada during Q1 2022.

Conclusions

This speedometer reflects the state of the region’s real estate market using housing inventory, price gains, home sales, interest rates, and larger economic factors.

The local economy appears to be picking up momentum, which typically translates into demand for housing. As mentioned earlier, if there are impacts to sales or prices from rising mortgage rates, we will likely see signs of this in the next two quarters. With supply levels as low as they are, rising financing costs may not slow the market significantly. Housing affordability continues to fall as price growth rises. This, combined with higher mortgage rates, should temper the market, though it hasn’t yet. It might seem intuitive to move the needle a little toward home buyers, but the numbers don’t justify it.

A speedometer graph indicating a seller's market in Greater Las Vegas, Nevada during Q1 2022.

All things considered, I have left the needle in the same position as the last quarter. There are too many uncertainties that preclude me from moving it one way or another. Hopefully the spring will provide more clarity.

About Matthew Gardner

Matthew Gardner - Chief Economist for Windermere Real Estate

As Chief Economist for Windermere Real Estate, Matthew Gardner is responsible for analyzing and interpreting economic data and its impact on the real estate market on both a local and national level. Matthew has over 30 years of professional experience both in the U.S. and U.K.

In addition to his day-to-day responsibilities, Matthew sits on the Washington State Governors Council of Economic Advisors; chairs the Board of Trustees at the Washington Center for Real Estate Research at the University of Washington; and is an Advisory Board Member at the Runstad Center for Real Estate Studies at the University of Washington where he also lectures in real estate economics.

Market News May 4, 2022

Q1 2022 Utah Real Estate Market Update

The following analysis of select counties of the Utah real estate market is provided by Windermere Real Estate Chief Economist Matthew Gardner. We hope that this information may assist you with making better-informed real estate decisions. For further information about the housing market in your area, please don’t hesitate to contact your Windermere Real Estate agent.


Regional Economic Overview

The Utah economy continues to impress, with total employment up 3.8% year over year. Of greater significance: current employment levels are now 78,600 higher than the pre-pandemic peak. The counties covered by this report added almost over 48,400 new jobs over the past year, representing a growth rate of 3.7%. Thanks to the state’s robust economy, the unemployment rate dropped to 2%, which is the lowest level recorded since the Labor Department started keeping records in 1976. Moreover, this remarkably low level of unemployment comes while the labor force rose above the 1.7 million mark—a level never before seen.

Utah Home Sales

In the first quarter of 2022, 6,493 homes were sold, which is a drop of 7.5% year over year. There were 29.1% fewer sales than in the fourth quarter of 2021.

Year over year, sales rose in four of the seven counties contained in this report, but fell in the balance of the region.

Inventory levels remain well below the average, which is clearly limiting sales. The number of homes for sale was down 30.9% from the previous quarter, and down 5.6% from the same period a year ago.

Pending sales, which are an indicator of future closings, fell 9.2% from the final quarter of 2021, suggesting that second quarter closings may remain below average.

A bar graph showing the annual change in home sales for various counties in Utah between Q1 2021 and Q1 2022.

Utah Home Prices

With more demand than supply, it wasn’t surprising that home prices picked up. Year over year, prices rose 19.5% to an average of $639,131. Prices were 6.1% higher than in the fourth quarter of 2021.

Compared to the final quarter of last year, prices rose in all counties other than Morgan, with Summit County jumping more than 20%.

All areas contained in the report except for Morgan County saw prices increase by double digits. The pullback in Morgan County is not a concern given that it is a very small market.

Mortgage rates increased in the first quarter but, as there is normally a lag between rising financing costs and their impact on sales or prices, it’s too early to tell if the market will experience any slowing. We will have a better idea in the second quarter report.

A map showing the year-over-year real estate market percentage changes in various counties in Utah for Q1 2022.

A bar graph showing the annual change in home sale prices for various counties in Utah from Q1 2021 to Q1 2022.

Mortgage Rates

Average rates for a 30-year conforming mortgage were 3.11% at the end of 2021, but since then have jumped over 1.5%—the largest increase since 1987. The speed of the surge in rates is due to the market having quickly priced in the seven-to-eight rate increase that the Fed is expected to implement this year.

Because the mortgage market has priced this into the rates they are offering today, my forecast suggests that we are getting close to a ceiling in rates, and it is my belief that they will rise modestly in the second quarter before stabilizing for the balance of the year.

A bar graph showing the average rates for a 30-year conforming mortgage, plus Matthew Gardner's mortgage rate forecasts for Q2 2022 through Q1 2023.

Utah Days on Market

The average time it took to sell a home in the counties covered by this report dropped eight days compared to the first quarter of 2021.

Homes again sold fastest in Davis County, and market time dropped in all but three counties compared to a year ago. The greatest decline in market time was in Summit County, where it took 31 fewer days to sell a home.

During first quarter, it took an average of 24 days to sell a home in the region. Market time fell year over year. It also took 4 fewer days for a home to sell than in the final quarter of last year.

With days on market dropping across the board compared to the prior quarter, it’s clear that there is significant demand for the few homes that are available.

A bar graph showing the average days on market for homes in various counties in Utah during Q1 2022.

Conclusions

This speedometer reflects the state of the region’s real estate market using housing inventory, price gains, home sales, interest rates, and larger economic factors.

In last quarter’s Gardner Report, I suggested that home prices would continue to rise in 2022 but at a modestly slower pace than in 2021. Although it would be easy to assume that the jump in mortgage rates will cause price growth to slow more significantly, I am not sure whether that will be the case. As tight as the labor market is, rising incomes will likely offset most of the potential pain from higher mortgage payments. The region clearly heavily favors sellers, and I don’t expect this to change this year. While the full impact of rising mortgage rates has yet to be felt, I don’t believe it will be overly burdensome for buyers.

A speedometer graph indicating a seller's market in Utah during Q1 2022.

Given all of this, I have left the needle in the same position as last quarter. Though the data points to another very solid year for housing, I am waiting for the spring figures to determine if rising mortgage rates will cause any slowing to this supply-starved market.

About Matthew Gardner

Matthew Gardner - Chief Economist for Windermere Real Estate

As Chief Economist for Windermere Real Estate, Matthew Gardner is responsible for analyzing and interpreting economic data and its impact on the real estate market on both a local and national level. Matthew has over 30 years of professional experience both in the U.S. and U.K.

In addition to his day-to-day responsibilities, Matthew sits on the Washington State Governors Council of Economic Advisors; chairs the Board of Trustees at the Washington Center for Real Estate Research at the University of Washington; and is an Advisory Board Member at the Runstad Center for Real Estate Studies at the University of Washington where he also lectures in real estate economics.