More November 29, 2021

National Homeless Youth Awareness Month

The Windermere Foundation was founded in 1989 to support low-income and homeless families in the communities where Windermere has a presence. In honor of National Homeless Youth Awareness Month, we’ve compiled the following list of organizations that support and aid the young homeless population in our country.

Each year, an estimated 4.2 million youth and young adults experience homelessness in the United States, of which 700,000 are unaccompanied minors (ncsl.org). The most common causes of youth homelessness include a lack of affordable housing, economic hardship, substance abuse of a family member, parental neglect, objection to sexual orientation or gender identity and mental health disorders.

Unaccompanied homeless youth are at a higher risk of anxiety disorders, depression, post-traumatic stress, and suicide due to increased exposure to violence while living on their own. Learn more about the causes and consequences of youth homelessness online at ncsl.org (National Conference of State Legislators).


Here are some ways you can support homeless youth in your community:


Organizations who have been supported by the Windermere Foundation: 

The Windermere Foundation supports, among others, the following organizations dedicated to helping homeless youth and families in their communities. To support these organizations, donate to the Windermere Foundation through your local Windermere office.


To find out more about the Windermere Foundation or to make a donation, please visit, windermerefoundation.com. To donate, click the button below.


content_Donate_button.jpg

Selling November 22, 2021

7 Mistakes to Avoid When Selling a Home

Mistakes in the selling process can throw your plans off course, causing costly delays. But by knowing what mistakes to avoid ahead of time, you can save yourself the headache and the expense. Steer clear of these common mistakes as you work alongside your agent towards a successful sale.

7 Mistakes to Avoid When Selling a Home

1. Skipping Repairs

Neglecting to make repairs to your home before you sell not only makes it less appealing to buyers, but it can also open you up to additional costs that result from the buyer’s inspection. If you fail to disclose any repairs that need to be made, it could halt the closing process or cause the deal to fall through. Consider conducting a pre-listing inspection to make sure everything is out in the open before you sell.

2. Not Working with an Agent

Listing agents help sellers accurately price their home, coordinate showings and open houses, and negotiate with buyers’ agents to get the best deal for their client. Choosing not to work with an agent can open you up to several risks. Selling a home is an intricate, complicated process that needs the guiding hand of a professional, so it’s no wonder that a vast majority of sellers choose to work with an agent.

3. Incorrectly Pricing Your Home

The key to selling your home quickly is to find the right buyers. To find the right buyers, your home must be correctly priced. Agents use a Comparative Market Analysis (CMA)—a thorough, data-backed examination of your home and how it compares to other listings in your area—to accurately price your home. Without an agent’s CMA, it’s easy for your home to be listed at the wrong price, leading to the following consequences.

    • Overpricing Your Home: Overpricing your home will attract the wrong buyers because you will force your home into competition with other listings that are fundamentally superior or have more to offer. When comparing other homes to yours, buyers will focus on the discrepancies and the features your home lacks. Overpricing will often cause homes to sit on the market for extended periods of time and become less appealing to buyers.
    • Underpricing Your Home: Under competitive market conditions, intentionally underpricing a home is a common strategy to attract buyer attention with the goal of starting a bidding war to drive the price of the home up. However, several things must go correctly for this to happen. In all other cases, underpricing your home reflects a lack of knowledge about where its market value fits into the fabric of current local market conditions and can leave you, the seller, unsatisfied with the price your home ultimately fetches.

4. Letting Your Emotions Take Over

Selling your home is an act of learning how to let it go. Once you know you’re ready to sell, you’ll need to be able to look at it with an objective eye. This will allow you to approach conversations with your agent from a neutral standpoint and work towards what is best for the sale of the home. If you’re too emotionally attached, you may find that you have trouble agreeing with your agent when it comes to negotiations. Overall, emotions can cloud your judgement and make the successful completion of the transaction more complex. If you’re struggling with tabling your emotions, talk to your agent for guidance.

5. Not Prioritizing Photography

One of the hard truths for selling a home is that first impressions matter. The vast majority of buyers are searching online and taking virtual tours of homes they’re interested in. As such, it’s worth the time and money to hire a high-quality photographer. The right photography can make all the difference in the minds of buyers. An aesthetically pleasing home will attract more eyes, and any edge you can give your home over competing listings may be just the ticket to getting it sold.

6. Selling Before You’re Ready

It may be tempting to want to get your house on the market quickly to take advantage of local market conditions, but if the time isn’t right for you, rushing into the market could cause more trouble than it’s worth. Knowing when to sell your home is a mixture of being financially prepared, finding the right agent, and understanding how your home fits into the current local market landscape.

7. Refusing to Negotiate

Approaching buyers’ offers with a cold shoulder can lead to missed opportunities. Before the offers start to come in, it’s important to work closely with your agent to understand your expectations and which terms and contingencies you’re willing to negotiate. That way, you can quickly identify the right offer when it comes along. If you’re unwilling to negotiate, it can drive buyers away and leave potential deals on the table.


Before you sell, get to know what costs you can expect to encounter during the process: 10 Costs Associated with Selling Your Home

Design November 17, 2021

How to Upgrade Your Dining Room

The dining room is a place of gathering, comfort, and community. Creating the right mood in the space is a matter of choices in décor and design. For example, a traditional dining room creates a heartwarming tone whereas a modern one feels minimalist and light. Homeowners can often feel puzzled when trying to upgrade their dining room, since it typically isn’t as simple as buying new appliances or green-lighting a remodeling project. Here are some simple ideas to help you upgrade your dining room and achieve the atmosphere you’re looking for.

How to Upgrade Your Dining Room

Lighting

A light fixture is often the centerpiece of a dining room. Your choice in lighting can greatly reinforce the dining room theme you’re going for, so look for fixtures that reinforce the other elements of the space. A chandelier will add a formal touch to the room, while more modern fixtures like pendant and warehouse lights can deliver a sense of chic sophistication. If you plan to hang a chandelier, keep in mind that the bottom of the fixture should hang roughly three feet above the dining room table. If you have vaulted ceilings, it should hang even higher.

Flooring

A full dining room upgrade happens from the ground up. If your flooring is outdated or showing signs of wear and tear, it’s the perfect time to add a flooring upgrade to your project list. Choosing the right flooring is a matter of identifying what material will work best in the space, assessing your budget, and forming a plan for installation. Materials like vinyl, ceramic tile, and hardwood are popular options, not only for their durability, but also because they’re easy to clean. Other niche options like cork or concrete can help create a specific ambience but may not be as widely available. Once you’ve decided on your material, talk to local contractors to compare installation quotes. There are pros and cons to installing flooring on your own or hiring a professional; know what they are before making a final decision.


A dining room with hardwood floors, black chairs, and a black table.

Image Source: Shutterstock – Image Credit: Artazum


Table & Chairs

When it comes down to it, the essential function of your dining room is to provide a setting for enjoying a meal. Together with your main lighting fixture, your table and chairs help to form the focal point of the room. Size is a critical component of your dining room table. There’s a Goldilocks dynamic with dining room tables. The larger the table, the more room everyone has, but the more space it takes up. Make sure to take exact measurements before shopping around so you know exactly what size you’re looking for.

Your chairs will reinforce the look and feel of your table. Consider balancing wood grains and matching colors. For example, if your dining room table is designed with intricate wood grain, look at chair sets with simple colors and designs to bring balance to the room. When it comes to the height of the seats, arms, and back, choose dimensions that suit the dining experience you’re looking to create. Generally, high-backed, narrower chairs create a more formal atmosphere than their rounded, modern counterparts. Either way, choose the combination that looks best to you and feels most comfortable.


Image Source: Shutterstock – Image Credit: JR-stock


Color & Décor

A fresh coat of paint can take a dining room from stale to lively in a hurry. If you’re thinking about painting your dining room, think about how the color scheme would complement and/or contrast with the colors elsewhere in your home. A contrasting color will help differentiate the space, while a complimenting color will help to tie things together. New color in the dining room doesn’t have to come exclusively from painting a wall. Colored furniture pieces, decorative throw pillows, placemats, and table décor can help liven the space as well. Curtains and drapes can add a splash of color while softening the room, and when paired together with a decorative rug, can make your colors pop at different eye levels.


For more information on how to upgrade the space in your home, read our Guide to Upgrading Your Bedroom.

Market News November 15, 2021

11/15/2021 Housing and Economic Update from Matthew Gardner

This video is the latest in our Monday with Matthew series with Windermere Chief Economist Matthew Gardner. Each month, he analyzes the most up-to-date U.S. housing data to keep you well-informed about what’s going on in the real estate market. 


Hello there!  I’m Windermere Real Estate’s Chief Economist, Matthew Gardner, and welcome to the latest episode of Mondays with Matthew.

Before I get started, I wanted to let you know that this will be the final episode of Monday with Matthew for 2021 as I’m going to be taking Christmas off. So it’s time to offer you my forecasts for the U.S. economy and the country’s housing market in 2022.

Although many people – including myself – had hoped that COVID-19 would have become a somewhat distant memory by now, and that the economy would have recovered this was – sadly – not to be the case, and the pandemic’s influence on the economy is still being felt and all the datasets I track tell me that, although we are certainly healing, COVID continues to act as a drag on economic growth and I expect that to continue through the spring of next year – if not a little longer.

Economic Recovery & Growth

And it’s because of this that I – along with many other economists – have spent the last few months lowering our forecasts for economic growth – at least through the middle of 2022. So, let’s look at this a little closer. 


A slide of two bar graphs. The bar graph on the left is titled "United States Real Gross Domestic Product," showing Q1 2020 through Q4 2022 on the x-axis and negative 40 percent to 40 percent on the y-axis. The low GDP was in Q2 2020 around negative 30 percent and the high was Q3 2020 at over 30 percent. The second graph is title "U.S. Rea; Gross Domestic Product History & Forecast," showing the years 2015 through 2022 on the x-axis and negative 4 percent through 6 percent on the y-axis. The lowest annual percentage change was negative 3.4 percent in 2020 and the highest was 4.9 percent in 2021.


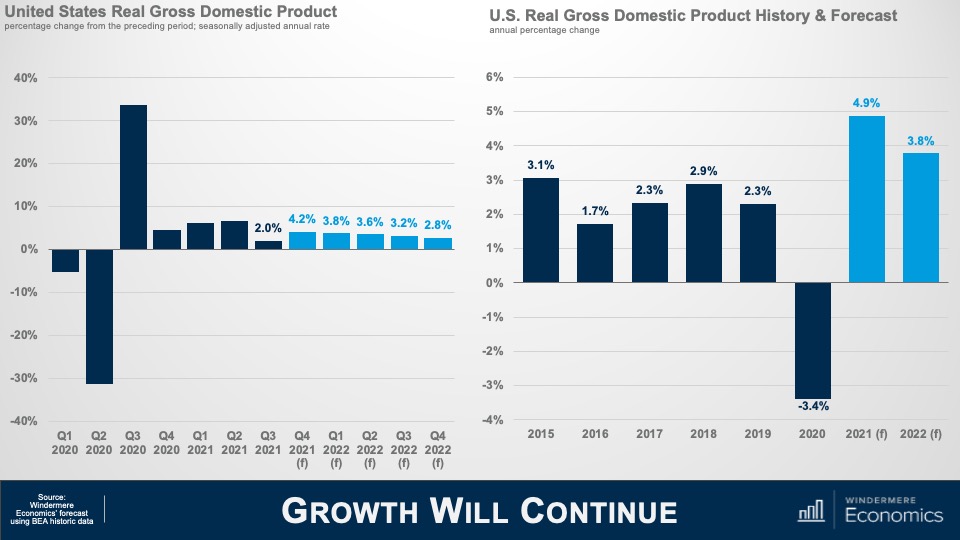
Here is my forecast for economic growth through the end of next year and you will note that, even though I am cautious in regard to the economy as we move through the winter and into 2022, I am still expecting to see a fairly decent bounce back in the fourth quarter of this year following the very disappointing rate that we saw in Q-3.

And on an annualized basis, I believe that the economy will have expanded by just shy of 5% this year and come in a little below 4% in 2022.

Simply put, the impacts of COVID-19 are going to continue to act as a drag on virus sensitive consumer services next year and ongoing supply chain issues will also delay inventory restocking. Both of these impacts have a depressing effect, in more ways than one, on economic growth, but I don’t see any chance that we will fall back into a recession.


A bar graph titled "Non-Farm Payrolls: Average Monthly Change & Forecast," with Q4 2019 through Q4 2022 on the x-axis and figures in the thousands from negative 5,000 to 2,000 on the y-axis. The low was negative 4,333 on Q2 2020 and the high was 1,342 in Q3 2020.


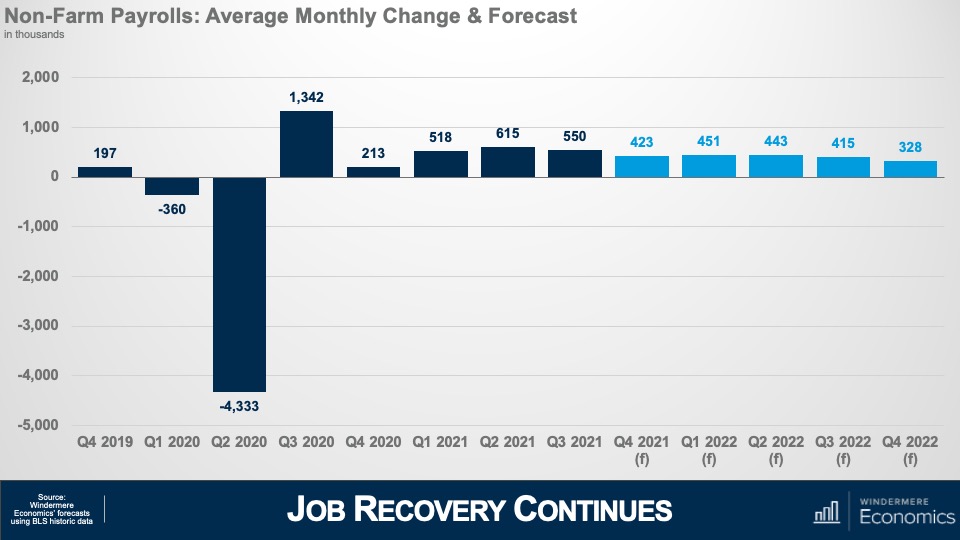
Looking at the employment picture this chart shows my forecast for average monthly growth in jobs during a quarter and to give you some context, over the last decade or so the country has added an average of around 200,000 jobs per month during any one quarter and my forecast is for more robust employment growth as we move through 2022 and, if correct, I expect to see the country return to pre-COVID employment levels in the second half of the year.


A bar graph titled "U.S. Unemployment Rate & Forecast," showing January 2020 to Q4 2022 on the x-axis and percentage figures on the y-axis, from 2% to 16%. The high was close to 15 percent in April 2020 and the low was just over 3 percent in January and February 2020.


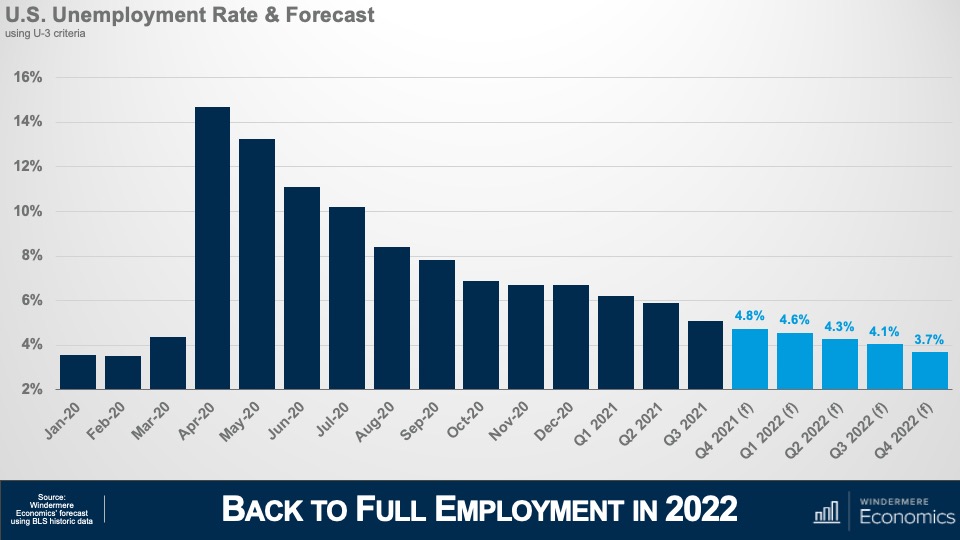
And with jobs continuing to return I’m looking for the unemployment rate to continue trending lower and breaking south of 4% during the final quarter of the year. With the expiration of enhanced unemployment benefits – in concert with wages rising significantly in many face-to-face industries such as leisure and hospitality – prospects for people currently unemployed are looking rather good. That said, there are still millions of unemployed Americans who are not looking for work even with wages rising, the labor force still down by 3 million from its pre-pandemic peak, and this is worrying as businesses continue to have a hard time finding employees which raises the expectation that inflation will remain higher for longer than I would have liked to see.

Measures of Inflation

And that leads nicely into my final economic forecast and that is my outlook for inflation. As we have discussed, supply chain issues and labor shortages have increased prices significantly and this top chart shows annual changes in all consumer prices which I expect to remain around 5% until next spring, before gradually dropping down to below 3% by the end of the year.


A slide titled "Measures of Inflation" with two line graphs. One is titled "Consumer Prices" and shows the percentage changes on the y-axis and the quarters from Q4 2018 to Q4 2022 on the x-axis. It shows an expected drop from Q4 2021 to Q4 2022. The "Core Consumer Prices" graphs showing the same measurements on each axis. It shows an expected increase in core consumer prices in Q1 2022 followed by an expected drop toward Q4 2022.


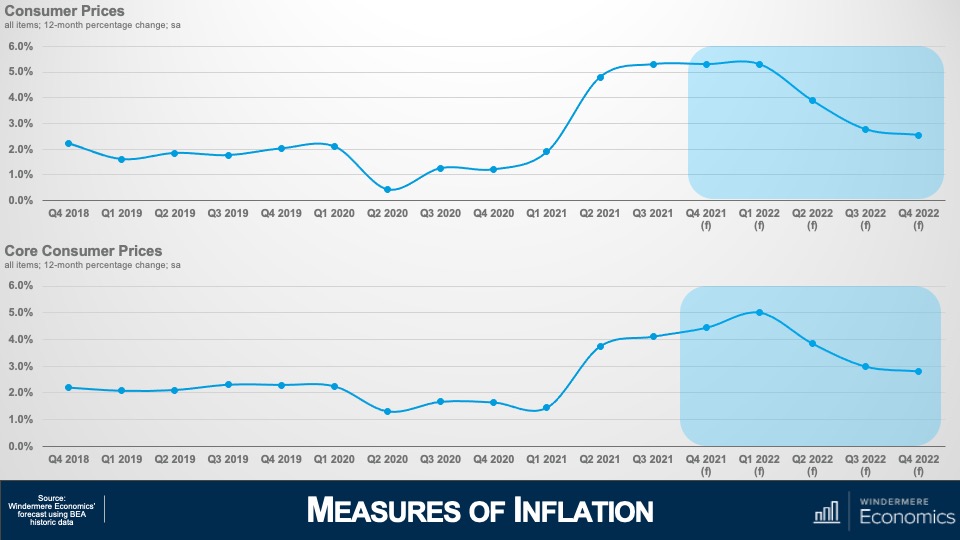
But the core inflation rate – which excludes the volatile food and energy sectors – won’t peak until early next year before it too starts to gradually pull back and, at these levels, the Federal Reserve will undoubtedly have started to raise interest rates to counteract inflationary pressures. This is not pretty, but I absolutely do not believe that we are in some sort of inflationary spiral, or that “stagflation” will raise its ugly head again.

U.S. Housing Market

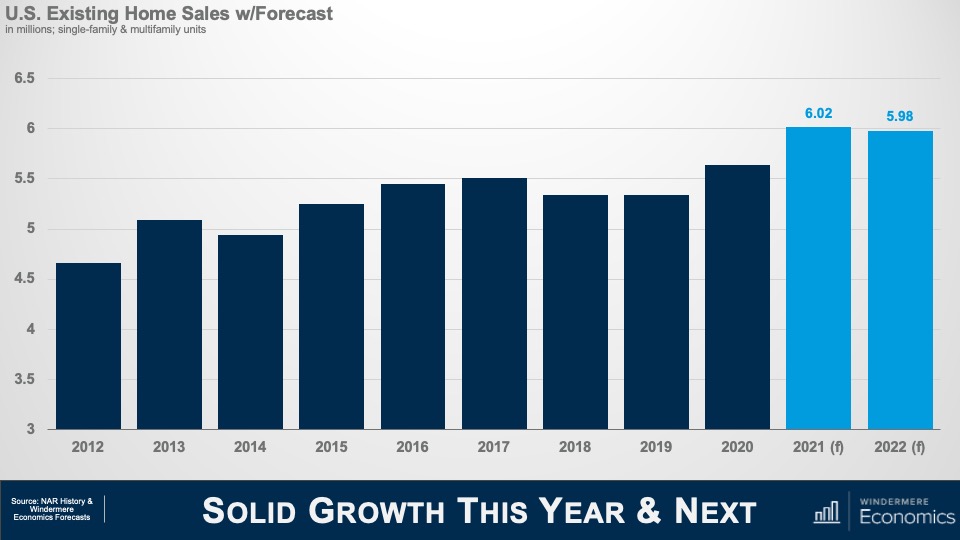
Okay! Now it’s time to turn our attention to the U.S. housing market which was a beacon of hope during the pandemic period and, given the massive spike in demand that started last June, I’m looking for a little more than 6 million existing homes will have changed hands in 2021, but I don’t see this level increasing in 2022 – mainly due to ongoing supply limitations as well as rising affordability issues, and I’m therefore forecasting sales to pull back  – albeit very modestly – next year. That said, the country has never seen more than 6 million home selling in a single year since records were first kept so the number is still very impressive.


A slide titled "Solid Growth This Year & Next" with a bar graph titled "U.S. Existing Home Sales w/ Forecast." It shows the existing home sales in millions every year from 2021 to 2022. 2021 and 2022 have the highest figures on the graph, at 6.02 and 5.98 million respectively.


And with the market as tight as it has been so far this year, it shouldn’t be any surprise to see median sale prices skyrocketing and, even though we have 3 more months of sales data yet to be released, I still anticipate prices will have risen by almost 16 and a half % in 2021- a quite remarkable number. This pace of appreciation has never been seen before. In fact, the closest was back in 2005 – when the housing bubble was inflating rapidly – but even then, prices only rose by 12.2%.


A slide titled " Sales Prices Slow in 2022," with a bar graph titled "U.S. Median Sale Price of Existing Homes & Forecast," which shows the annual percentage change of single-family and multifamily units for the years 2012 through 2022. The highest figure is 16.4 percent in 2021, whereas the lowest in both in 2018 and 2019 at 4.9 percent.


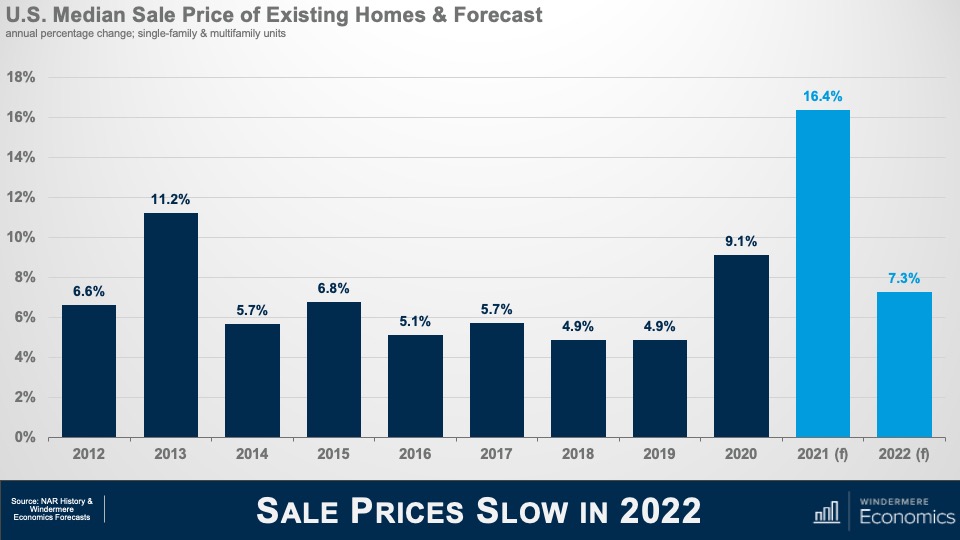
But, as I mentioned in my sales forecast, this pace of growth is unsustainable and I am expecting to see some of the heat to come off the market next year but, a growth rate of 7.3% is certainly nothing to sniff at.

There are three major reasons why we will see the pace of growth slow. I have already mentioned my concerns regarding housing affordability, but mortgage rates and new supply will both influence the slowdown in sales and price growth in the resale arena.


A slide titled "Mortgage Rates Will Remain Favorable" with a bar graph titled "Average 30-Year Mortgage Rate History & Forecast." It shows a predicted increase mortgage rates from Q4 2021 at 3.13 percent to 3.78 percent in Q4 2022.


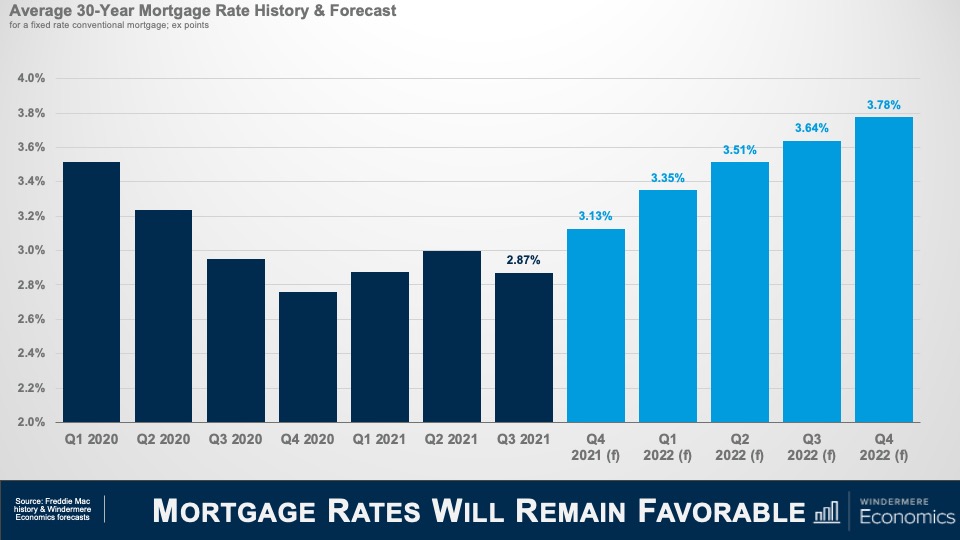
Although I do not prepare a forecast for housing affordability, this is my where I expect to see mortgage rates through the end of next year and I am looking for them to continue “stair-stepping” higher but still ending 2022 below 4% – very low by historic standards given that the long-term average for a conventional 30-year mortgage is somewhere around 7 1/2%.

Obviously, as rates notch higher that starts to compress price growth as it puts a lower ceiling on how much a buyer can afford to pay for a home.


A slide titled "New Home Starts Pick Up," with a bar graph titled "Single-Family Housing Starts w/ Forecast." The graph shows the housing starts in the thousands for the years 2012 through 2022. There is a gradual increase, from 535,000 in 2012 to an expected figure of over 1.2 million in 2022.


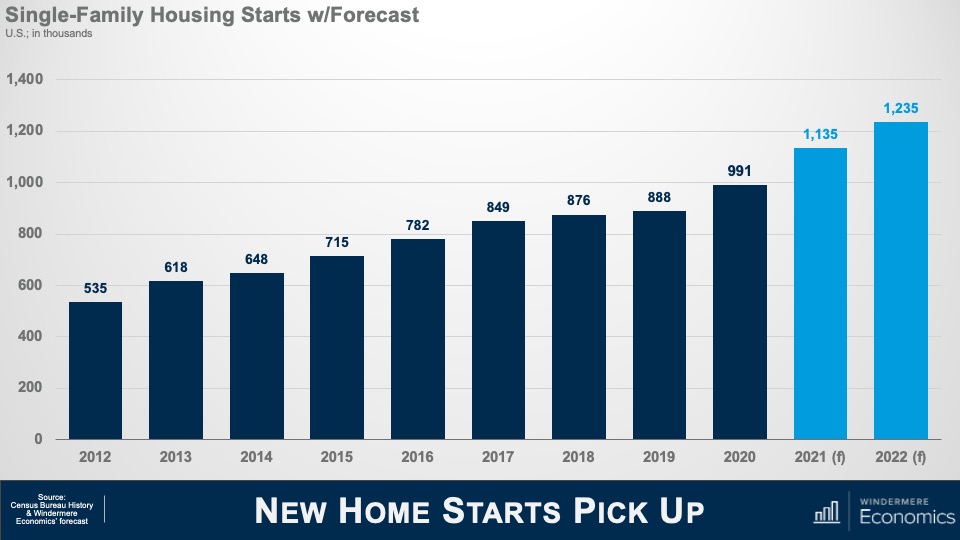
And slowing growth in existing home prices and sales will also be a function of additional supply and this chart shows my forecast for single-family starts this year and next. I expect more than a million homes to start construction in 2022 – continuing the trend that started in mid-2020 – but I am sure that some of you may be asking yourselves that if starts are already robust, how have existing home sales been able to increase so significantly if there has been solid supply coming from homebuilders – and that would be a great question.

And I would answer this by telling you that the way the Census gathers data on start is to count the number of home foundations that have been poured, but vertical construction has not necessarily started. And what we have been seeing is a lot of foundations but not so many homes actually being built – and we know this by looking at the number of homes that are for sale but have yet to be started. So, it’s important to look at a separate number that the Census Bureau also puts out which counts the number of units actually under construction, and that number has been growing significantly over the course of the last 18 months or so.


A slide titled "Growth Picks Up in 2022," with a bar graph titled "U.S. Single Family New Home Sales with Forecast." The graph shows the new home sales in thousands for the years 2012 through 2022. Sales were at a low of 368,000 in 2012, jumped to 835,000 in 2020, and are predicted to peak at 927,000 in 2022.


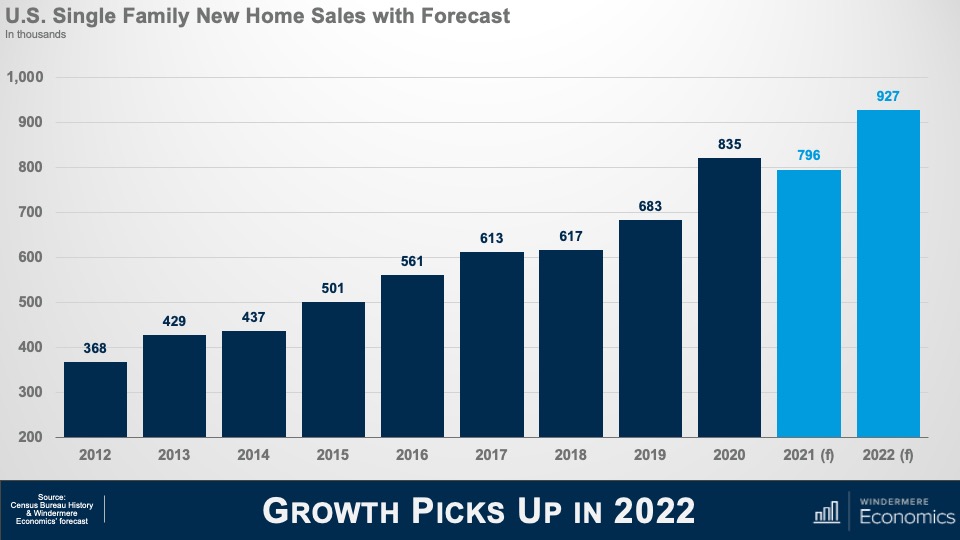
Builders have been hamstrung with rising labor and material costs which will lead new home sales this year to fall below the number seen in 2020; however, I do expect this to pick up significantly next year and my current forecast calls for 927,000 new homes to be sold in 2022.

So, there you have it, my economic and housing market forecast for 2022.

Of course, there are still a number of variables that could lead me to revise this forecast but, as an old economics professor of mine used to tell me, “Gardner, forecast well, but forecast often!”

If everything goes according to my plan, you should expect to see the housing market start to move towards some sort of balance next year, but I am afraid that it will still remain out of equilibrium until at least 2023.

And if you’re wondering, no, I don’t see a housing bubble forming and I’m also not at all concerned about homeowners currently in forbearance, but it would be silly to say that there aren’t any issues in the housing market that concern me because there are and the biggest of which is housing affordability and this will have a significant impact on the millennial generation who are continuing to get older, and they are all – well most – thinking about settling down and, possibly, having children, and I wonder how hard it will be for many of them to be able to afford to buy their first home because most really do want to become homeowners. Will builders figure out how to build to this massive pent-up demand? I guarantee you that whoever can solve this puzzle will do very, very well.

COVID-19 caused an unparalleled shock to the US economy and the rise of the delta variant has certainly impacted the speed of our recovery but, rest assured, this particular forecaster firmly believes that we will recover and that the economy will continue to grow.

Demand for ownership housing remains remarkably buoyant and, in fact, it is quite likely that demand may actually increase with the work from home paradigm that will start to gain momentum next year. It will be fascinating to watch how this impacts not just demand, but where these buyers will ultimately choose to live.

In closing, I very much hope that you have all enjoyed the videos that I have shared this year as much as I have enjoyed making them.

As always if you have any questions or comments about this topic, please do reach out to me but, in the meantime, stay safe out there and I look forward the visiting with you all again next year.

Bye now.

Living November 8, 2021

The Evolution of the Home Office

As the popularity of remote work has reached new heights in recent years, the needs of homeowners are changing. Home offices and workspaces have never been higher on buyers’ priority lists and sellers are finding ways to make their homes appeal to a remote working audience. So, what does this mean for the home office moving forward? How will it continue to evolve? Only time will tell. In the meantime, it’s more important than ever to curate a home office that fits your needs.

The Evolution of the Home Office

Whether you have a proper home office or work at a chair in your kitchen nook, what’s important is that you create a dedicated space for your work. This allows you to focus by limiting distractions that may arise from other areas of the house. It also brings a sense of work-life balance to your home by physically separating the spaces. Even if your space is limited, design your workspace to feel like its own designated spot by facing it away from an open room or pointing your workstation toward a window.

Continued Remote Work

For those who have worked remotely and will continue to do so, you’ve likely gotten a grasp of how your home workspace can best fit your unique needs. Perhaps you decided to ditch the desk chair for a yoga ball or switched out that old desk lamp for a therapy light. But now that remote work has become your long-term reality, it’s time to think about how the space will fit your long-term needs.

Gone are the days of your home workspace being an afterthought. Working from home long-term means that your home office is now one of the most-used spaces in the house, so it’s important to keep it organized. Declutter the space with efficiency and productivity in mind, prioritizing the items that are essential for your job. We work well when we feel well, and an organized space can help reduce anxiety and work-related stress.

As your remote work continues, it may be time to make investments that you were previously on the fence about making. Whether it’s a second monitor, a supportive floor mat under your chair, a new design on your wall for your Zoom background, or a standing desk, now that you’ll be working from home for the foreseeable future, it’s important that your home office provides you with all the tools you’ll need while inspiring you to do your best work. 

Returning to In-Person Work

For those whose days of a fully remote work schedule are coming to an end, your home office needs will evolve, so it’s important that the space reflects those changes.

  • Full-Time: Returning to in-person work full-time means your home office will be vacant for extended periods of the day. Because you won’t be using it nearly as much, you have the freedom to either keep it as is or convert the room into something else. If you’ve dreamt of having a game room, a home gym, a playroom for the kids, or creating your version of a home theater, this is the perfect opportunity to do so.
  • Part-Time / Hybrid / Flex: A hybrid or flex work schedule allows for flexibility with your home office. Paring down your workspace and transferring some equipment to your desk at work will help you declutter. Outfit both workspaces to fit your needs to avoid lugging equipment back and forth. For example, if one location is primarily meant for attending meetings and the other is for working on projects, you can curate each space accordingly.


For more information on how remote work can change your needs as a homeowner, read our blog on The Remote Worker’s Home Buying Process.

BuyingSelling November 8, 2021

A Quick Guide to Understanding Real Estate Designations

What do those letters and acronyms mean at the end of your real estate agent’s name? We’re here to answer that question and explain why it might matter to you. Like other professionals, real estate agents have the ability to specialize in certain areas of the business by earning designations. Those acronyms signify that they have achieved a specific designation through extensive training and education. In simple terms, designations enable agents to increase their skills, proficiency, and knowledge in various real estate sectors. They can also provide agents with access to members-only marketing tools and resources which can be an added benefit to their clients.  

So why should real estate designations matter to you? Depending on what your specific real estate needs are, certain designations might mean more to you than others. For example, if you are in need of a real estate agent who can help you or your loved ones transition to a senior living facility, you may want to work with a Senior Real Estate Specialist® (SRES®), because they are trained to understand the unique needs of seniors and their families in this type of situation.  Or, perhaps you’re selling your LEED-certified home and you want an agent who specializes in marketing these types of properties, then you may want to work with a Certified Green Real Estate Professional (CG-REP).

The National Association of REALTORS® offers the largest number of professional designations, which are designed to provide real estate agents with specialized training in a variety of areas. Here is a list of those designations and how they benefit real estate consumers.

Real Estate Designations

Accredited Staging Professional (ASP): By increasing a home’s appeal to a higher number of buyers, home staging is commonly considered one of the best ways to sell a property more swiftly and for more money. Agents with an ASP designation understand the art of home staging and use special marketing techniques to increase the market value of a home.   

Senior Real Estate Specialist® (SRES®): If you are considering retiring, downsizing or are trying to help an aging loved one transition to an assisted living facility, an SRES® trained REALTOR is qualified to help support clients over the age of fifty with lifestyle transitions and major financial decisions. This includes knowing what to look for if you prefer to age in place, finding the resources to support a move from movers to financial advisors, and more.

NAR Green Designation (GREEN): If you are looking to buy or sell a LEED Certified home, a GREEN REALTOR will have the expertise to help you. They are trained in sustainable and earth-friendly building trends, energy efficiency, and more.

Accredited Buyers Representative® (ABR®): If you are a first time homebuyer you may want to find an ABR® designated agent. They are specially trained to work with buyers through every step of the home-buyer process from mortgage to closing.  

Accredited Land Consultant (ALC): Land experts have expert knowledge and experience in land auctioning, leasing, development, farm management, land investment analysis, and tax deferment. This type of designation is not needed for a general home purchase, but if you are looking at investment, development, or farming properties, an ALC can help.

Certified Commercial Investment Member (CCIM): Purchasing or leasing space for your business is different than finding a home for yourself or investment property. If you need a commercial space, a certified commercial agent can help you locate this type of property and negotiate the intricacies of the contracts.

Certified International Property Specialists (CIPS):  International real estate can differ greatly from domestic transactions. If you are looking to purchase a home abroad, consider working with an agent who has their CIPS and specializes in international real estate. They can provide tools for understanding the international process, access to a global referral network, and additional international resources.

Certified Property Manager® (CPM®): Managing a rental property can be a complicated, time-consuming process. There are specific laws you have to follow, resident screenings, 24 hour maintenance issues, and more. A CPM® is specially trained to manage your residential or commercial property on your behalf.

Certified Real Estate Brokerage Manager (CRB): Managing a real estate business involves much more than overseeing an office with staff, marketing, and other resource needs. CRBs go through certification and extensive training for supervising a real estate brokerage, with essential business development and management requirements.  

Certified Residential Specialist (CRS): The prestigious CRS designation is awarded to experienced REALTORS who have completed advanced professional training and demonstrated outstanding professional achievement in residential real estate. This designation signifies one of the highest levels of success a REALTOR can achieve.

Seller Representative Specialist (SRS): Sometimes referred to as a “listing agent”, there are agents who specialize in working specifically with sellers. These agents have special training in all areas of the home selling process, providing increased professional standards and marketing expertise.

Real Estate Certifications

Military Relocation Professional Certificate (MRP): If you are a military service member or are relocating on behalf of the military, an MRP is specifically trained to address your relocation needs.  They can help you navigate through the financial process because they are aware of the benefits available to service members and can address the unique relocation needs of military clients.

Resort & Second-Home Property Specialist Certification (RSPS): If you have a destination property, consider working with a RSPS certified agent to manage the buying, selling, or management process. They have training specific to managing investment, retirement, resort, and vacation destination properties.

Short Sale & Foreclosure Resource® (SFR®): Short sales are different than typical home sales because they deal directly with financial institutions. SFR® certified agents are experienced at negotiating these types of transactions and are trained to work with finance, tax and legal professionals on behalf of distressed sellers.

Go here for a complete list of designations: Realtor® Designations and Certifications

To connect with an experienced Windermere agent today, click the button below to get started: 

Market News November 5, 2021

Q3 2021 Maui, Hawaii Real Estate Market Update

The following analysis of select Maui real estate markets is provided by Windermere Real Estate Chief Economist Matthew Gardner. We hope that this information may assist you with making better-informed real estate decisions. For further information about the housing market in your area, please don’t hesitate to contact your Windermere Real Estate agent.


Regional Economic Overview

Maui’s employment picture continued to improve in the third quarter, but the pace of the job recovery has slowed. This is likely due to the governor’s announcement discouraging tourists from visiting as COVID-19 cases in the state started to rise again. In total, Maui only grew by 600 jobs in the third quarter, down from 3,200 jobs that were added in the second quarter. At the end of the third quarter, Maui had recovered 12,400 of the 28,900 jobs that were lost due to COVID-19. With employment levels still down 16,500 jobs from the pre-pandemic peak, there is still work to be done. New cases have started to slow, which may lead to stronger job growth in the final quarter of this year, but we will not see a full job recovery until 2022. Maui’s unemployment rate remained elevated in September, with 8.1% of the workforce still without jobs. However, this is considerably better than the 32.9% rate of last April. The state unemployment rate was 6.6% in September, down from 7.7% at the end of the second quarter.

maui, hawaii Home Sales

❱ In the third quarter of 2021, 729 homes sold, a significant increase of 49.7% compared to a year ago. However, as COVID-19 was taking hold at this time last year, this comparison is not informative. Compared to the second quarter of this year, sales fell 17.1%.

❱ Year-over-year, sales rose across the board, with significant growth in South Maui, North Shore, and the West Side. Sales fell in all areas other than the Central area compared to the second quarter of 2021.

❱ The average number of homes for sale in the quarter was down 19.5% compared to the second quarter of 2021. Fewer listings would explain the drop in sales between second and third quarter.

❱ Pending home sales dropped 14.4% compared to the previous quarter, suggesting that closings in the final quarter of the year may not show growth.

A bar graph showing the annual change in home sales for various areas of Maui, Hawaii during the third quarter of 2021.

maui, hawaii Home Prices

A map showing the real estate market percentage changes in various areas of Maui, Hawaii during the third quarter of 2021.

❱ Average home prices on Maui rose 37.8% year over year to $1.419 million. Prices were 2.9% higher than in the second quarter of 2021.

❱ Affordability issues persist and, thanks to favorable financing rates and persistently low levels of inventory, I still think the island will continue to see price appreciation. However, the rate of growth is steadily slowing.

❱ All markets saw sale prices rise, but the massive increase in the North Shore area is a little deceiving. With only ten sales in the entire quarter, the increase of 287% was an anomaly. Compared to the second quarter, prices rose in all markets other than the Central area, but the drop there was minimal (-.4%).

❱ Limited listing inventory and solid demand have continued to push prices higher but, as I suggested in last quarter’s Gardner Report, the pace of price growth is unsustainable. I said then I expected to see a modest slowing in price appreciation, which appears to be the case.

A bar graph showing the annual change in home sale prices for various areas of Maui, Hawaii during the third quarter of 2021.

Days on Market

❱ The average number of days it took to sell a home on Maui dropped six days compared to the third quarter of 2020.

❱ The length of time it took to sell a home dropped year over year in the South Maui, Central, and Up Country market areas, but rose in West Side and the North Shore.

❱ In the third quarter, it took an average of 47 days to sell a home, with transactions occurring the fastest in the Central area and slowest on the West Side.

❱ Compared to the second quarter of 2021, market time dropped in the North Shore and Up Country areas but rose in the balance of the markets contained in this report.

A bar graph showing the average days on market for homes in various areas of Maui, Hawaii during the third quarter of 2021.

Conclusions

A speedometer graph indicating a seller's market in Maui, Hawaii during the third quarter of 2021.

This speedometer reflects the state of the region’s real estate market using housing inventory, price gains, home sales, interest rates, and larger economic factors.

The number of homes for sale on Maui remains low. This has driven prices up and days on market down—both of which favor homes sellers. In addition to this, low mortgage rates are a stimulant to buying, especially if buyers believe rates will rise (which they have started to do). On the other hand, lower sales may lead sellers to list their homes more competitively to attract buyers, and this, naturally, favors home buyers.

Inventory levels are unlikely to rise significantly anytime soon, and while I expect price growth to continue slowing, it remains a seller’s market. The pendulum may start to move more toward buyers, but not yet. As such, I have left the needle in the same spot as in the second quarter of the year.

About Matthew Gardner

Matthew Gardner - Chief Economist for Windermere Real Estate

As Chief Economist for Windermere Real Estate, Matthew Gardner is responsible for analyzing and interpreting economic data and its impact on the real estate market on both a local and national level. Matthew has over 30 years of professional experience both in the U.S. and U.K.

In addition to his day-to-day responsibilities, Matthew sits on the Washington State Governors Council of Economic Advisors; chairs the Board of Trustees at the Washington Center for Real Estate Research at the University of Washington; and is an Advisory Board Member at the Runstad Center for Real Estate Studies at the University of Washington where he also lectures in real estate economics.

Market News November 5, 2021

Q3 2021 Big Island of Hawaii Real Estate Market Update

The following analysis of the Big Island real estate market is provided by Windermere Real Estate Chief Economist Matthew Gardner. We hope that this information may assist you with making better-informed real estate decisions. For further information about the housing market in your area, please don’t hesitate to contact your Windermere Real Estate agent.


Regional Economic Overview

Job recovery on the Big Island remains stalled, with employment levels down 100 jobs from the end of the second quarter, but still up 4,823 versus a year ago. This is likely a function of the governor’s announcement discouraging tourists from visiting as COVID-19 cases in the state started to rise again. At the end of the third quarter, Hawaii County had recovered 6,574 of the more than 17,000 jobs that were lost due to COVID-19. With employment levels still down more than 10,600 from the pre-pandemic peak, there is much work to be done. New COVID-19 cases have started to slow, which may allow for more robust job growth in the final quarter of this year, but we likely will not see a full job recovery until 2022 at the earliest. The unemployment rate on the Big Island remained elevated in September, with 6.3% of the workforce still without jobs, but this is still considerably better than the 22% rate in April of last year. The state unemployment rate was 6.6% in September, down from 7.7% at the end of the second quarter.

big island of hawaii Home Sales

❱ In the third quarter, 1,037 homes were sold on the Big Island. This was an increase of 15.7% from the same quarter a year ago, but 12.8% lower than in the second quarter of this year.

❱ Year-over-year, sales rose in all areas other than North Kohala, but this is a very small area that can see significant swings. Also of note was that six of the remaining eight markets saw sales rise by double digits compared to a year ago. When comparing second and third quarters, sales rose in all areas other than North and South Kohala, North Kona, and Kau.

❱ It’s noteworthy that sales pulled back even as the number of homes rose. The average number of homes on the market in the third quarter was 3.2% higher than in the second quarter, suggesting that some of the heat may be coming off the market.

❱ Pending home sales fell 13.9% compared to the second quarter of the year, which may lead total sales to drop modestly in the final quarter of the year.

A bar graph showing the annual change in home sales for various counties on the Big Island of Hawaii during the third quarter of 2021.

big island of hawaii Home Prices

A map showing the real estate market percentage changes in various counties on the Big Island of Hawaii during the third quarter of 2021.

❱ The average home price on the Island rose a solid 29.1% year over year to $810,810, but prices fell 8.4% compared to the second quarter of 2021.

❱ Versus the second quarter, sale prices were up in Puna, South Hilo, Hamakua, and South Kohala but lower in all the other areas.

❱ Prices rose by double digits in six of the market areas covered by this report but fell in South Kona and Kau.

❱ I mentioned in the second quarter Gardner Report that I was seeing price growth showing some signs of strain, which appears to have been an accurate statement.

A bar graph showing the annual change in home sale prices for various counties on the Big Island of Hawaii during the third quarter of 2021.

Days on Market

❱ The average time it took to sell a home on the Big Island dropped 52 days compared to the third quarter of 2020.

❱ The amount of time it took to sell a home dropped across the board compared to a year ago.

❱ It took an average of 54 days to sell a home, with the fastest sales occurring in South Kona and the slowest in North Hilo.

❱ It took 24 fewer days to sell a home in the third quarter of 2021 than it did in the second, with all markets showing market time dropping.

A bar graph showing the average days on market for home in various counties on the Big Island of Hawaii during the third quarter of 2021.

Conclusions

A speedometer graph indicating a seller's market on the Big Island of Hawaii during the third quarter of 2021.

This speedometer reflects the state of the region’s real estate market using housing inventory, price gains, home sales, interest rates, and larger economic factors.

The number of homes for sale ticked higher, while both sales and prices ticked lower—all of which favor home buyers. That said, market time dropped, and interest rates remain very low, which favors home sellers. If inventory levels continue to trend higher, this may further impact prices and make the market more competitive for sellers. As such, I have moved the needle a little more toward buyers but overall, it remains a seller’s market.

About Matthew Gardner

Matthew Gardner - Chief Economist for Windermere Real Estate

As Chief Economist for Windermere Real Estate, Matthew Gardner is responsible for analyzing and interpreting economic data and its impact on the real estate market on both a local and national level. Matthew has over 30 years of professional experience both in the U.S. and U.K.

In addition to his day-to-day responsibilities, Matthew sits on the Washington State Governors Council of Economic Advisors; chairs the Board of Trustees at the Washington Center for Real Estate Research at the University of Washington; and is an Advisory Board Member at the Runstad Center for Real Estate Studies at the University of Washington where he also lectures in real estate economics.

Market News November 4, 2021

Q3 2021 Nevada Real Estate Market Update

The following analysis of the greater Las Vegas real estate market is provided by Windermere Real Estate Chief Economist Matthew Gardner. We hope that this information may assist you with making better-informed real estate decisions. For further information about the housing market in your area, please don’t hesitate to contact your Windermere Real Estate agent.


Regional Economic Overview

The Las Vegas economy continues to recover following the major loss of jobs that resulted from the pandemic. Over the past three months, the area returned a respectable 23,300 jobs of which almost half were in the hard-hit Leisure and Hospitality industry. Although jobs are returning at a fairly decent pace, it is worth noting that the current employment level is still down 89,000 jobs from the peak prior to COVID-19. The unemployment level in Las Vegas has dropped to 8.2%, significantly lower than the pandemic peak of 33.3%, and I am optimistic the area will return to full employment by the end of next summer.

nevada Home Sales

❱ A total of 10,690 homes sold in the third quarter, which was an increase of 12.3% compared to the same period a year ago. Sales were 4.9% lower than during the second quarter.

❱ Pending sales, which are an indicator of future closings, fell 4.5% compared to the second quarter of the year.

❱ Sales rose in every neighborhood other than Centennial, but the drop there was minor. Transactions rose the most in the Whitney and Southeast Las Vegas market areas, but six additional neighborhoods also experienced double-digit growth.

❱ The drop in pending sales may be a function of rising inventory levels which are giving buyers more choice and allowing them to take more time deciding which home they want to buy.

A bar graph showing the annual change in home sales in various sections of the Greater Las Vegas, Nevada area during the third quarter of 2021.

nevada Home Prices

A chart showing the sub-market areas and their corresponding zip codes in the greater Las Vegas area.

❱ Home prices rose 20.7% from a year ago to an average of $438,994. Prices were also 2.3% higher than in the second quarter of this year. The rise of prices over the past few years is certainly impacting affordability, which is the lowest it has been since 2018.

❱ Mortgage rates remain competitive, which is causing prices to continue trending higher even as affordability constraints emerge.

❱ Prices rose by double digits in every sub-market other than Spring Valley compared to the same quarter last year. Compared to the second quarter of this year, prices were also higher in every area other than Anthem and Henderson.

❱ Although the economy is improving, affordability will act as a headwind to significant price growth moving forward. When mortgage rates start to tick higher, this too will have a slowing effect on the pace of appreciation.

A bar graph showing the annual change in home sale prices in various sections of the Greater Las Vegas, Nevada area during the third quarter of 2021.

Days on Market

❱ The average time it took to sell a home in the region fell 24 days compared to the third quarter of 2020.

❱ It took an average of 18 days to sell a home in the third quarter, which was 4 fewer days than in the second quarter of 2021.

❱ Days on market dropped across the board compared to a year ago, and all areas other than Anthem and Queensridge saw market time fall compared to the second quarter of this year.

❱ The greatest drop in market time was in the Aliante market, where the length of time it took to sell a home fell 43 days compared to a year ago.

A bar graph showing the average days on market for homes in various sections of the Greater Las Vegas, Nevada area during the third quarter of 2021.

Conclusions

A speedometer graph indicating a seller's market in the Greater Las Vegas, Nevada area during the third quarter of 2021.

This speedometer reflects the state of the region’s real estate market using housing inventory, price gains, home sales, interest rates, and larger economic factors.

Jobs in Las Vegas continue to recover, and this should be a stimulant to the housing market. However, higher inventory levels combined with slower sales tells me that we need to look at the impact of rising home prices. Listing prices shot up earlier this year but levelled off and then dropped during the summer. This suggests that sellers realized there is a limit to what their homes are really worth.

As a result, the market may have lost some momentum, but it’s nothing more than a move back to a more realistic pace of home-price appreciation. All things considered, with rising inventory levels and slower price growth, I am moving the needle a little toward buyers. However, it remains a seller’s market.

About Matthew Gardner

Matthew Gardner - Chief Economist for Windermere Real Estate

As Chief Economist for Windermere Real Estate, Matthew Gardner is responsible for analyzing and interpreting economic data and its impact on the real estate market on both a local and national level. Matthew has over 30 years of professional experience both in the U.S. and U.K.

In addition to his day-to-day responsibilities, Matthew sits on the Washington State Governors Council of Economic Advisors; chairs the Board of Trustees at the Washington Center for Real Estate Research at the University of Washington; and is an Advisory Board Member at the Runstad Center for Real Estate Studies at the University of Washington where he also lectures in real estate economics.

Market News November 4, 2021

Q3 2021 Northern California Real Estate Market Update

The following analysis of the Northern California real estate market is provided by Windermere Real Estate Chief Economist Matthew Gardner. We hope that this information may assist you with making better-informed real estate decisions. For further information about the housing market in your area, please don’t hesitate to contact your Windermere Real Estate agent.


Regional Economic Overview

The job recovery in Northern California appears to have stalled out, which is likely because of rising COVID-19 cases. That said, total employment has grown by 144,100 jobs compared to a year ago, and 292,500 of the jobs that were lost during the height of the pandemic have now been recovered. Even with slower growth in employment, the region’s unemployment rate was 5.9% in August (the most recent data available). This is lower than in June and July, but still up from the May level of 5.5%. By county, the lowest jobless rate was in Santa Clara County (4.8%), and the highest rate was in Solano County, where 7.3% of the workforce remains unemployed. There tends to be a lag between decreases in COVID-19 infection rates and potential increases in employment. Given that new cases started to slow in late August—coupled with the expiration of enhanced unemployment benefits—I am optimistic that job recovery will pick back up as we move into the winter months.

northern california Home Sales

❱ In the third quarter of 2021, 16,579 homes sold, a modest increase of 1.6% year over year, but down .2% from the second quarter of 2021. I’m not surprised to see sales rising only negligibly when compared to last year’s pandemic-induced surge of demand, but I am a little concerned that they didn’t increase between second and third quarter.

❱ Year-over-year, sales rose in Santa Clara and Alameda counties, but pulled back in the rest of the region. Compared to the second quarter, sales rose in Placer and Solano counties but were lower everywhere else.

❱ Listing activity rose more than 5.1% relative to the second quarter of this year, which made the contraction in sales all the more surprising.

❱ Pending home sales were also modestly lower, suggesting that the market may not see significant improvement in sales this winter.

A bar graph showing the annual change in home sales for various counties in Northern California during the third quarter of 2021.

northern california Home Prices

A map showing the real estate market percentage changes in various counties in Northern California during the third quarter of 2021.

❱ The average home price in the Northern California counties contained in this report rose 20.7% year over year to $1.194 million.

❱ The most affordable counties relative to average sale prices continue to be Shasta and Solano. Santa Clara held its position as the most expensive market.

❱ Average prices in all counties rose by double digits compared to a year ago, but fell in Alameda, Contra Costa, Placer, and San Luis Obispo counties compared to the second quarter of this year.

❱ In terms of price growth, the regional housing market continues to cool and greater inventory levels will add to this slowing. Affordability is also a significant limiter when it comes to rising prices.

A bar graph showing the annual change in home sale prices for various counties in Northern California during the third quarter of 2021.

Days on Market

❱ The average time it took to sell a home in the Northern California counties in this report dropped 16 days compared to the third quarter of 2020.

❱ The amount of time it took to sell a home dropped in every county compared to last year. Market time was also lower in all counties other than Santa Clara (+1 day) and Shasta (+4 days) compared to the second quarter of this year.

❱ In the third quarter, it took an average of 29 days to sell a home, which was 1 day longer than it took during the prior quarter.

❱ The greatest drop in market time was in San Luis Obispo County, where it took 29 fewer days to sell a home than in the third quarter of 2020.

A bar graph showing the average days on market for homes in various counties in Northern California during the third quarter of 2021.

Conclusions

A speedometer graph indicating a seller's market in Northern California during the third quarter of 2021.

This speedometer reflects the state of the region’s real estate market using housing inventory, price gains, home sales, interest rates, and larger economic factors.

Inventory levels are rising, sales are slowing, and prices are pulling back. All of these factors, combined with low mortgage rates, should favor home buyers, but it’s a little premature to suggest the market is shifting in their favor. If COVID rates continue to drop, it will be interesting to see if more buyers resume their search for a new home. Given the factors above, I have moved the needle a little more towards buyers. That said, it remains a seller’s market.

About Matthew Gardner

Matthew Gardner - Chief Economist for Windermere Real Estate

As Chief Economist for Windermere Real Estate, Matthew Gardner is responsible for analyzing and interpreting economic data and its impact on the real estate market on both a local and national level. Matthew has over 30 years of professional experience both in the U.S. and U.K.

In addition to his day-to-day responsibilities, Matthew sits on the Washington State Governors Council of Economic Advisors; chairs the Board of Trustees at the Washington Center for Real Estate Research at the University of Washington; and is an Advisory Board Member at the Runstad Center for Real Estate Studies at the University of Washington where he also lectures in real estate economics.