
 Facebook
 X
X
 Pinterest
 Copy Link

The following analysis of the Northern California real estate market is provided by Windermere Real Estate Chief Economist Matthew Gardner. We hope that this information may assist you with making better-informed real estate decisions. For further information about the housing market in your area, please don’t hesitate to contact your Windermere Real Estate agent.
Regional Economic Overview
The job recovery in Northern California appears to have stalled out, which is likely because of rising COVID-19 cases. That said, total employment has grown by 144,100 jobs compared to a year ago, and 292,500 of the jobs that were lost during the height of the pandemic have now been recovered. Even with slower growth in employment, the region’s unemployment rate was 5.9% in August (the most recent data available). This is lower than in June and July, but still up from the May level of 5.5%. By county, the lowest jobless rate was in Santa Clara County (4.8%), and the highest rate was in Solano County, where 7.3% of the workforce remains unemployed. There tends to be a lag between decreases in COVID-19 infection rates and potential increases in employment. Given that new cases started to slow in late August—coupled with the expiration of enhanced unemployment benefits—I am optimistic that job recovery will pick back up as we move into the winter months.
northern california Home Sales
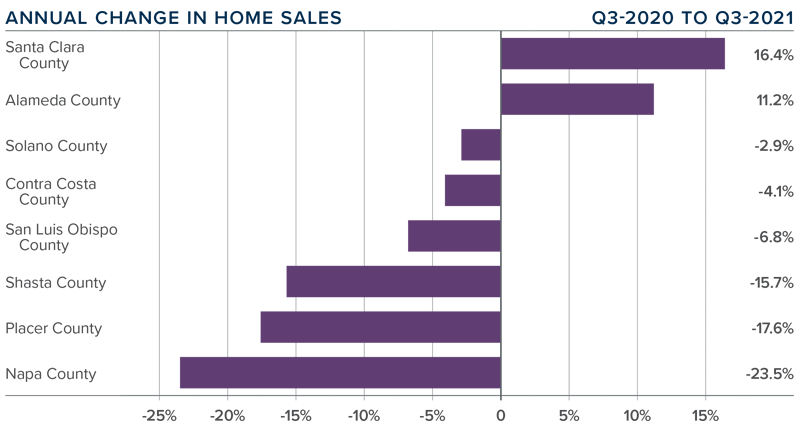
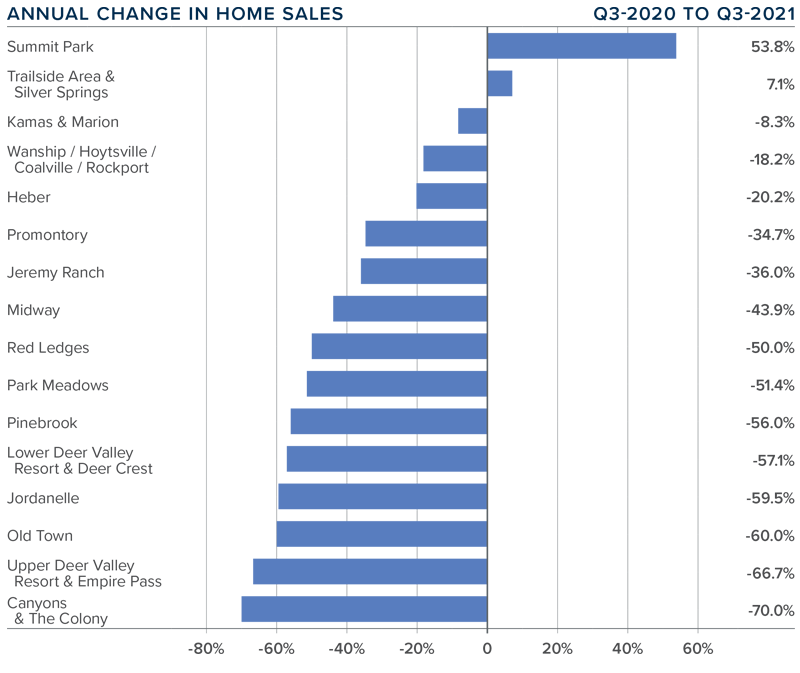
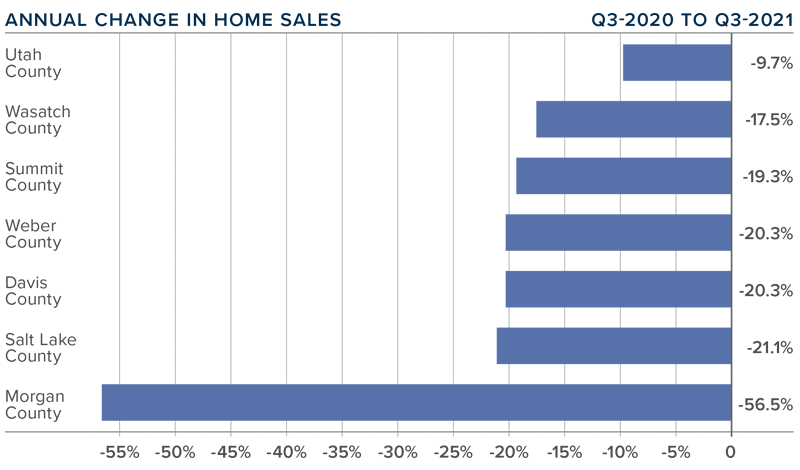
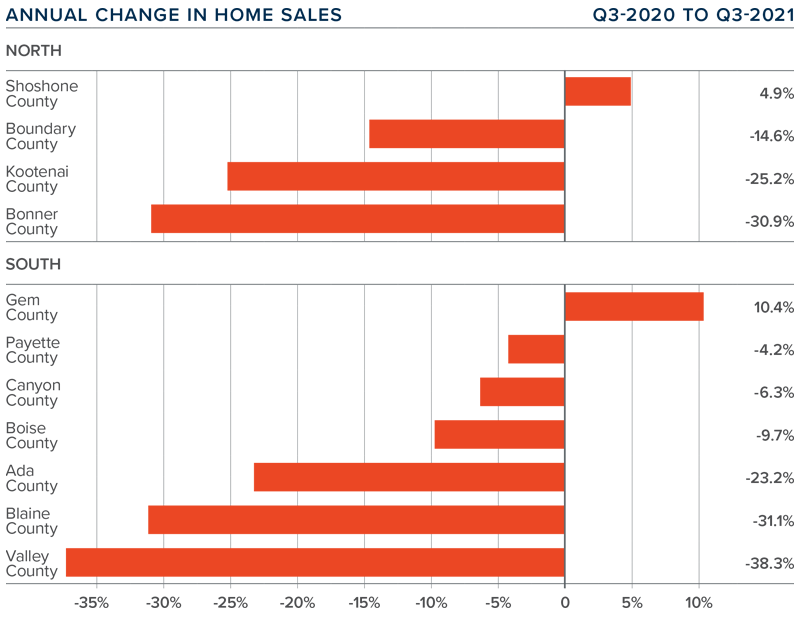
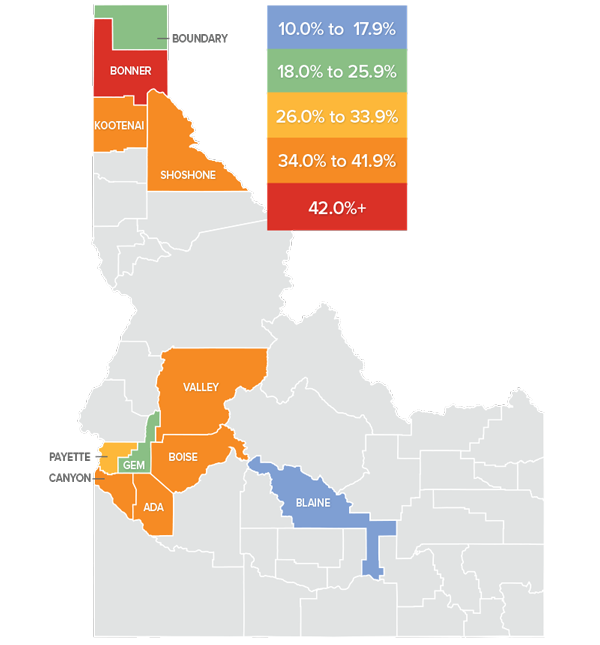
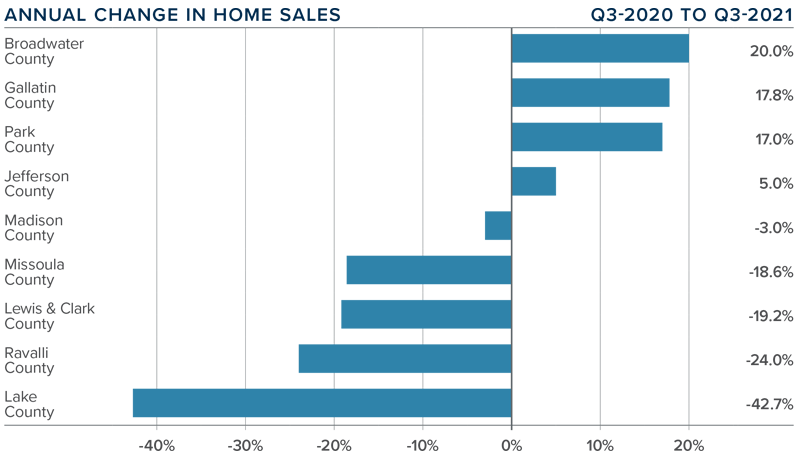
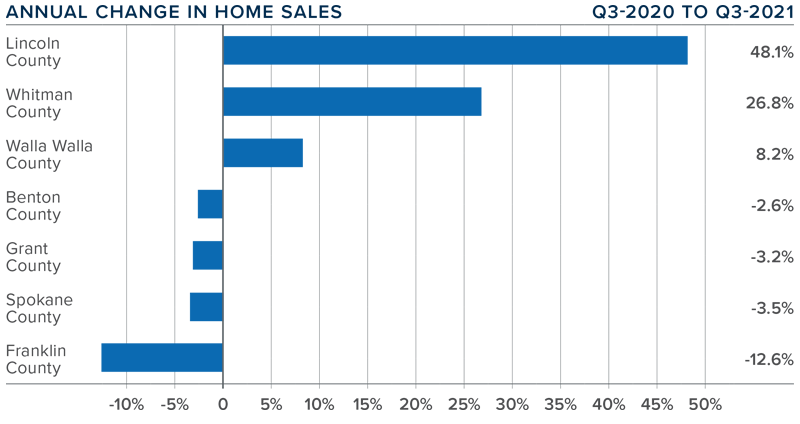
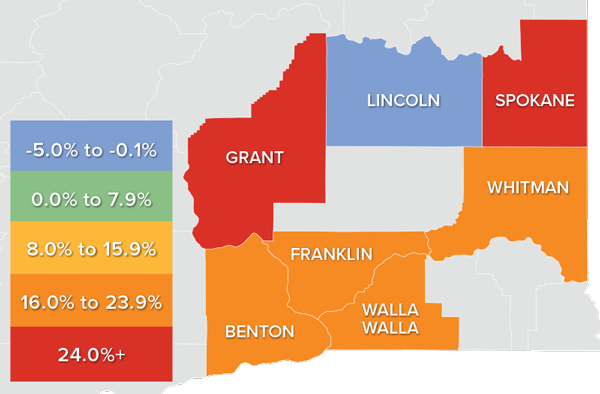
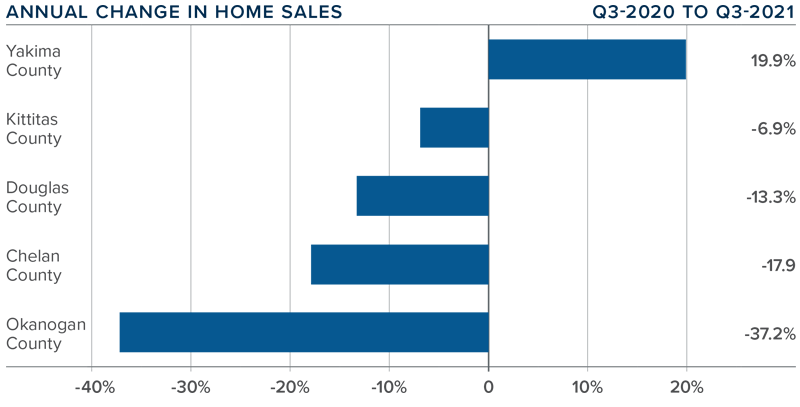
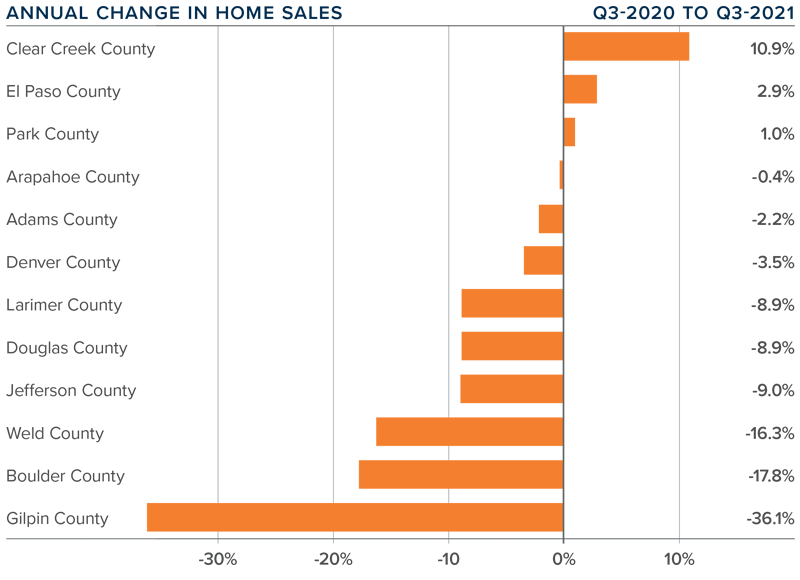
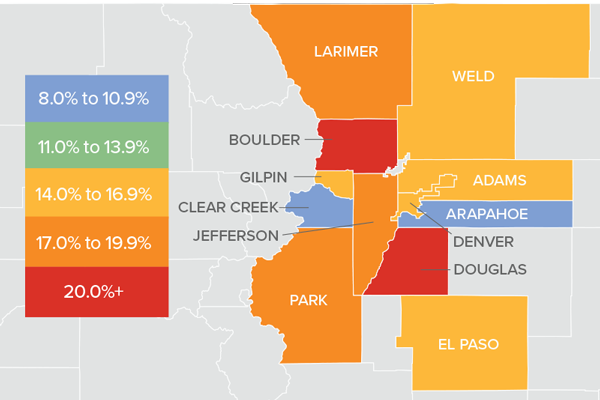
❱ In the third quarter of 2021, 16,579 homes sold, a modest increase of 1.6% year over year, but down .2% from the second quarter of 2021. I’m not surprised to see sales rising only negligibly when compared to last year’s pandemic-induced surge of demand, but I am a little concerned that they didn’t increase between second and third quarter.
❱ Year-over-year, sales rose in Santa Clara and Alameda counties, but pulled back in the rest of the region. Compared to the second quarter, sales rose in Placer and Solano counties but were lower everywhere else.
❱ Listing activity rose more than 5.1% relative to the second quarter of this year, which made the contraction in sales all the more surprising.
❱ Pending home sales were also modestly lower, suggesting that the market may not see significant improvement in sales this winter.
northern california Home Prices
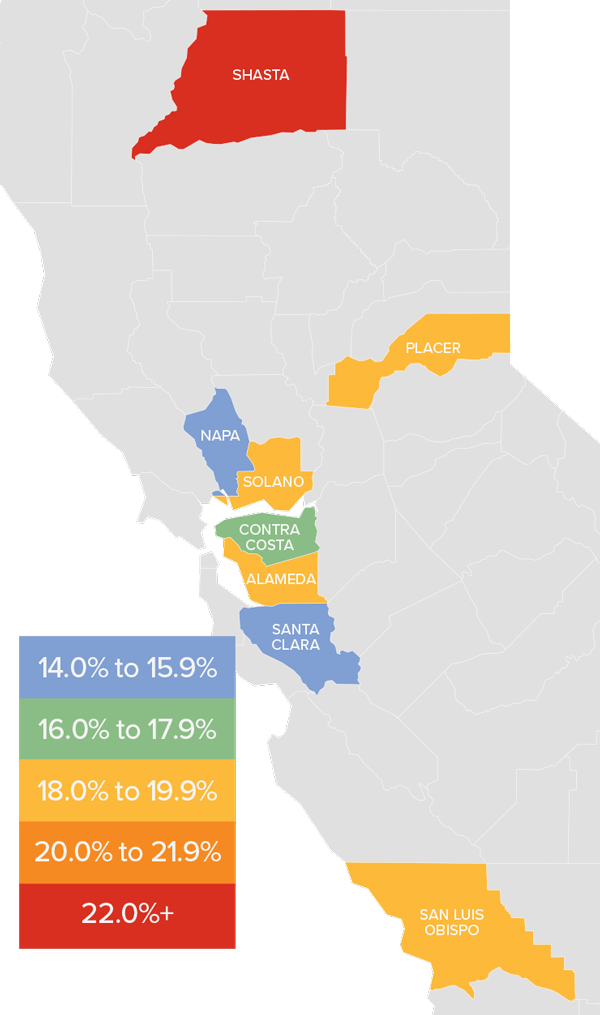
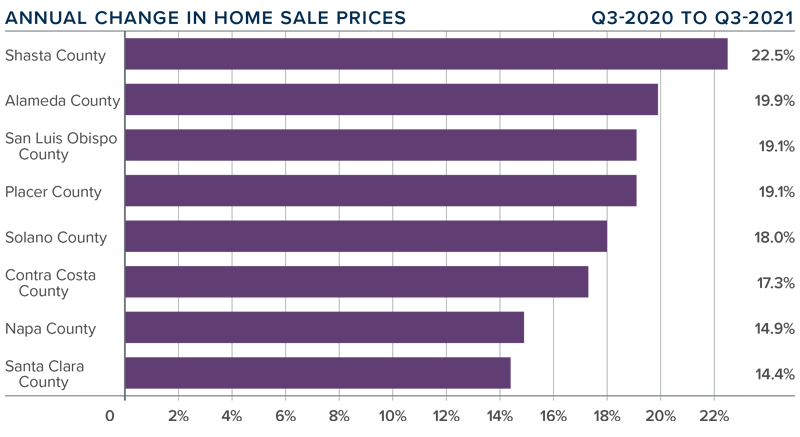
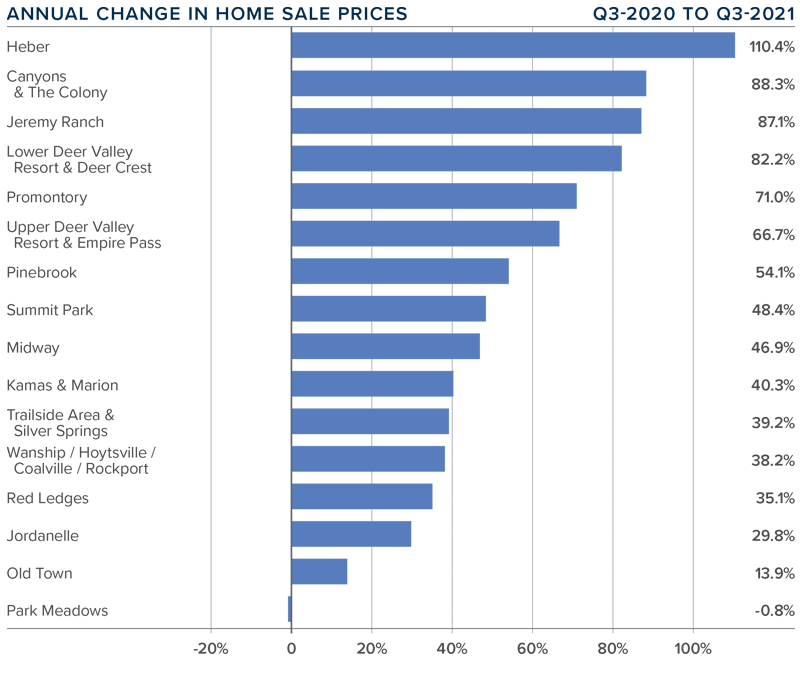
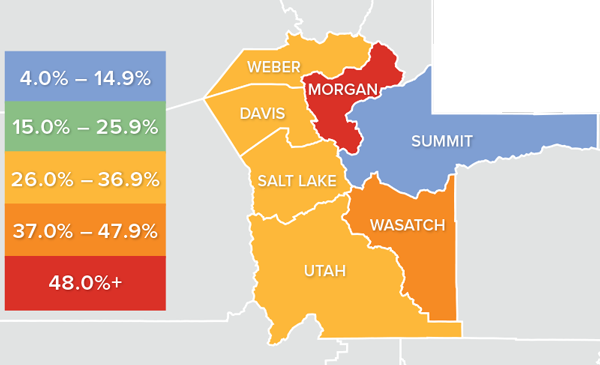
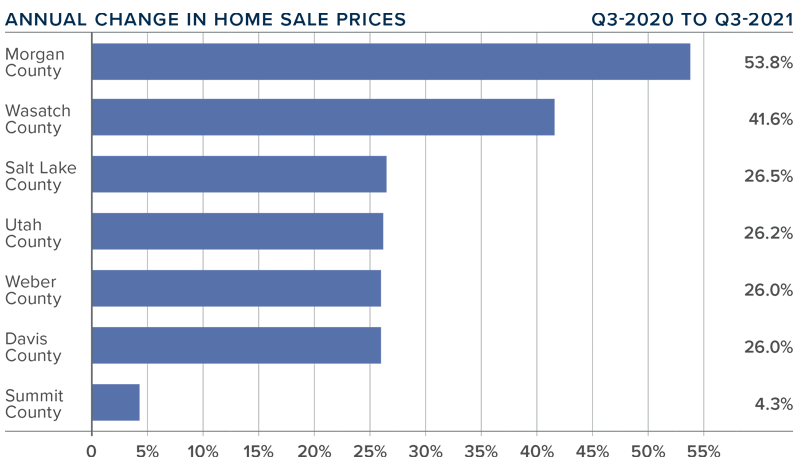
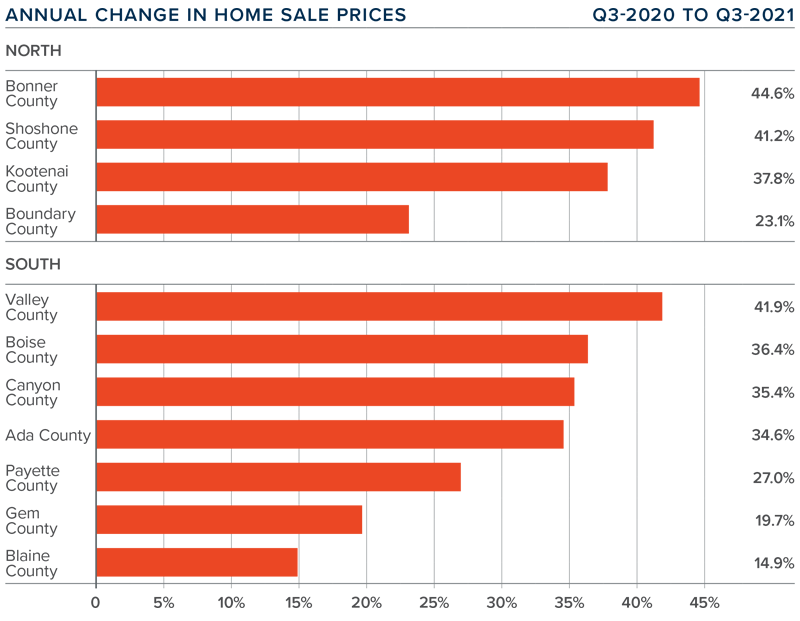
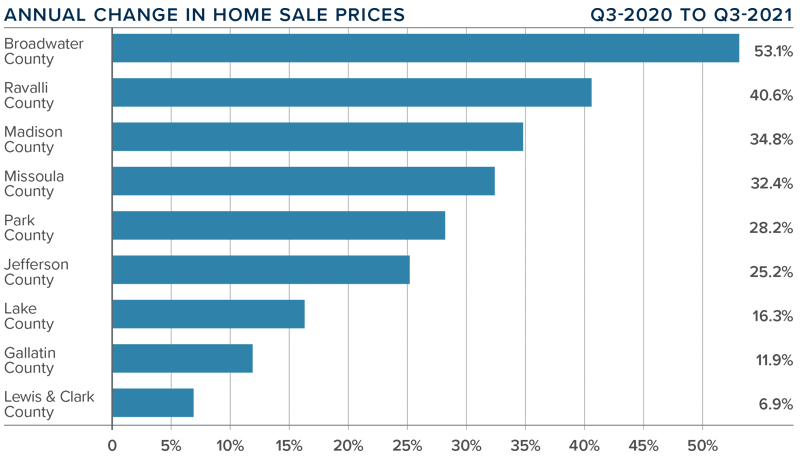
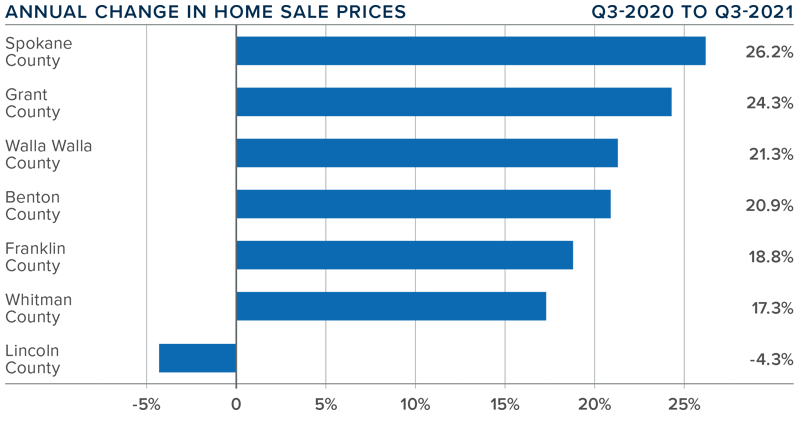
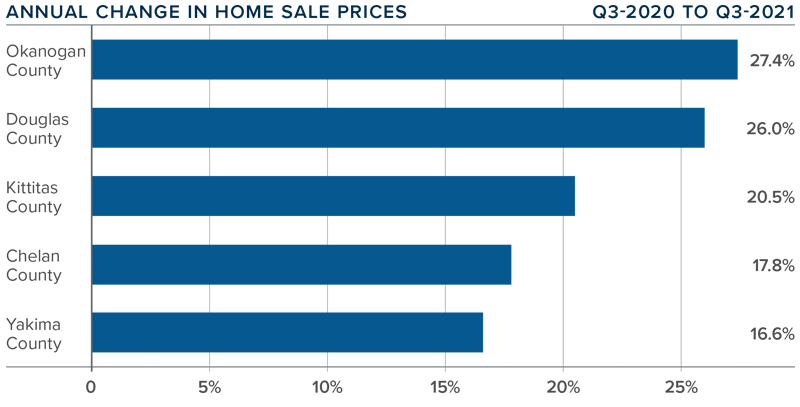
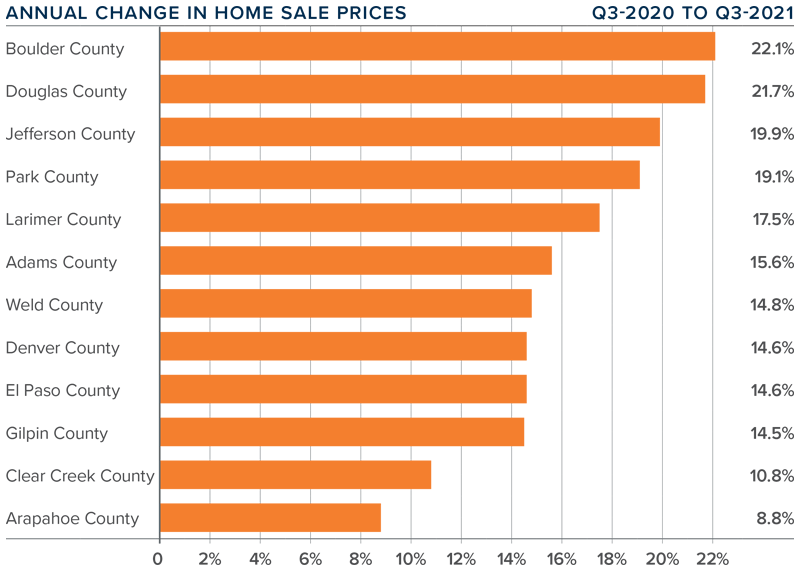
❱ The average home price in the Northern California counties contained in this report rose 20.7% year over year to $1.194 million.
❱ The most affordable counties relative to average sale prices continue to be Shasta and Solano. Santa Clara held its position as the most expensive market.
❱ Average prices in all counties rose by double digits compared to a year ago, but fell in Alameda, Contra Costa, Placer, and San Luis Obispo counties compared to the second quarter of this year.
❱ In terms of price growth, the regional housing market continues to cool and greater inventory levels will add to this slowing. Affordability is also a significant limiter when it comes to rising prices.
Days on Market
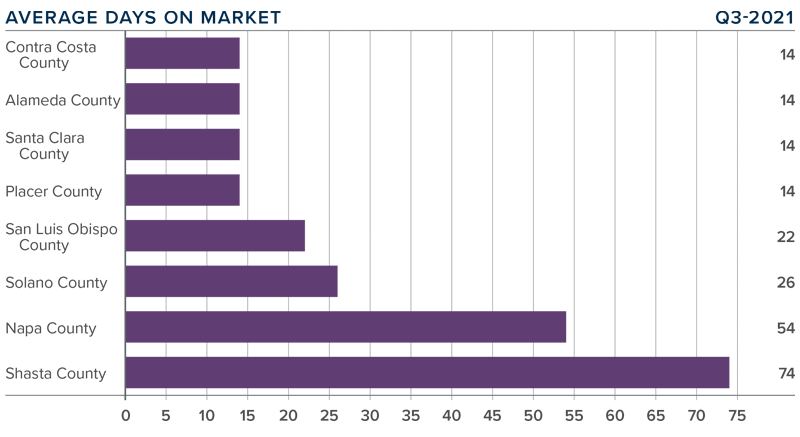
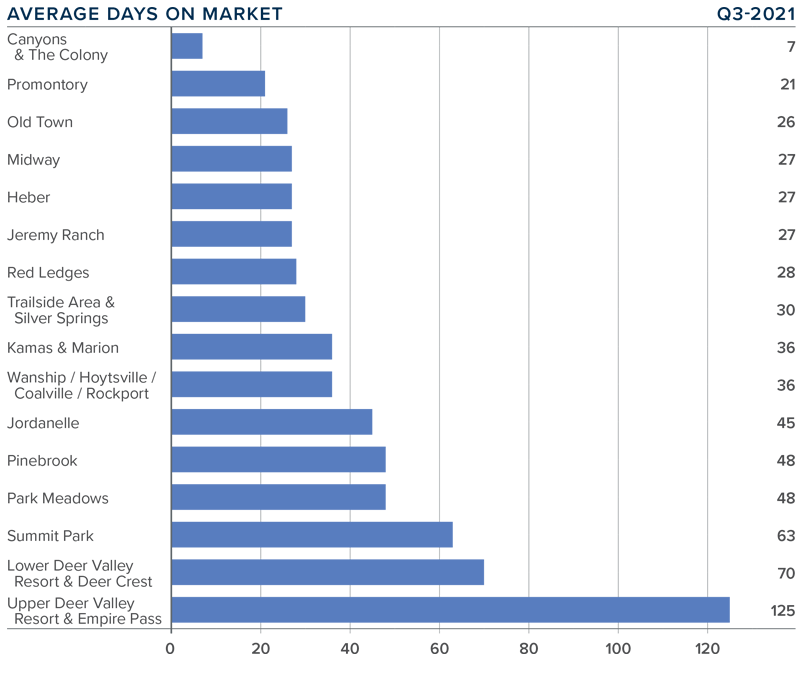
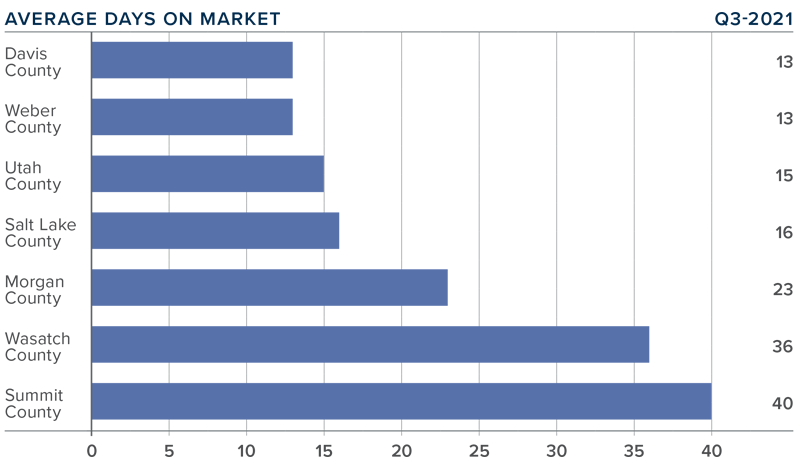
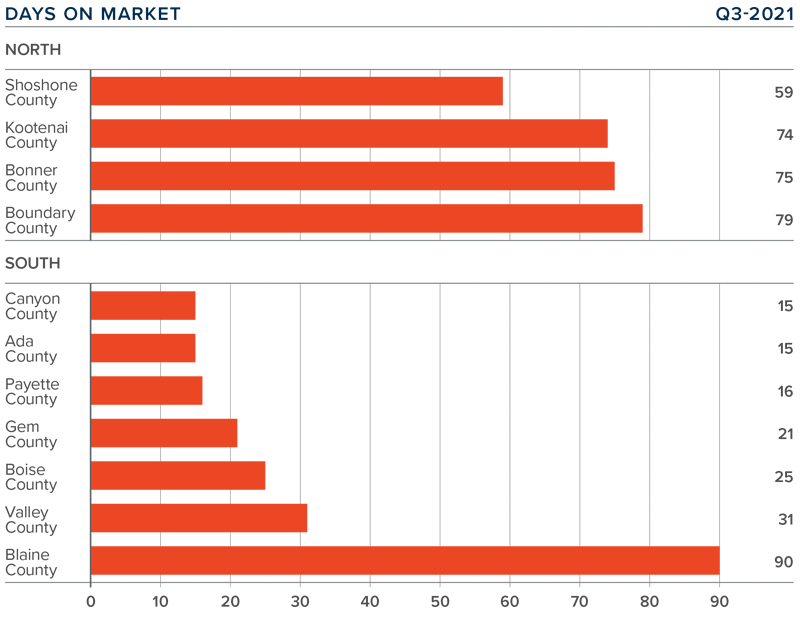
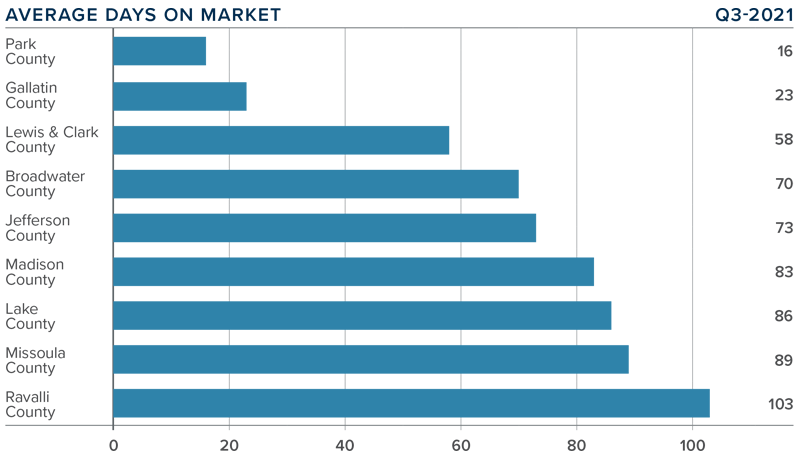
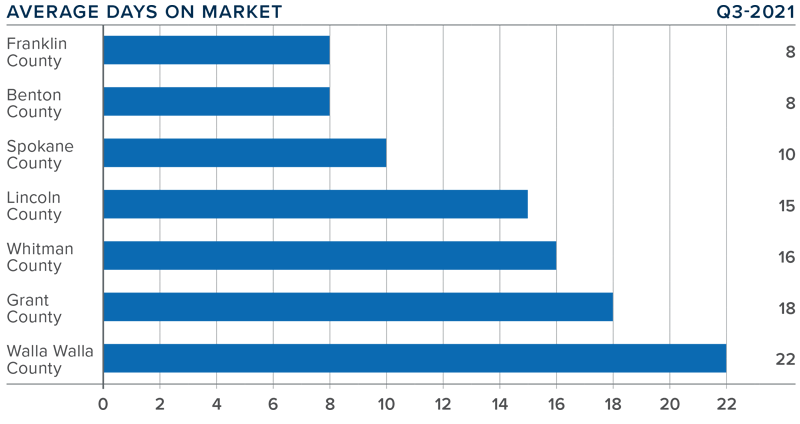
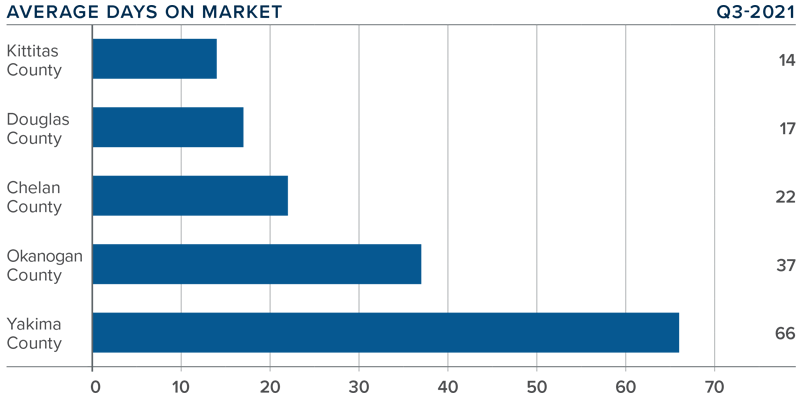
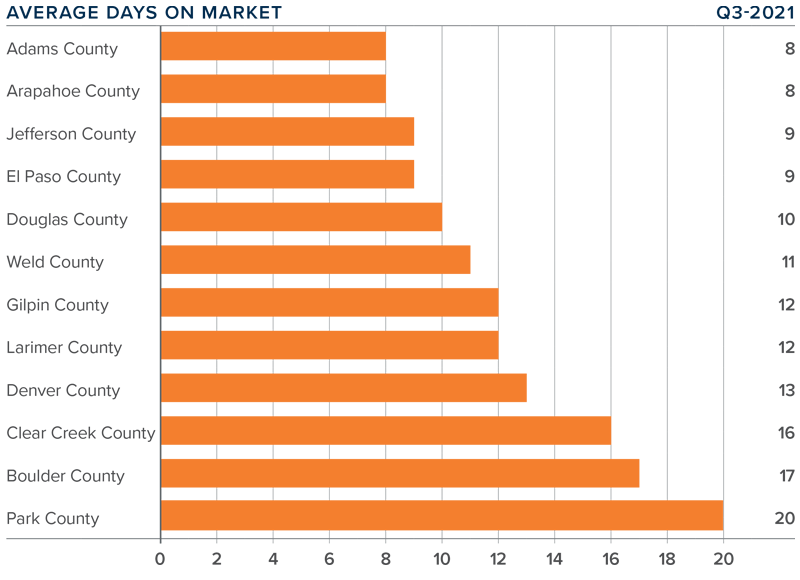
❱ The average time it took to sell a home in the Northern California counties in this report dropped 16 days compared to the third quarter of 2020.
❱ The amount of time it took to sell a home dropped in every county compared to last year. Market time was also lower in all counties other than Santa Clara (+1 day) and Shasta (+4 days) compared to the second quarter of this year.
❱ In the third quarter, it took an average of 29 days to sell a home, which was 1 day longer than it took during the prior quarter.
❱ The greatest drop in market time was in San Luis Obispo County, where it took 29 fewer days to sell a home than in the third quarter of 2020.
Conclusions

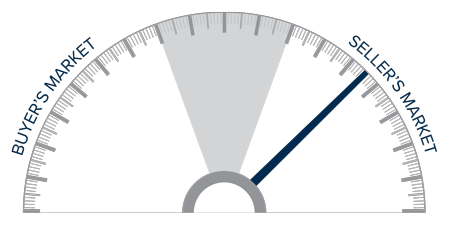
This speedometer reflects the state of the region’s real estate market using housing inventory, price gains, home sales, interest rates, and larger economic factors.
Inventory levels are rising, sales are slowing, and prices are pulling back. All of these factors, combined with low mortgage rates, should favor home buyers, but it’s a little premature to suggest the market is shifting in their favor. If COVID rates continue to drop, it will be interesting to see if more buyers resume their search for a new home. Given the factors above, I have moved the needle a little more towards buyers. That said, it remains a seller’s market.
About Matthew Gardner

As Chief Economist for Windermere Real Estate, Matthew Gardner is responsible for analyzing and interpreting economic data and its impact on the real estate market on both a local and national level. Matthew has over 30 years of professional experience both in the U.S. and U.K.
In addition to his day-to-day responsibilities, Matthew sits on the Washington State Governors Council of Economic Advisors; chairs the Board of Trustees at the Washington Center for Real Estate Research at the University of Washington; and is an Advisory Board Member at the Runstad Center for Real Estate Studies at the University of Washington where he also lectures in real estate economics.


")


