
 Facebook
 X
X
 Pinterest
 Copy Link

The following analysis of the Central Washington real estate market is provided by Windermere Real Estate Chief Economist Matthew Gardner. We hope that this information may assist you with making better-informed real estate decisions. For further information about the housing market in your area, please don’t hesitate to contact your Windermere Real Estate agent.
Regional Economic Overview
Central Washington has recovered all the jobs lost to COVID-19 and continues to expand its employment base. Across the five counties that make up this report, total employment rose to 233,699 in August. The number of jobs is now more than 15,000 positions higher than the pre-pandemic peak of just over 218,000. With more jobs returning, the unemployment rate has dropped to 5.6%—a level last seen in the summer of 2018. The lowest unemployment rate was in Chelan County at 4.2%. The highest rate was in Yakima County, where 5.6% of the labor force was unemployed.
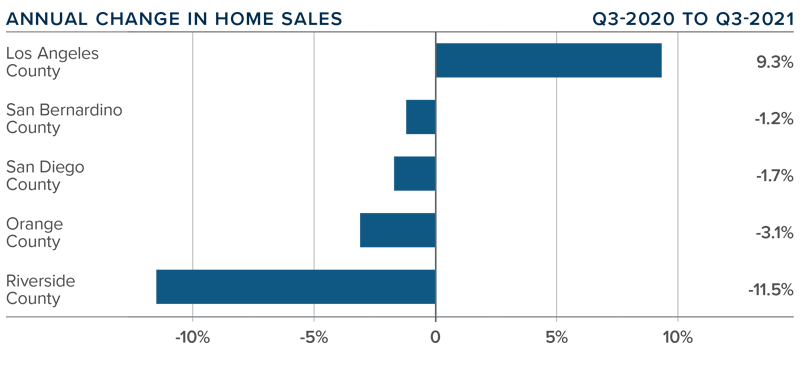
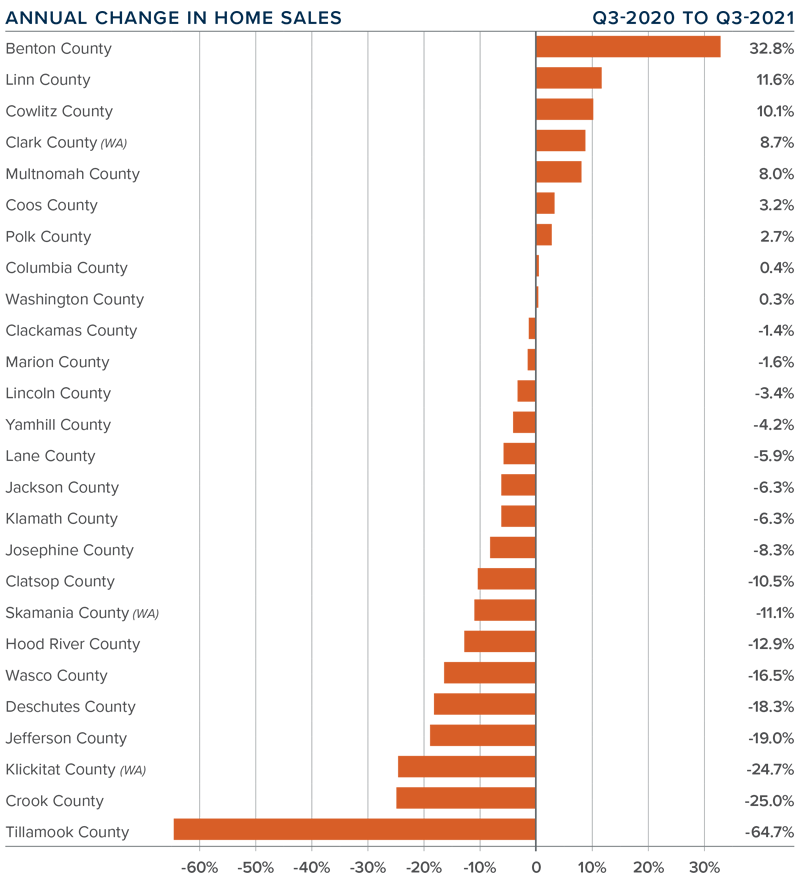
central washington Home Sales
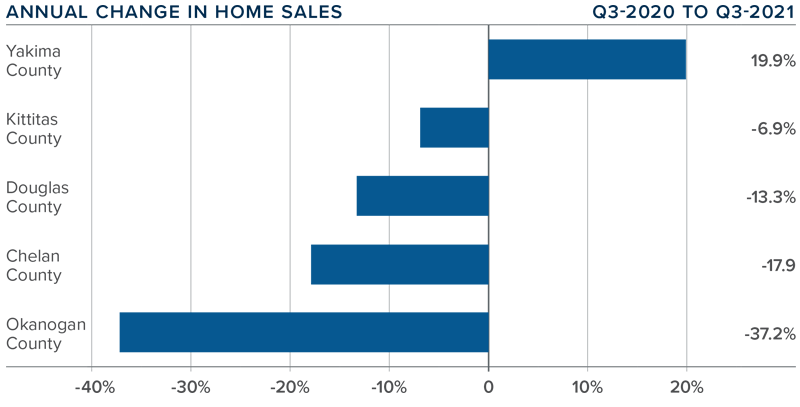
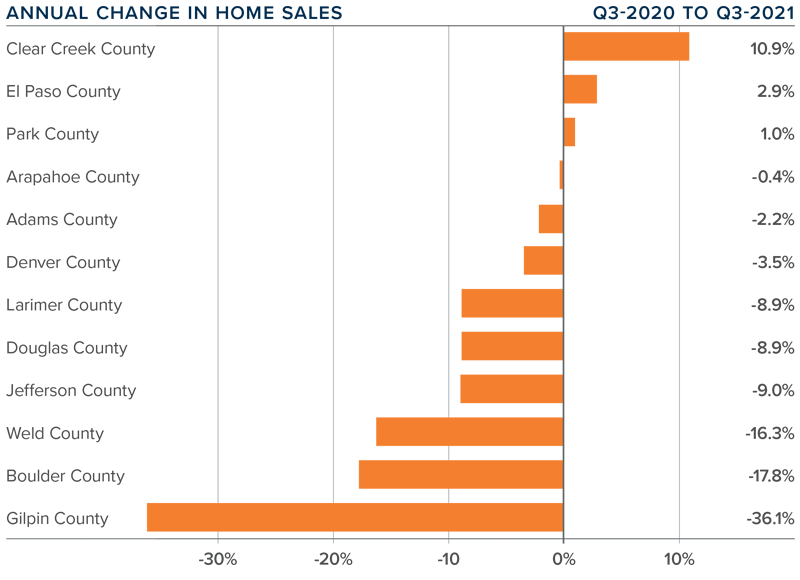
❱ Year-over-year, home sales in Central Washington fell 5.2%, but this is almost irrelevant given that a year ago the country was experiencing a massive housing rebound following the outbreak of COVID-19. More useful is that sales rose 10.9% compared to the second quarter of 2021, with a total of 1,634 homes sold.
❱ Pending sales were .8% lower than in the second quarter, suggesting that closings in the final quarter of the year may not show much improvement.
❱ Compared to a year ago, sales rose in Yakima County but fell in all other markets covered by this report. Relative to the second quarter of this year, sales rose in every county other than Okanogan, with Yakima County again showing a substantial increase (+22.3%).
❱ Inventory levels were up 3.4% compared to a year ago and were 32.7% higher than in the second quarter of this year. Additional choice in the market is a good thing for buyers, which is likely why sales rose significantly in the quarter.
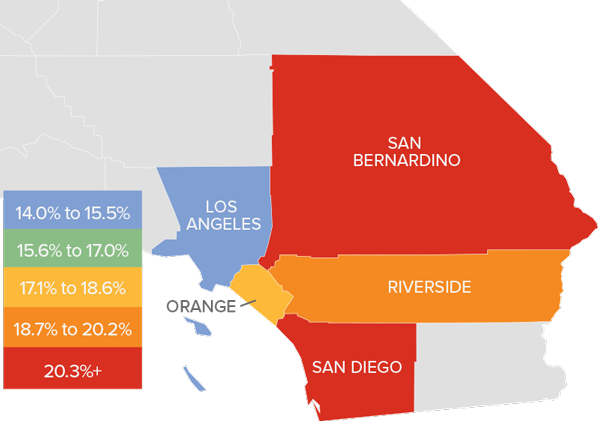
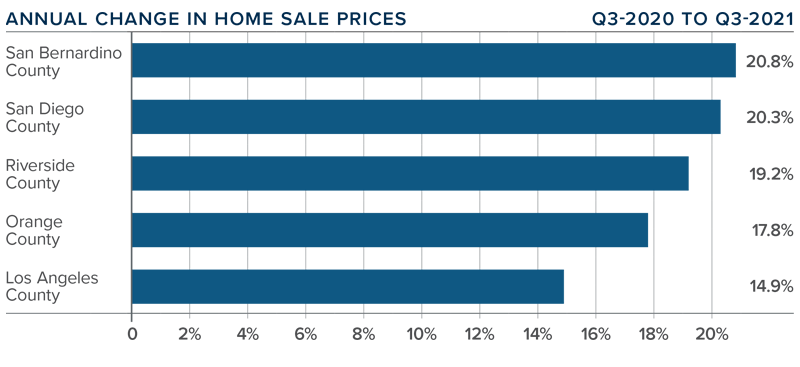
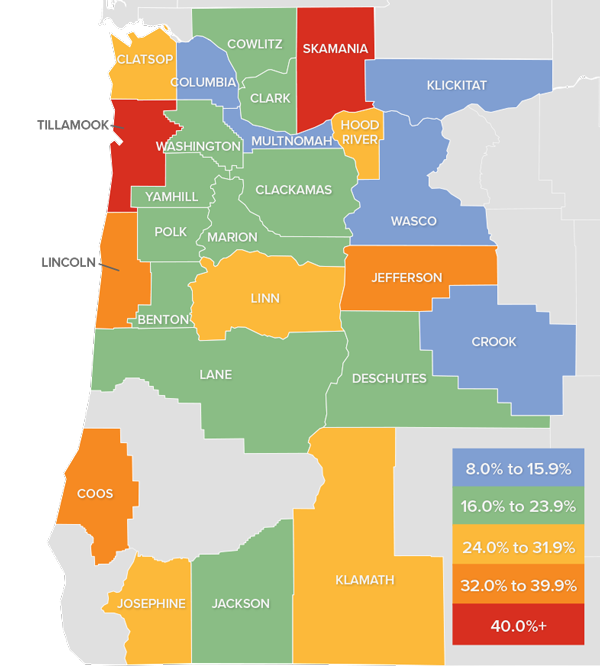
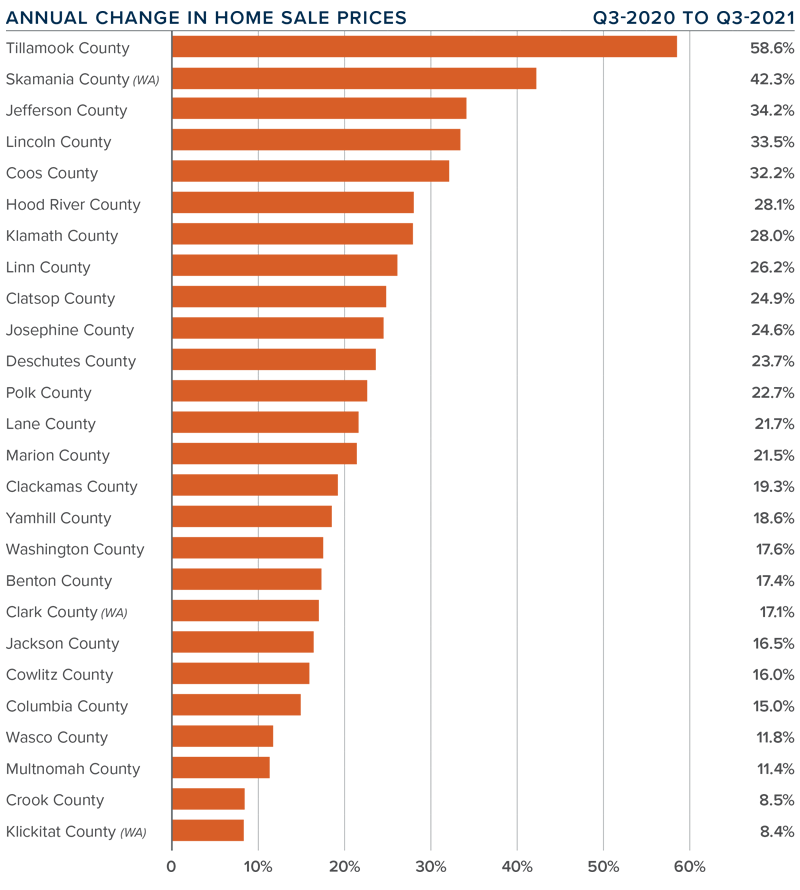
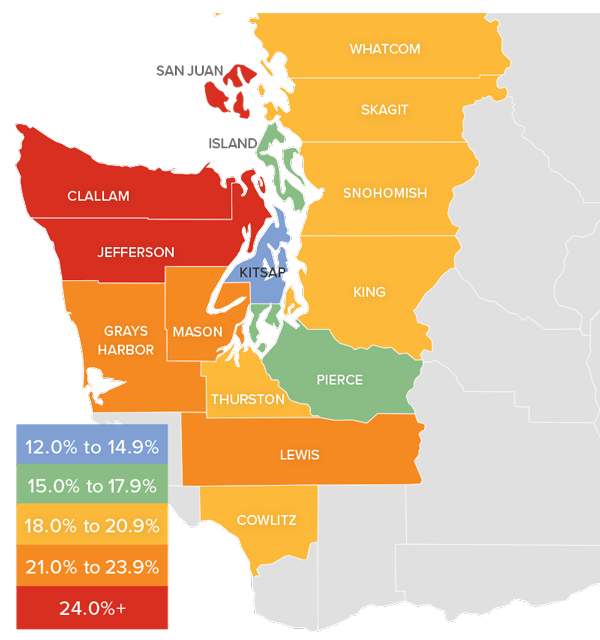
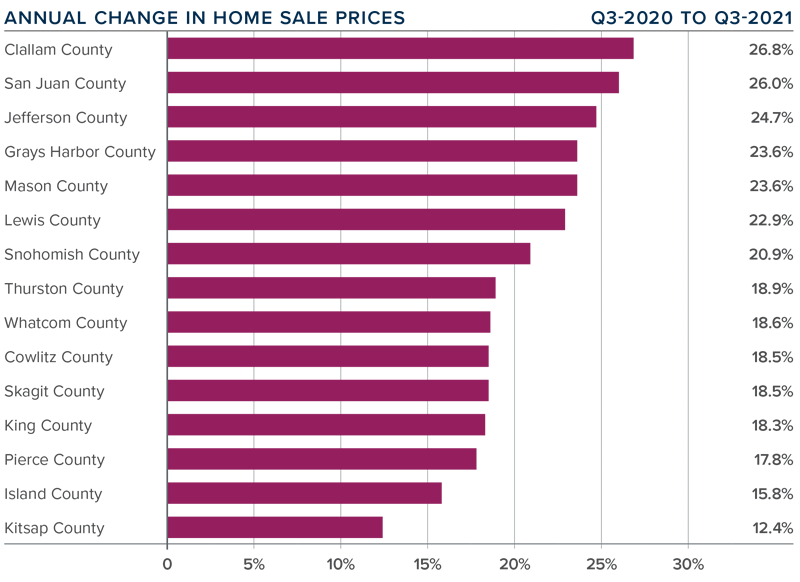
central washington Home Prices
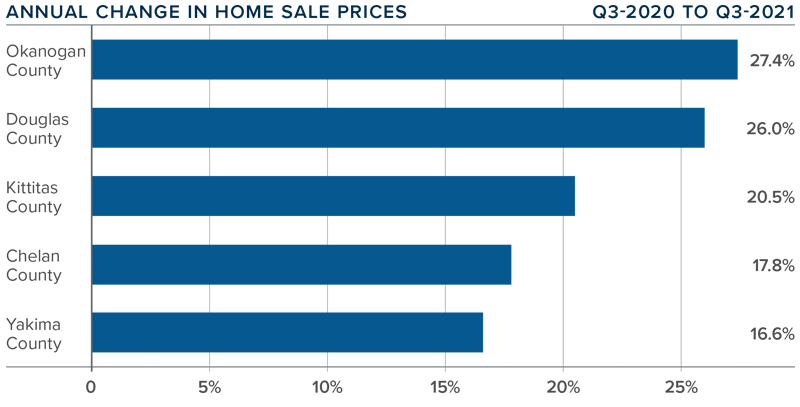
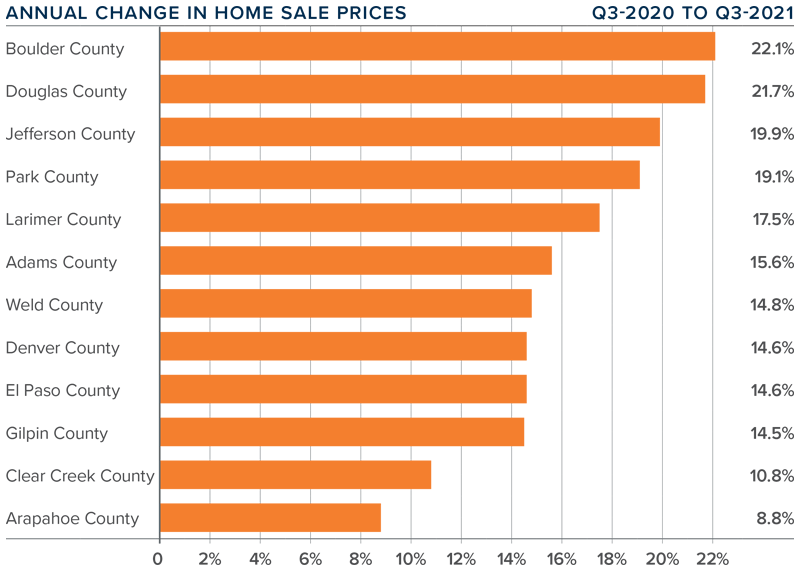
❱ Even with rising inventory levels, demand remained strong, which allowed the average home price in Central Washington to continue trending higher. Prices were up 16.7% year over year to $487,326. Home prices in the third quarter were also 3.3% higher than in the prior quarter.
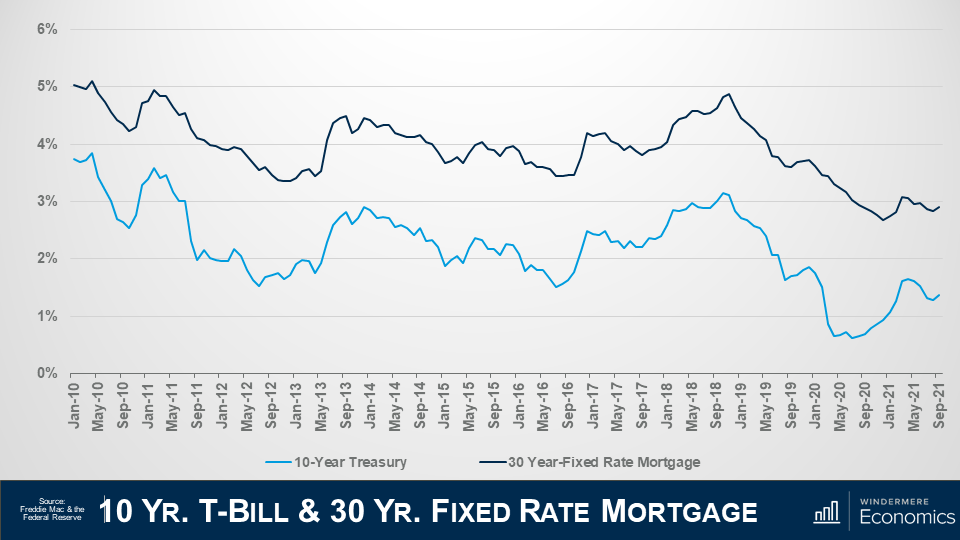
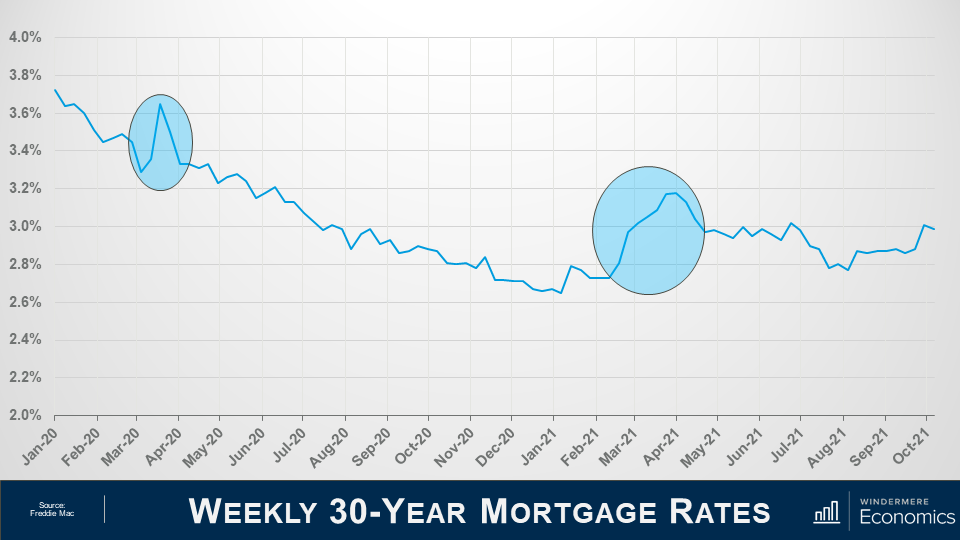
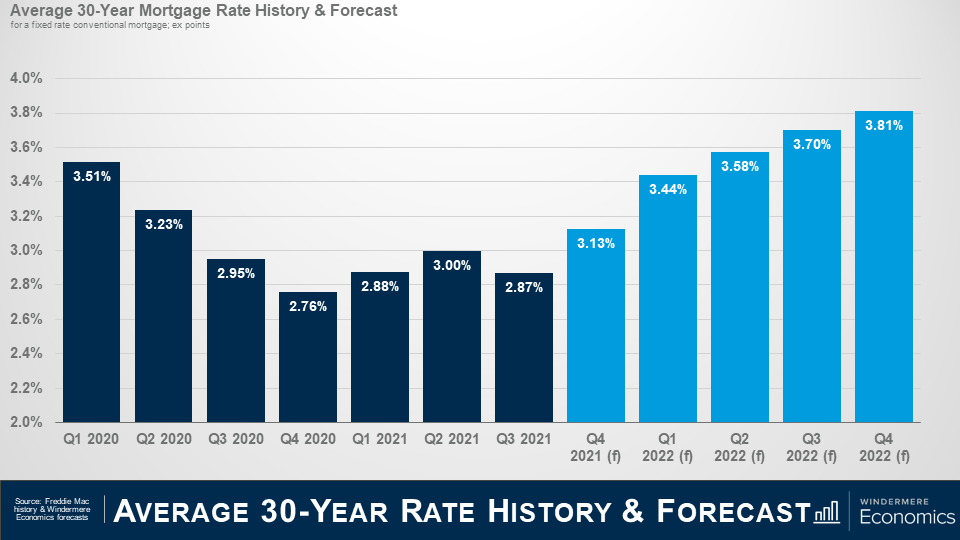
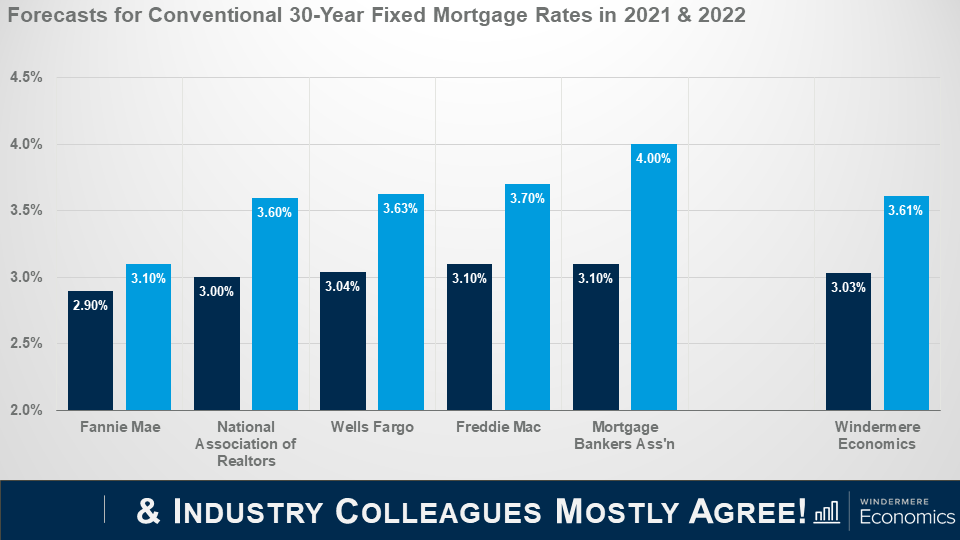
❱ Mortgage rates in third quarter remained below 3%, which also contributed to prices rising at above-average rates. Although I expect mortgage rates to start rising this winter, they are unlikely to increase to a level that will have a material impact on prices.
❱ All counties covered by this report again saw significant price increases compared to this time last year, with double-digit gains across the board. I would note that home sale prices were lower in Kittitas County compared to the second quarter, but it is no cause for concern as small markets can exhibit extreme swings in price.
❱ Douglas and Kittitas counties remain technically unaffordable to households making the median income, but my bigger concern is that no county in the report is affordable for first-time buyers. New construction activity has not improved significantly, and with fewer homes being built, affordability issues continue.
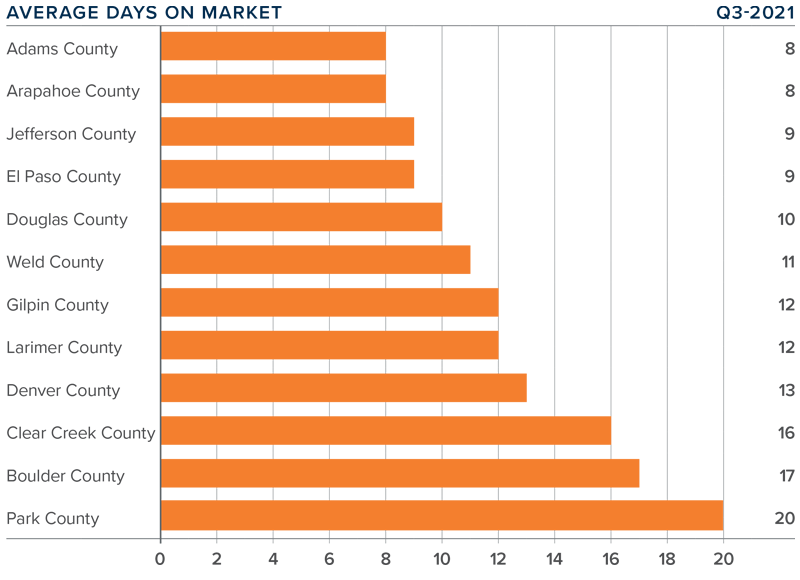
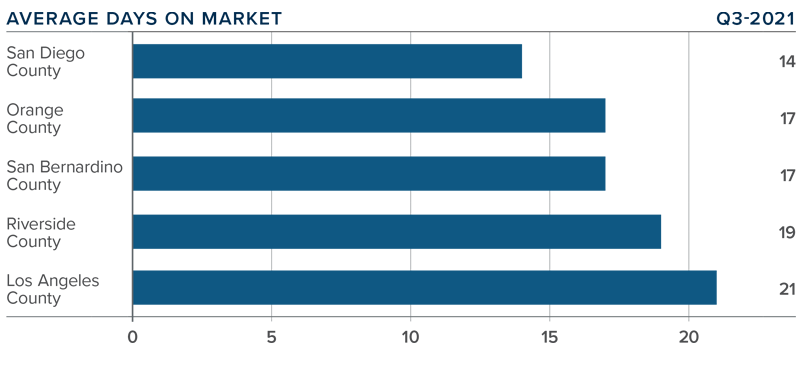
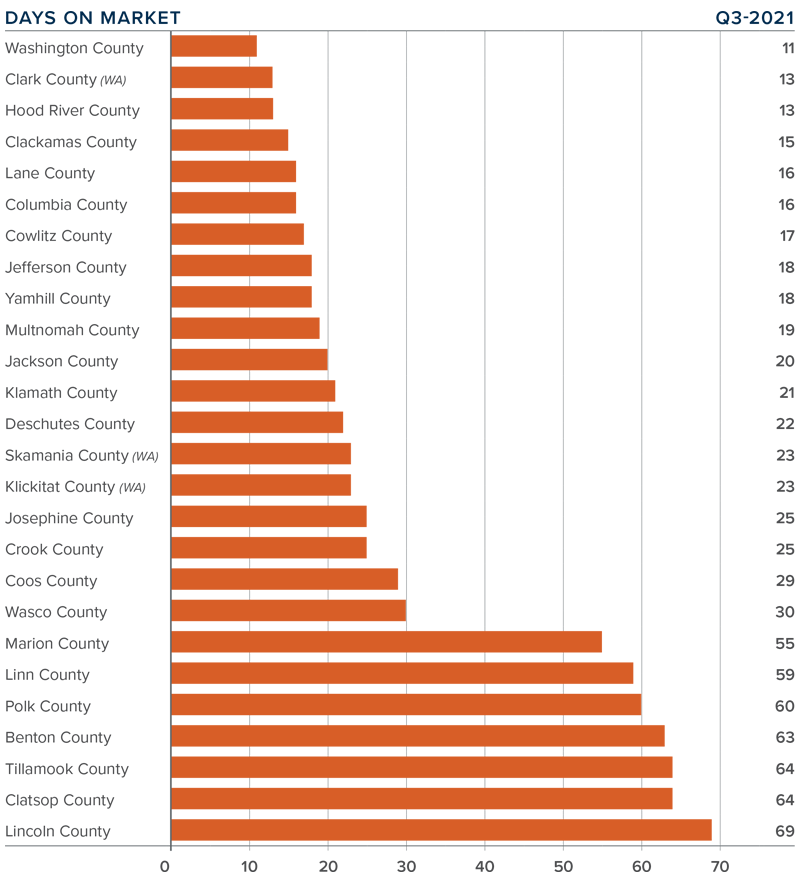
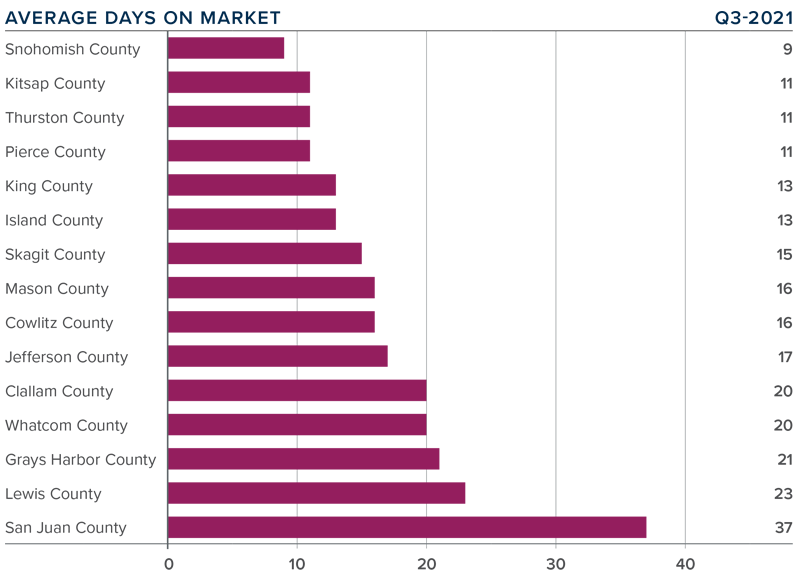
Days on Market
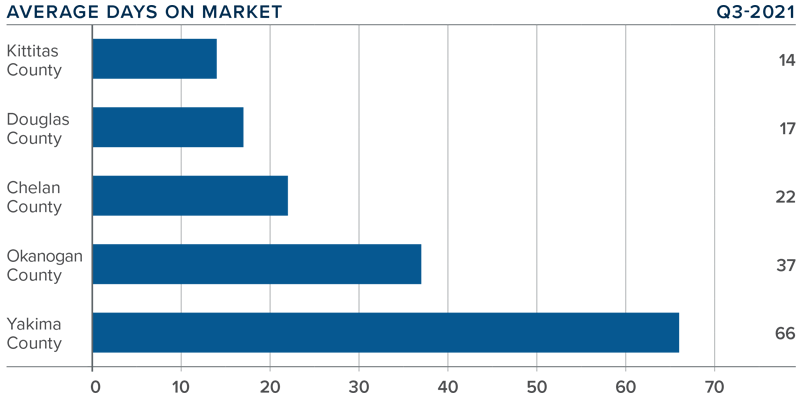
❱ The average time it took to sell a home in Central Washington in the third quarter of 2021 was 31 days.
❱ During the quarter, it took 26 fewer days to sell a home in Central Washington than it did a year ago.
❱ All counties saw the length of time it took to sell a home drop compared to a year ago, with noticeable improvement across the board. Compared to the second quarter of 2021, market time rose in Chelan and Douglas counties, but the increase was only three days in each market.
❱ It took five fewer days to sell a home in the third quarter than it did in the second quarter of this year.
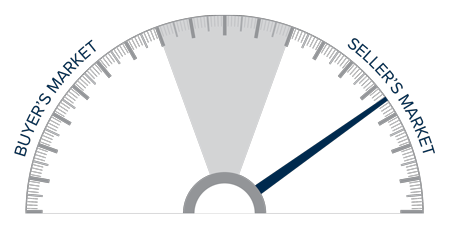
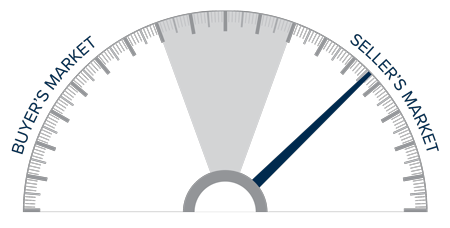
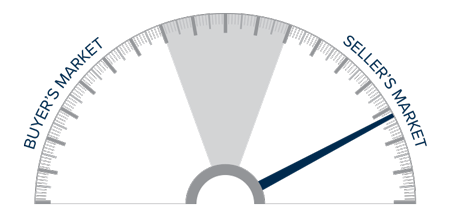
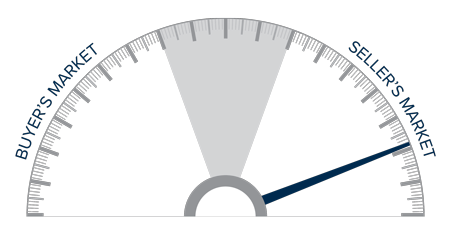
Conclusions
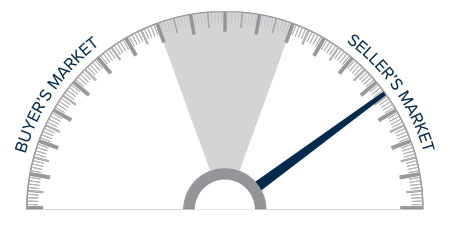
This speedometer reflects the state of the region’s real estate market using housing inventory, price gains, home sales, interest rates, and larger economic factors.
The positive for buyers in Central Washington is that listing activity has picked back up and average list prices have started to trend a little lower in many market areas. This is now causing sellers to have to compete somewhat for buyers. That said, it remains a seller’s market given lower days on market and strong buyer demand. I expect home prices to continue rising, but the pace of growth has started to slow. As such, I am moving the needle a little more toward buyers, but the market will remain active, and owners looking to sell a well-positioned and appropriately priced home are unlikely to have much of a problem finding a buyer.
About Matthew Gardner

As Chief Economist for Windermere Real Estate, Matthew Gardner is responsible for analyzing and interpreting economic data and its impact on the real estate market on both a local and national level. Matthew has over 30 years of professional experience both in the U.S. and U.K.
In addition to his day-to-day responsibilities, Matthew sits on the Washington State Governors Council of Economic Advisors; chairs the Board of Trustees at the Washington Center for Real Estate Research at the University of Washington; and is an Advisory Board Member at the Runstad Center for Real Estate Studies at the University of Washington where he also lectures in real estate economics.


")


