Living September 29, 2021

How to Winterize Your Waterfront Property

After the long days of summer have come and gone and fall is ending, it’s time to begin preparations for winterizing your home. When temperatures begin to dip, your lakeside cabin, seaside cottage or mountain lodge will need some extra TLC to make it through the colder months until spring comes around again. Whether your waterfront property is your vacation home or a primary residence, it’s important to properly winterize it in order to avoid potential damage and to save you time and money.

How to Winterize Your Waterfront Property

Pipes and Plumbing

Burst pipes are often the cause of water damage. Prevent a water damage emergency at your waterfront property this winter by being proactive.

If your waterfront home is your summer getaway, then disconnect your hoses from outside pipes to prevent them from freezing and breaking. If you plan to turn the heat off for the winter, turn off your main water supply and open your faucets. Any water left in your hoses can cause damage, so be sure to drain the hoses connected to your dishwasher, washer, and any other appliances.

If you’ll be calling your waterfront property home for the winter, thoroughly inspect the insulation for both your interior and exterior pipes. Any areas where insulation is lacking could lead to a cracked pipe, which has the potential to cause serious damage and could end up costing a significant amount of money to repair.

Roof and Gutters

Properly winterizing your roof and gutters will help to avoid a buildup of rain, snow, or debris turning into a structural issue. For homeowners with a shingle roof, this is the time to check your roof for any signs of damage and make repairs accordingly. Cracked shingles can be carried off by high winds, torn off in a winter storm, or may fall to the ground after being struck by a fell branch, leaving your roof vulnerable to leaks.

This is especially important if you will be away from your waterfront property all winter. Since you won’t be around, you may not be aware that your roof has been damaged until it’s too late.

For metal roofs, check to make sure everything is screwed down tight. Clear your gutters of leaves and debris. The heavier your gutters become, the more prone they are to leaks, and could potentially rip away from your roof. Keep your gutters clear throughout the winter. Any blockages of leaves, twigs, or ice could lead to a leak, damaging your walls and insulation.

Other Areas

Once your plumbing, pipes, roof, and gutters are properly winterized, look to other areas of your property to prepare for the winter ahead. Check all windows and doors to identify any air leaks. If you identify a leak, be sure to patch it before you take off for the winter—or if you’re staying in the home for the season, before temperatures start to dip. Inspect your home’s insulation and weatherstripping and make replacements as needed.

Bring your patio furniture inside and store them in a safe space to keep them in good condition until spring. Inspect your boat lift and dock. Consider investing in a bubbler or agitator system to keep ice away from your dock if you’re expecting freezing temperatures throughout the winter. Follow proper winterizing guidelines for your boat and any other watercraft you have before covering them or placing them in winter storage.

For more tips on home maintenance throughout the seasons and much more, visit the Living section of our blog.

Windermere Blog – Living

Market News September 27, 2021

9/27/2021 Housing and Economic Update from Matthew Gardner

This video is the latest in our Monday with Matthew series with Windermere Chief Economist Matthew Gardner. Each month, he analyzes the most up-to-date U.S. housing data to keep you well-informed about what’s going on in the real estate market.  


Hello there!  I’m Windermere Real Estate’s Chief Economist, Matthew Gardner, and welcome to the latest episode of Mondays with Matthew.


Today we are going to take a look at the latest Home Purchase Sentiment Index survey that was just put out by Fannie Mae. And for those of you who may not be familiar with this survey, it’s actually pretty important and one that I track closely as it’s the only national, monthly, survey of consumers that’s focused primarily on housing.


The survey shows the responses of 1,000 consumers across the country to roughly 100 survey questions on a wide range of housing-related topics. Now, don’t worry, we aren’t going to look at all 100 questions – just the ones that solicit consumers’ evaluations of housing market conditions and that also address topics related to their home purchase decisions.

Two line graphs side by side on a presentation slide titled “Home Purchase Sentiment”. On the Left is a graph showing the U.S. Home Purchase Sentiment Index Index Level from January 2021 to August 2021. From January 2021 to July 2019, there’s a slow increase from just above 65 to a peak just under 95. In May 2020 however, there’s a sharp valley that dips between 60 and 65. On the right shows the last three years where the Pandemic induced drop is more clear. The drop in sentiment index lasted roughly from February 2020 to August 2020, and has held relatively stable ever since, sitting between 75 and 83.


So, as you can see here, the overall index was trending higher pretty consistently until the pandemic happened which had massive, but temporary, impacts. And looking the last 3-years, you can get a better idea as to the speed of the pandemic induced drop – pretty remarkable.

Now, you will also see that the index recovered quite quickly; however, it fell again last fall as the pandemic was not going away at the speed many had hoped for – it rose again this spring but has been pulling back for the past few months but, that said, the August index level essentially matched the level seen in July.

Now let’s look at the questions that are used to create of the index number and how consumers responded.


Three lines on the same graph on a slide titled “Is it a Good Time to Buy?” which shows sentiment compared to those who think it’s a good time to buy and those who think it’s a bad time to buy. The graph’s x axis shows the percentage of respondents and the y axis shows dates from August 2018 to August 2021. The navy line indicates “Good Time to Buy” the light blue indicates bad time to buy, and the red indicates the net percentage good time to buy. The navy line sits above the other two lines for the most part, but it dips below and switches places with the light blue line in April 2021. The net share of those who say it’s a good time to buy jumped 7%, which is the first time it’s improved in the last four months.


When asked whether it was a good time to buy a home, the percentage who agreed with that statement rose from 28 to 32%, while the share who thought that it is a bad time to buy dropped from 66 to 63%. And, as a result, the net share of those who say it is a good time to buy jumped 7 points month over month and its notable that this is the first time the net share number has improved in the past 4-months.

What I see here is that – although improving modestly, the general consensus is that it is not a good time to buy and that sentiment is being driven by two things: One – there are still not enough homes on the market, and two, rapidly rising prices are scaring some people.


Three lines on the same graph which shows seller sentiment. The presentation slide I titled “Is it a Good Time to Sell? The graph’s x-axis shows percentages from -60% to 100% and the y-axis shows thedates from August 2018 to August 2021. The navy line represents those who think it’s a good time to sell, the light blue line indicated those who think it’s a bad time to sell,and the red line indicates the net percentage of people who think it’s a good time to sell. The navy line is mostly on the higher end, sitting in the 65% range, until March 2020 when it flips with the light blue line. They switch back in August 2020 when they are 48% and 44%. The different grows in the last few months, landing at 54% net difference in August 21.


And when asked if they thought it was a good time to sell their homes it was interesting to see that share drop from 75 to 73% while the percentage who said that it’s a bad time to sell dropped 1 point to 19% and as a result, the net share of those who said it was a good time to sell pulled back by 1% but it still indicates that more owners think that it is a good time to sell than don’t.


Three lines on the ame grah to compare different sentiments about whether home prices will go up in the next 12 months. The slide is titled “Will Prices Go Up or Down Over the Next 12-Months” and the x-axis shows the percentage of respondents from -20% to 60%, and the y-axis shows the dates from August 2018 to August 2021. The navy lineindicates the respondents who thinkprices will go up, the light blue line shows the respondents who think prices will go down, and the red line shows the net percentage difference. In August 2021 net share of Americans who say home prices will go up dropped by 9 points – from 25%, down to 16%.


Looking now at the direction of home prices over the next 12-months, the percentage who think that home prices will rise fell from 46 to 40%, while the percentage who expected home prices to drop rose from 21 to 24%.

As a result, the net share of Americans who say home prices will go up dropped by 9 points – from 25%, down to 16%.

Although this may sound concerning, I should add that the share of respondents who thought that home prices will remain static over the next year rose from 27% to 31%.


Three lines on the same graph comparing the different expectations of people considering the mortgages rates of the next 12 months. The slide is titled “Mortgage Rate Expectations for the Next 12-Months” and the graph’s x-axis goes from -80% to 80% and the y axis shows dates from August 2018 to August 2021. The navy line indicates respondents who think mortgage rates will go up, the medium blue line shows those who think mortgage rates will go down, and the red lines shows the net percentage rates will go down. Most people think rates will go up. The net share of Americans who believed that mortgage rates will go down over the next 12 months rose by 5%


On the financing side, the share who think mortgage rates will rise over the next 12 months dropped from 57 to 53%, while the percentage who believed rates would be lower rose from 5% to 6% and, as a result, the net share of Americans who believed that mortgage rates will go down over the next 12 months rose by 5%, and with 35% of respondents thinking that that rates will hold steady – it’s clear to me that a vast majority are not worried about mortgage rates rising.

The takeaways for me so far are that consumers tempered both their recent pessimism about homebuying conditions and their upward expectations of home price growth.

Most notably, a greater share of consumers believe that it’s a good time to buy a home – though that population remains firmly in the minority at only 32% – while the ongoing plurality of respondents who expect home prices to go up over the next 12 months dropped but was still well above the 24% of consumers who believe home prices will fall.

Now, there are two more questions that are worth looking at which aren’t directly related to home buyers and sellers but are still important as they look at employment and incomes.


Titled “Are you worries about losing your job in the next 12 months” three lines on the same grph show the comparison of respondents between Augut 2018 and August 2021. The navy line represents the respondents who are not concerned, the light blueline shows those who are concerned, and the red line shows the net percentage not concerned. The net share of Americans who say they are not concerned about losing their job fell by 4 percentage points month over month, but remains well above the level seen a year ago.


The percentage of respondents who said that they are not concerned about losing their job in the next 12 months remains very high at 82%, but it did drop by 2 points month-over-month, while the percentage who said that they are concerned ticked up to 15% from 13%. As a result, the net share of Americans who say they are not concerned about losing their job fell by 4 percentage points month over month, but remains well above the level seen a year ago.


This slide is titled “Is your household income higher now than it was 12-months ago?” the graph has 3 lines on it comparing different responses from the survey. The x-axis goes from -5% to 40% and the y-axis shows the dates from August 2018 to August 2021. The navy line indicates respondents who reported a higher income, the light blue indicates those with lower income and the red line shoes the net percentage who have higher income. The navy line is mostly the largest portion staying on the top of the graph, but it dips below the light blue line in April 2020, May 2020, and February 2021. The red line say a 1% increase in the last month, but rose from 9% in August 2020 to 14% in August 2021.


And finally, when households were asked about their own personal finances, the percentage of respondents who said that their household income is significantly higher now than it was 12 months ago pulled back one point to 26%, while the percentage who said that their household income is significantly lower dropped to 12%.

As a result, the net share of those who said that their household income is significantly higher than it was a year ago rose by 1 percent month over month and came in 5 points higher than a year ago. It’s also worthwhile noting that most said that their household income is about the same as it was a year ago with that share rising from 56 all the way up to 59%.


Looking at all the numbers in aggregate, the index level was relatively flat in August with three of the index’s six components rising month over month, while the other three fell, and that tells me that the continued strength of demand for housing and definitely favorable conditions for home sellers may well be offsetting broader concerns about the Delta variant of COVID-19 as well as rising inflation that have both negatively impacted other consumer confidence indices.

Most consumers continued to report that it’s a good time to sell a home – but a bad time to buy – and they most frequently cite high home prices and a lack of supply as their primary rationale.


However, the ‘good time to buy’ component, while still near a survey low, did tick up for the first time since March, perhaps owing in part to the very favorable mortgage rate environment as well as growing expectations that home price appreciation will begin to moderate over the next year. A sentiment that I personally agree with.

Well, I hope that you have found this month’s discussion to be interesting. As always if you have any questions or comments about this topic, please do reach out to me but, in the meantime, stay safe out there and I look forward the visiting with you all again, next month.


Bye now!

Living September 22, 2021

How to Fall Proof Your Home

Each object in a home serves a purpose, but for those who experience dizziness and numbness, many of them can also be a potential hazard. Taking steps to reduce the risk of falling in your home is a worthy exercise for any homeowner, especially if you have elderly family members or young children living in your home or visiting often. Here are some ways you can fall proof the rooms in your home.

How to Fall Proof Your Home

Kitchen

The kitchen is synonymous with spills and messes. When these accidents happen, be sure to clean them up quickly and thoroughly to reduce the risk of a falling injury. Slippery floors have been the culprit of countless broken bones and bruises, so it’s best to wait until the cleaned spot is dry until you resume cooking.

Stay low to the ground as much as possible by keeping your most used items like spices, cooking utensils, and hand towels within reach to reduce the number of times you need to use a step stool.

Bathroom

In the bathroom surfaces are often slippery and slick, and the hard tile makes for an unforgiving landing spot. It’s common for homeowners to place a non-slip mat in the shower or tub to reduce the risk of slipping and falling. Grab bars are a more permanent option for making the bathroom safer. For those interested in installing a grab bar but have reservations about the aesthetics of installing a grab bar, look at pieces that align with your existing décor. Match the grab bar with your shower head, shower rod, and towel racks to make it fit with the space.

Bedroom

The key to preventing falls in the bedroom is visibility. Bedrooms are cozy, intimate spaces, which means that space can often be limited. Keep all pathways clear and make sure that your nightstands and bedside lamps are well within reach. Stow any cords next to your bed to avoid tripping over them in the night.

Staircases

We’ve all taken a tumble on the stairs at some point or another. To mitigate the risk of falling, keep your stairs organized at all times. It’s easy for clutter to build up at the top or bottom of the stairs or on platforms between floors, but these objects are tripping hazards. Consider installing a handrail if you don’t have one or add a second one if you currently only have a handrail on one side.

For more information on home safety, cleaning tips, and more, visit the living section of our blog.

Windermere Blog – Living

Buying September 20, 2021

What is a Buyer’s Market?

Much can be determined about the conditions of a local real estate market by its supply and demand. When the supply of available homes is greater than demand, it’s referred to as a buyer’s market. Reduced listing prices, longer days on market, and an increased number of re-listings are also signs of a buyer’s market. While the current market is far from favoring buyers, it’s still a good idea to understand how a shift in the conditions could impact your search for a new home when the time comes.


What is a Buyer’s Market?

A buyer’s market creates ideal conditions for those looking to purchase a home. With more homes on the market than buyers, sellers must compete to gain their attention. In a buyer’s market, inventory is high, which means buyers can take their time in finding the right home as there is simply more to choose from. It’s common for homes to be on the market for longer periods of time. Sellers will sometimes need to drop their price to gain a competitive advantage, a selling tactic that is not nearly as common in hotter markets. To get a gauge of your local market conditions, talk to your Windermere agent about the current home price, sales, and inventory figures in your area.

How to Approach a Buyer’s Market

It’s understood that a buyer’s market favors buyers, but how can they utilize this advantage as they explore available listings? For one, buyers can be picky about finding the right home. Unlike a seller’s market, buyers have the luxury of weighing comparative advantages between homes knowing that time is on their side.

The conditions of a buyer’s market favor the buyer when it comes to negotiations as well. With fewer people buying homes, sellers are willing to be more flexible during the negotiation process, which gives buyers leverage. This underlines the benefits of working with a buyer’s agent. Buyer’s agents deliver significant value to the clients they represent in their ability to find the right home, streamline the buying process, and handle the negotiations and offer phases of a home purchase.

If you are selling a home while looking to purchase, you likely have the opportunity to make your offer contingent on the sale of your existing home, whereas in a seller’s market, there is a low chance of getting a contingent offer accepted. Contingent offers can be tricky, but when done correctly, it means that you don’t have to buy if you can’t sell.

When an agent sees that a home has been on the market for quite some time, that will fuel their ability to negotiate a lower price. In these market conditions, the chances are low that buyers will enter a bidding war or that a home will suddenly sell overnight to a competing offer. However, once buyers have identified their top candidate home, they should work with their agent to form a strategy for making a successful offer.

Sellers will be doing the most they can to make their homes stand out amongst the high number of available listings. It’s common for them to make repairs, upgrades, and other improvements to their homes before placing them on the market to entice buyers. Accordingly, a buyer’s leverage in negotiations carries through to contingencies, where they can work with their agent to negotiate repairs—a proposition that sellers will be more open to, given the limited number of buyers.


The conditions of a buyer’s market put the buyer in a favorable position as they go about finding the right home. For more information on how to increase your buying power, talk to your Windermere agent. If you are interested in understanding more about your local market conditions, or are looking to purchase a home, connect with a Windermere agent here:

Design September 13, 2021

A Guide to Remodeling Your Bathroom

There are a variety of reasons that a homeowner may decide to remodel their bathroom; they could be looking to increase the value of their home for a future sale, they may have discovered repairs that need to be made, or perhaps they’re simply looking to maximize their enjoyment of the space. Whatever your motivation may be, consider the following information before the hammer hits the tile to make sure your bathroom remodel turns out as successful as you’d hoped.

A Guide to Remodeling Your Bathroom

Which bathroom remodel projects have the highest ROI?

Before you decide which projects to tackle, it’s worth your while to identify which bathroom remodeling projects have the highest ROI. This can be especially helpful if you’re thinking about selling your home in the near future. According to the Remodeling 2021 Cost vs. Value Report (www.costvsvalue.com¹), bathroom remodels can have as high as a sixty percent return on cost, while larger projects like bathroom additions return roughly fifty percent of their costs. The point is you likely won’t recoup every dollar you spend on your bathroom remodel, so choose your projects wisely. If you’re preparing to sell your home, talk to your agent about which bathroom projects are seeing the highest return in your local area.

How can I save on my bathroom remodel?

There are various ways to keep your costs down when remodeling your bathroom, but it depends on the scope of your project. If, while preparing to sell your home, you identify a handful of outstanding repairs that need to be fixed before you list, it may be difficult to pull off a low-budget bathroom remodel while still fetching a competitive sales price. Neglecting these issues can be a costly mistake, and in some cases can even jeopardize a sale.  

One way to save money on your bathroom remodel is to do it yourself. Identify the pros and cons of either doing a project DIY or hiring a professional. Though you may save money on labor, if you get in over your head on a project the costs can add up quickly, and you may end up having to hire a contractor to remedy the situation. If you decide to hire a contractor, thoroughly research multiple companies, ask for referrals from family and friends, and get multiple quotes before deciding which is best for the job.

Simple Bathroom Upgrades

As the scope of a bathroom remodel changes, so do its costs. According to the Remodeling 2021 Cost vs. Value Report, a midrange bathroom remodel cost an average of roughly $24,000 nationwide, while an upscale bathroom remodel was just over $75,000. But fear not, there are ways to give your bathroom a makeover without having to break the bank. Here are a few ideas for budget-friendly bathroom upgrades.

  • Refinish Your Tub: Remove all hardware from your tub and sand the entire surface smooth, evening out any chips or cracks and filling them with epoxy. Once the epoxy has dried, sand those areas one more time. Apply multiple layers of primer and topcoat as advised and buff the surface to finish off the job.
  • Add Décor: A well-decorated bathroom can revitalize the space. Add a fresh coat of paint to the walls, install a new faucet and shower head, and match your towel rods and shower curtains for a quick bathroom refresh.
  • Finishing Touches: The right bathroom lighting can make all the difference. Experiment with softer light bulbs or dimmers to create a sense of calm and relaxation. Add candles, scented oils, and new towels to make your bathroom feel like your own personal spa.

For more ideas on remodels, décor, and all things home design, visit the design page on our blog.

Windermere Blog – Design


  1. “© 2021 Hanley Wood, LLC. Complete data from the Remodeling 2021 Cost vs. Value Report can be downloaded free at www.costvsvalue.com.”
More September 10, 2021

Windermere Foundation Surpasses $44 Million Total Raised


Since 1989, the Windermere Foundation has supported low-income and homeless families throughout the Western U.S. Earlier this year, the Foundation proudly crossed the $44 million mark in total donations.

2021 has been an active year for giving back at Windermere. Our offices have continued to support their communities during the COVID-19 pandemic, donating time and money to local organizations. In June, Windermere celebrated its 37th Annual Community Service Day, which saw agents and staff from across the Windermere footprint show up in force to partner with local organizations serving a variety of needs. When all was said and done, this year’s Community Service Day resulted in hundreds of hours of volunteer time and over $269,000 in donations.

Through the efforts of Windermere agents, owners, and staff, the Windermere Foundation raised over $1 million in the first half of 2021. This included the Windermere Lloyd Tower office which partnered with Adelante Mujeres, an organization that educates and uplifts the low-income Latina population in the Portland area. The Windermere Coeur d’Alene office worked with Second Harvest to set up a mobile market at the Kootenai County Fairgrounds to feed those in need, and the Windermere Spokane office partnered with Vitalant to set up a blood drive for local blood banks with depleted supply due to the COVID-19 pandemic.

To learn more about the Windermere Foundation, visit windermerefoundation.com. To help support programs in your community, click the Donate button below.

content_Donate_button.jpg

Living September 8, 2021

5 Tips for Swimming Pool Maintenance

A swimming pool can turn a backyard into a grotto, an oasis, an at-home vacation spot. But to let the poolside good times roll, they require maintenance. Your local climate can often dictate how much you use your pool. For some homeowners, you may be swimming in your pool year-round. For others, the pool may be a summer ritual, only to close it up once fall temperatures start to plummet. No matter how often you use your pool, these tips will help you keep it in tip-top shape.

5 Tips for Swimming Pool Maintenance

1. Keep Your Pool Water Balanced

A well-balanced pool maintains the correct levels of chemicals and, through filtration and disinfection, avoids having to change the pool water year after year. The main levels of concern are pH, total alkalinity, chlorine levels and calcium hardness. Aim to keep these levels within the following parameters:

  • pH: 7.2 – 7.8
  • Total alkalinity: 80 – 120 ppm
  • Chlorine levels: 1 – 3 ppm
  • Calcium hardness: 180 – 200 ppm

2. Routine Cleaning

Regardless of the season, keeping your pool water crystal clear requires routine cleaning. Weekly tasks include vacuuming, backwashing the pool filter, applying algaecide and chlorine, and cleaning the skimmer baskets. Running the circulation system is a daily task, which keeps the pool water fresh. Pool walls are a commonly missed cleaning spot. Brush them routinely to prevent algae growth and to eliminate chemical buildup.

3. Closing Your Pool

If you don’t use your pool year-round, you’ll have to go through the steps of proper decommission to avoid any hang-ups when it’s time to open it back up. Stow all equipment including ladders, lights, and thermometers before cleaning and vacuuming the pool. After you’ve balanced the pool water, let the system run for up to twenty-four hours before adding winterizing chemicals. Once the chemicals have run through for a few hours, remove the pool equipment, and drain. Finally, cover your pool to protect it from debris during the offseason.

4. Opening Your Pool

For those who user their pools seasonally, the day you reopen your pool is cause for celebration. But before you draft up any pool party invitations, you’ll need to give it some TLC. If you use a removable pool cover be sure to store it in a safe, protected place. Fill the pool back up to the maximum fill line and clear any debris from the water’s surface. Once you’ve tested the water and properly balanced the levels, remove any winterizing plugs to get water flowing into the plumbing system again. Once you’ve tested all systems to make sure the water is being properly heated and pumped, cleaned the walls, vacuumed the floor, there’s only one thing left to do—cannonball!

5. Pool Offseason

Even when your pool is not being used it requires a watchful eye. Besides keeping your pool ready for when you open it back up, offseason maintenance will help to avoid any major repairs due to neglect. Check your pool water occasionally. Even if your pool is covered, it’s possible for leaves, sticks, and needles to make their way inside. Continue to monitor the balance of your pool water by checking the levels weekly and adjusting as needed. Check the pump, heater, and plumbing for any signs of damage and clean the filter regularly.

For more information on keeping your home and the systems in it well-maintained, read more on our blog:

Home Maintenance

BuyingSelling September 1, 2021

Buying and Selling a Home at the Same Time

Successfully selling a home and buying a home are significant accomplishments on their own, but when their timelines cross it can be difficult to manage both. If you’re thinking about doing both simultaneously, it’s equally important to understand the steps you can take to make the process go smoothly as it is to have a backup plan in case it doesn’t. Above all, the balancing act required to pull off both deals highlights the importance of working closely with a trusted and experienced real estate agent.

Do I buy or sell first?

One can imagine a perfect world in which the two transactions go through one right after the other. However, this is not usually the case. So, should you list your current home first or start by putting in offers on a new one? There are pros and cons to both.

Selling your current home first allows you to make offers on a new home with cash in your pocket, increases your buying power, and avoids having to juggle two mortgages simultaneously. On the other hand, it creates a gap of residence, often leaving homeowners wondering where they’ll stay until they move into their new home or whether they may need to rent before they can buy again. Sellers may also negotiate a rent-back agreement with the buyers, allowing them to rent the house from the new owners before they move in.

Buying before selling solves the need for any temporary housing and makes the overall moving process much easier. Having a residence established ahead of time means you’ll only have to move once, which can save you some serious stress during this time of transition. Oppositely, buying a new home before you sell your current one will put an added strain on your finances. Having two concurrent mortgages equates to taking on more debt, which could result in less-than-favorable loan terms for purchasing your new home. Without the lump sum generated by a home sale in your pocket, coming up with enough money for a down payment may be a challenge and obtaining private mortgage insurance (PMI) may be in the cards. Finally, buying before selling comes with an obvious assumption—that your current house will sell.

Ultimately, the order of operations depends on your situation. Perhaps you’re moving due to a change of employment, and you need to direct all your energy toward buying a new home by a certain date before you can even think about selling your current one. No matter which route you take, it’s important to communicate your timeline to your listing agent or your buyer’s agent so they can strategize accordingly.

Buying and Selling a Home at the Same Time 

Local Market Conditions

Buying and selling at the same time will come with a certain duality: at each step in the process, you’ll have to balance your responsibilities as both a buyer and a seller. For example, when assessing your local market conditions, you’ll be looking at not one, but two housing markets.

  • Seller’s Market: Selling in a seller’s market means that that you’ll need to be prepared to move once you list, since you could be looking at a short selling timeline. However, relying too heavily on the assumption that your house will sell quickly could make things dicey down the road. If you’re buying in a seller’s market, finding a new home may take longer than expected. You could potentially be waiting weeks or months for an offer to get accepted.
  • Buyer’s Market: Selling in a buyer’s market typically means that homes stay on the market longer. If you proceed with a new home purchase just after you’ve listed your current house, know that it may take a while to sell. If you’re buying in a buyer’s market you can afford to be picky, knowing that time is on your side. With fewer people buying homes, sellers will be more flexible, giving you leverage to negotiate your contingencies.

Having a Backup Plan

If only you could wave a magic wand and make both transactions go through as planned. That’s why it’s important to have a backup plan in place to right the ship should things go sideways at any point in the buying or selling process. Talk to your agent about which options may be right for you. Here are a few:

  • Sales Contingency: Buying your new home with a sales contingency allows you to opt out of the purchase contract if your home doesn’t sell by a specified date. Purchasing contingent on the sale is rare in highly competitive markets.
  • Bridge Loan: If your current home hasn’t sold yet and you’re not able to afford the down payment on a new home, a bridge loan may be a fitting solution. Bridge loans can be used to cover the down payment on a new house and are repaid once your existing home has sold.
  • Rent-Back Agreement: A rent-back agreement is a clause in the sales contract that allows the seller to rent their old home from the buyer for an agreed-upon period of time before the buyer moves in. This can be especially helpful in situations when the seller is having trouble finding a new home.

For more information on buying and selling a home at the same time, connect with an experienced Windermere Real Estate agent today by clicking on the button below.

Market News August 30, 2021

8/30/2021 Housing and Economic Update from Matthew Gardner


This video is the latest in our Monday with Matthew series with Windermere Chief Economist Matthew Gardner. Each month, he analyzes the most up-to-date U.S. housing data to keep you well-informed about what’s going on in the real estate market. 


Hello there!  I’m Windermere Real Estate’s Chief Economist, Matthew Gardner, and welcome to the latest episode of Mondays with Matthew.

Today I wanted to take a look at the several housing related data releases that came out in August, and I am going to start off with the new home sector and the July numbers for housing permits and starts.


A bar graph and a line graph, both titled "Single Family Building Permits." The bar graph's y-axis shows the number of single family building permits in the thousands, from 600 to 1,400. The x-axis shows dates from June 2019 to July 2021. Year-over-year in the month of July, the number of permits has gone from 852,000 in 2019, to 993,000 in 2020, to 1,048,000 in 2021. The spike in permits occurred in January 2021, at nearly 1.3 million permits. The line graph shows single family permits in the thousands on the y-axis, from 0 to 2,000 and the years 2004 to 2021 on the x-axis. In 2004, the number of single family permits was around 1.6 Million, it bottomed out in 2009 below 400,000, and has risen to over 1 million again in 2021.


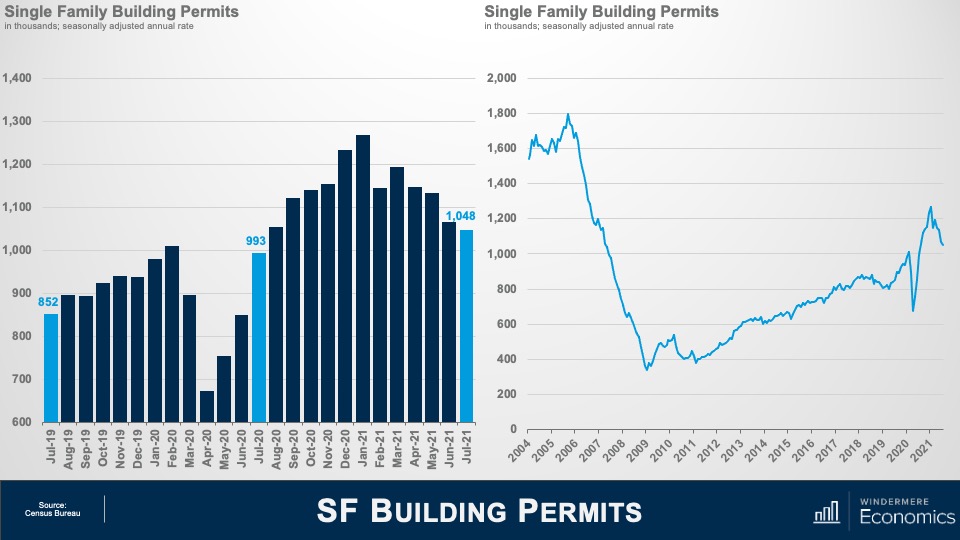
New home permits – and here I am referring to single-family permits – fell by 1.7% (or roughly 18,000 units) in July to an annualized rate of 1.048 million units and have been heading backwards since March.

But I always like to put things into perspective and you can see here that although we have seen a pullback over the past few months, the trend has actually been heading higher since we emerged from the financial crisis in 2011.Of course, COVID had a very pronounced impact on permit activity, but it bounced back rather impressively, that is until the parabolic increase in lumber and other costs really started to hit builders hard. 


A bar graph and a line graph, both titled "Single-Family Home Starts." The bar graph show number of starts in the thousands on the y-axis, from 600 to 1,400 and dates on the x-axis from July 2019 to July 2021. Year-over-year in July, the number of starts went from 887,000 in 2019, to 995,000 in 2020, to 1.11 million in 2021. The line graph shows the number of starts in the thousands from 0 to 2,500 on the y-axis and years 2005 - 2021 on the x-axis. In 2005, the number of starts was around 4 million, hitting a low point in 2009 at around 500,000, returning to over 1.5 million in 2021.


And the slowdown in permits obviously impacted housing starts which dropped by 4.5% – or 52,000 units – to an annual rate of 1.11 million.

Starts fell across most regions, with the exception of the west which rose by 0.9%. Declines were led by the Northeast (-6.3%), followed by the Midwest (-2.3%) and the South (-2.0%).

But again, for perspective, you can see that the longer term trend is still improving, but I am afraid not to the degree needed to address the massive housing shortage that the country faces.

If you have watched these videos for any length of time you will know that I like to look at homes under construction as opposed to housing starts – which many do not – as I believe it offers a better gauge of the market that permits or starts data. And for those who might not be aware of the difference between housing starts and houses under construction, a home is technically started if a foundation has been poured, but it does not mean that vertical construction has started, but homes under construction show just that.


A bar graph and a line graph, both titled "Single-Family Homes under Construction." The bar graph shows the number of homes in the thousands the y-axis, from 400 to 750 and months on the x-axis from July 2019 to July 2021. The bar graph shows that in July 2019 there were 524,000 homes under construction, 517,000 in July 2020, and a peak of 689,000 in 2021. The line graph shows homes under construction in the thousands on the y-axis, from 200 to 1,200 and years on the x-axis from 2004 to 2021. In 2004, there were 800,000 homes under construction, a low of roughly 200,000 in 2012, and back up to over 600,000 in 2021.


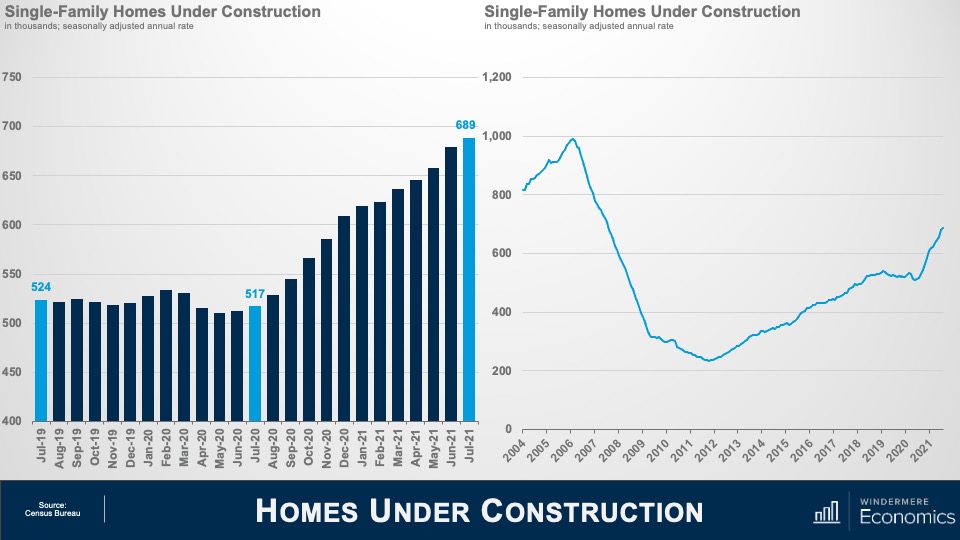
And the number of homes actually being built rose by 1.5% in July to an annual rate of 689,000 units, and that is 33% higher than the same time a year ago.

All regions other than the Northeast – which dropped by 1.6% – saw the pace of vertical construction rise versus June with the South leading the way with a 2.7% increase. This was followed by the Midwest which rose by 1.1%, and the West saw a more modest increase of 0.5%.

Again, when we look at a longer timelines, the growth is actually rather impressive, but, again, it still falls well short of demand.

So, what I see in this data is that the pullback in housing starts was not a surprise, given that permitting activity (which is a leading indicator for starts) having fallen in each of the prior three months. But despite this, the overall pace of new homebuilding actually remains relatively healthy, with the six-month moving average of homes under construction above the pre-pandemic trend at a little more than 655,000 units.

Although rising material costs, a significant shortage of qualified labor, and affordability challenges are all still keeping builders awake at night, I believe that the fundamentals for homebuilding remain solid, thanks mostly to an improving labor market backdrop and still exceptionally low inventory levels.

Additionally, a recent easing in mortgage rates, and a significant pullback in lumber prices which have fallen sharply since peaking in mid-May and are now back to pre-pandemic levels, also provide support to growing new construction activity.


Two line graphs, titled "Single-Family New Homes For Sale in the U.S." and "U.S. Single-Family New Home Sales." The "New Homes For Sale" line graph shows the number of homes in thousands on the y-axis, from 240 to 380 and months on the x-axis from July 2019 to July 2021. In July 2019 there were roughly 330,000 new homes for sale, while in July 2021 there was a high of over 360,000. The "New Home Sales" line graph shows the number of homes in the thousands on the y-axis from 400 to 1,100, and months on the x-axis, from July 2019 to July 2021. In July 2019, there were around 600,000 new home sales, a low of under 600,000 in April 202, and a high in January 2021 of nearly 1 million.


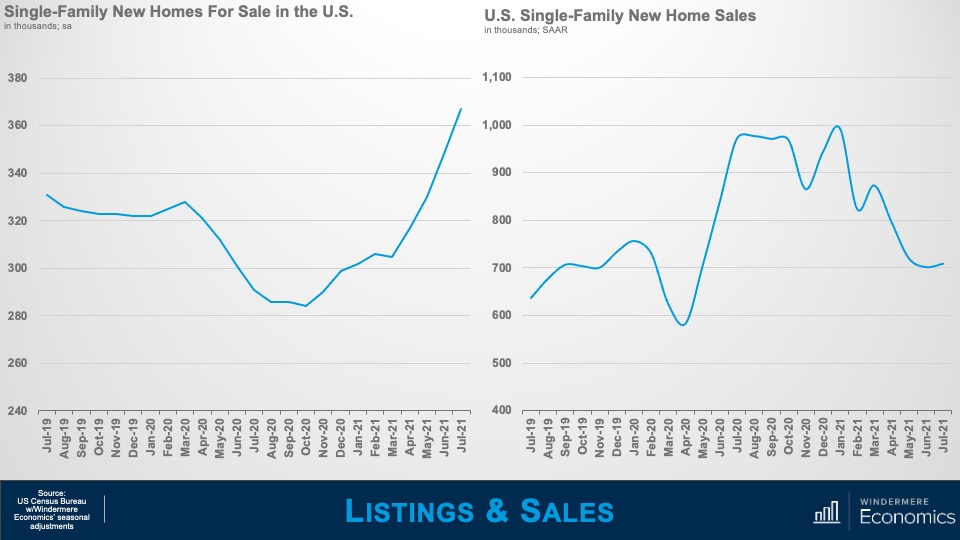
Moving on to new home sales in July and it was a bit of a mixed bag. As you can see here, the number of new homes for sale continues its upward trend – which bottomed out last Fall – and rose by 5.5% versus June and is up by over 26% from a year ago.

Now, this may sound to be great news but as I dug though the data, I saw a different story. You see, the jump in listings was driven by a record rise in homes for sale that have yet to be built.

In fact, the number of houses for sale that have yet to break ground accounted for almost 29% of total inventory. Why is this? It’s because many builders are very cautious about the market given expensive raw materials as well as limited land supply and construction workers.


A map showing the single-family U.S. home sales by region. In the west, there were 215,000 homes sold, a 14.4 % one-month change. In the midwest, there were 71,000 homes sold, a negative 20.2% change. In the northeast there were 22,000 homes sold, a negative 24.1 % change. In the southeast, there were 400,000 homes sold, a 1.3% one-month increase.


On the sales side of the equation, contract signings were up by 1% versus June to a seasonally adjusted annual rate of 708,000, but that is down by 27% from a year ago.

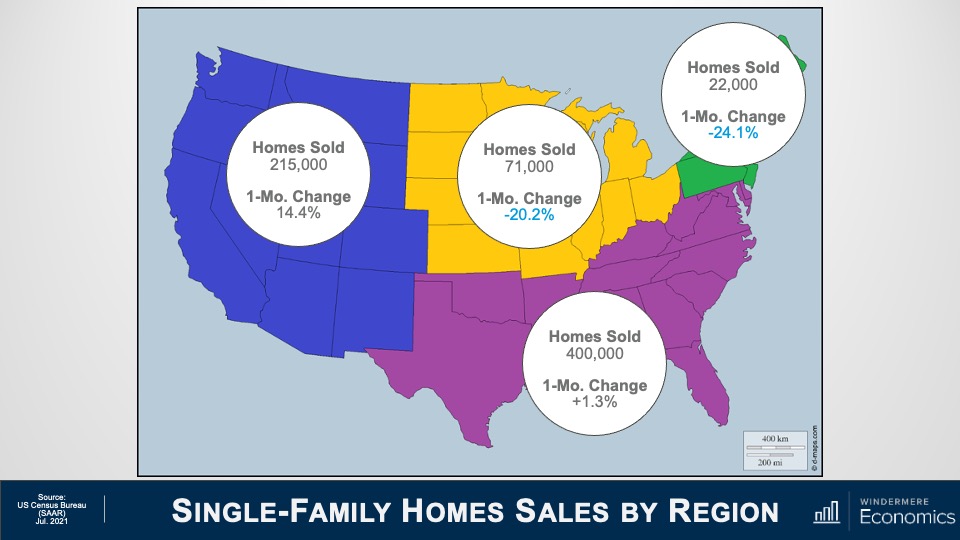
Last month’s gain in new home sales was driven by a 1.3% rise in the populous South and a 14.4% jump in the West, but sales plunged 24.1% in the Northeast and were 20.2% lower in the Midwest.

There can be no doubt that affordability is becoming an increasing issue in the new-home market. The median sale price is up almost 18% from its pre-pandemic level, which is a touch lower than the run-up in sales prices in the existing-home market, but still enough to deter potential homebuyers.

And cost is another factor – in addition to COVID-19 – that is accelerating the migration to suburban markets and metro areas in lower-cost states such as Arizona, Utah, Texas and Florida. But, by contrast, new home sales have weakened in areas where population growth has slowed, in part due to an outflow of residents seeking more affordable real estate, lower taxes and other lifestyle advantages. It will be very interesting to see if this is a trend that continues as we head into 2022.


Two line graphs titled "NAHB U.S. Housing Market Index" ad "Components of the HMI." The housing market index graph shows numbers from 0 to 100 on the y-axis and months from August 2019 to August 2021 on the x-axis. The index was at just below 70 in August 2019, dipped to a low of 30 in April 2020, hit a peak of 90 in November 2020, and was back to roughly 75 in August 2021. The HMI line graph shoows numbers from 0 to 100 on the y-axis and months from August 2019 to August 2021 on the x-axis. There are thrre lines: single family sales in orange, expectations in grey, and traffic in navy blue. All three follow the same shape, though traffic has stayed roughly twenty points below sales and expectations, bottoming out in April 2020 and peaking in November 2020.


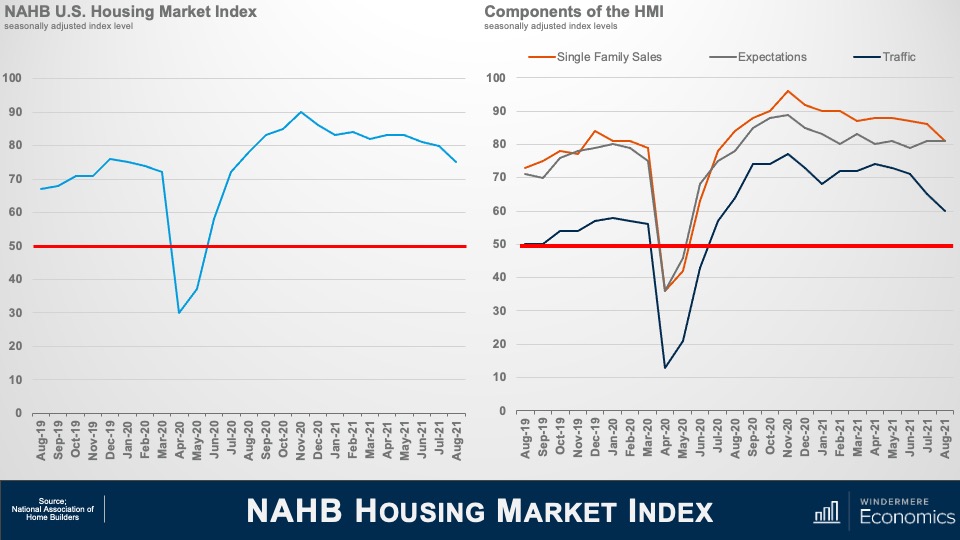
Moving on – the National Association of Homebuilders published their Index of Builder Sentiment in August, and the data rather echoes the numbers that we have just been discussing.  You can see that sentiment in the single-family market has been easing gradually in recent months, but it remains well above the 50 level, suggesting that more builders are seeing the market as good, rather than bad, even if the current index is at its lowest level in 13 months.

And when we look at the components of the index, sales conditions fell five points to 81 and the component measuring traffic of prospective buyers also posted a five-point decline to 60. But the gauge charting sales expectations in the next six months held steady at 81.

As we have talked about, builders are facing significant obstacles and this is impacting the pace of new development. According to Freddie Mac, the U.S. housing market is 3.8 million single-family homes short of what is needed to meet the country’s demand and in order to catch up, builders would need to construct between 1.1 million and 1.2 million single-family homes a year to meet long-term demand but, in truth, the start rate would need to be even higher to shrink the existing deficit that we are currently experiencing.

And with more demand than new supply, what happens? That’s right, buyers turn their attentions to the existing home market and that is a neat segue into the final dataset that dropped this month, and that’s the existing home sales numbers for July.


Two line graphs titled "Inventory of Homes For Sale in the U.S." and "Y/Y Change in New U.S. Listing." The inventory graph shows the number of homes for sale in the millions on the y-axis, from 1.0 to 4.5 and each December from 1999 to 2020 on the x-axis. Inventory was around 2 millin i nDecember 1999, peaking at nearly 4 million in December 2007, and down to just above 1 million in December 2020. The Y/Y graph shows the percentage changes on the y-axis from negative 100 percent to 60%, and months from March 2020 to July 2021 on the y-axis. In March 2020, the year-over-year change was around +10%. It dipped to below negative 40% in April 2020 and didn't resurface above 0% until December 2020. Peaking in April 2021 at +40%, the y/y change is hovering close to zero as of July 2021.


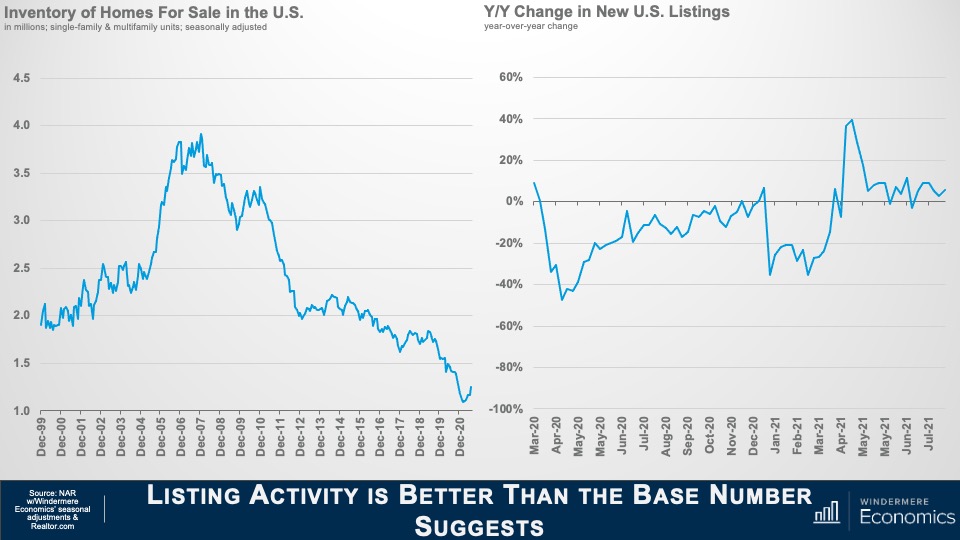
It was pleasing to see that, for the 5th month in a row, Inventory levels ticked higher and, unadjusted for seasonality, were measured at 1.32M units, but I like to look at the seasonally adjusted number and that came in at a still respectable 1.0246M units.

I also like to look at the number of new listings which gives a better view on the market – and as you can see here, they are up year-over-year and that is allowing sales to accelerate.

You see, the inventory number that NAR puts out represents the number of homes for sale at a set date in the month; however, new listings show the total number of homes that came on the market during that month and if a sale is agreed upon in the same month that it comes to market, then it is not included in the overall inventory number.


Three line graphs, titled "Existing U.S. Home Sales," "U.S. Single-Family Home Sales," and U.S. Condo/Co-op Home Sales." The existing sales graph shows the number in millions on the y-axis from 3 to 7 and months on the x-axis from January 2012 to March 2021. Sales were at roughly 4.5 million in January 2012, bottomed out at roughly 4 million in May 2020, and peaked at nearly 6 million in October 2020. The single-family home sales graph shows sales from 200,000 to 550,000 oon the y-axis and months from January 2019 to July 2021 on the y-axis. Sales were at just above 350,000 in January 2019, dipped to 300,000 in May 20-20, and returned to nearly 450,000 in July 2021. The condo / co-op sales remained around 50,000 from January 2019 to January 202, dipped to below 30,000 in May 2020, and rose to roughly 60,000 by September 2020, staying consistent until a slight drop off in July 2021.


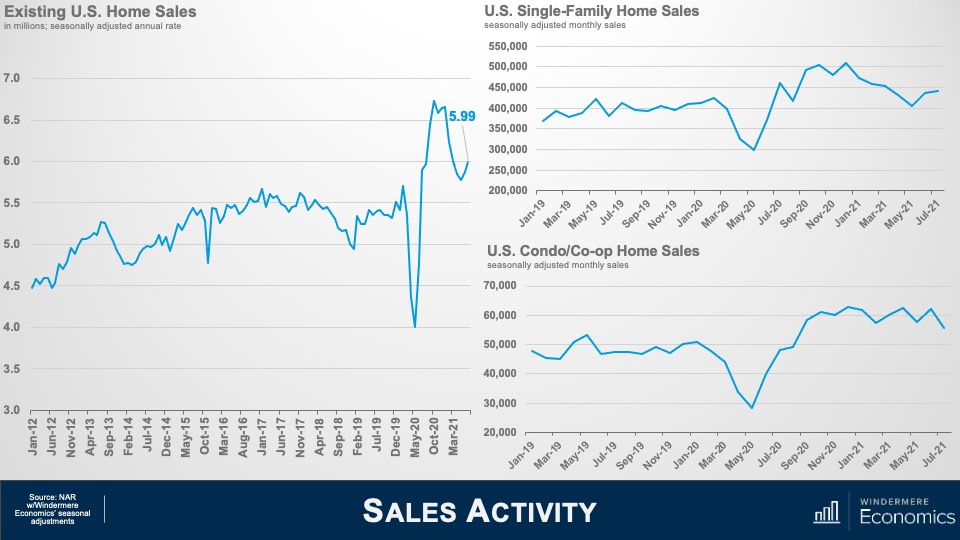
And because new listing activity is still pretty robust, it has allowed sales to tick back up as you can see here. On a seasonally adjusted, annualized basis, sales came in at 5.99M – up for the second month in a row but still well below the numbers we saw last Fall.

On a month-over-month basis, single-family home sales rose by 1% to almost 442,000, but multifamily sales dropped by over 10%, but were still up by 15% from a year ago.


Three line graphs titled "Median Sale Price of U.S. Existing Homes," "Median Sale Price of Single-Family Homes," and "Median Sale Price of Multifamily Homes." The median sale price graph shows prices from $180,000 to $380,000 on the y-axis and January dates from 2015 to 2021 on the x-axis. From January 2015 to January 2021, the median sale price has increased from roughly $200,000 to $359,900. Over those same dates, the median sale price of single-family homes graph shows an increase from roughly $200,000 to $367,000, while the multifamily homes graph shows an increase from roughly $200,000 to $307,100.


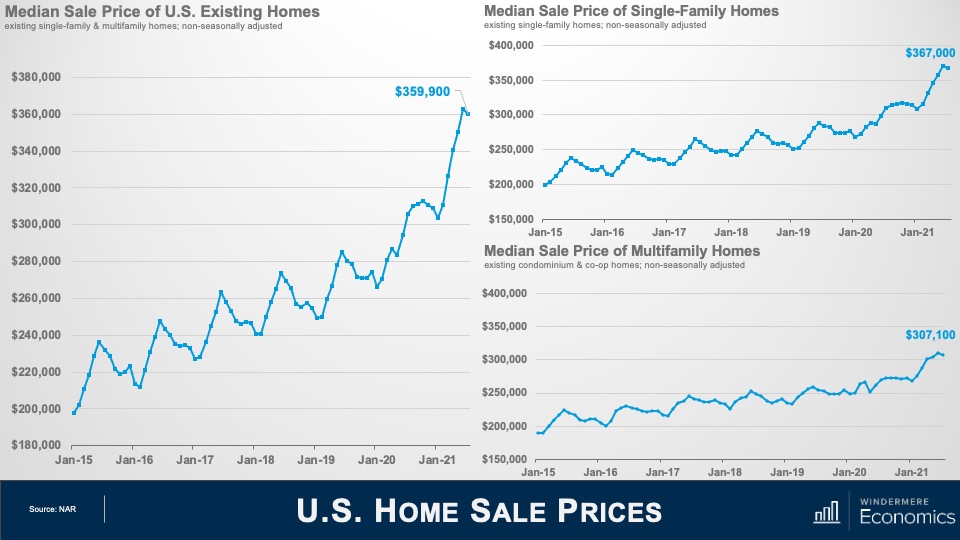
Home prices took a little breather in July – dropping by 0.8% month over month – but are still 17.8% higher than seen a year ago.

Single-family home prices also dipped by 0.8% to $367,000 – but are up by 18.6% from a year ago and multifamily sale prices dropped by 1.3% to $307,100 but were up 14.1% from July of 2020.


Three line graphs titled "Months of Inventory" The first one shows single-family and multifamily units. From January 2012, to January 2021, the graph shows an overall decrease from roughly 7 months of inventory to 2.6. The second graph shows just single-family homes decreasing from roughly 6 months of inventory to 2.6 over those same dates, while the third graph showing condo and co-op homes shows a drop from over 7 months of inventory in 2012 to 3.0 in January 2021.


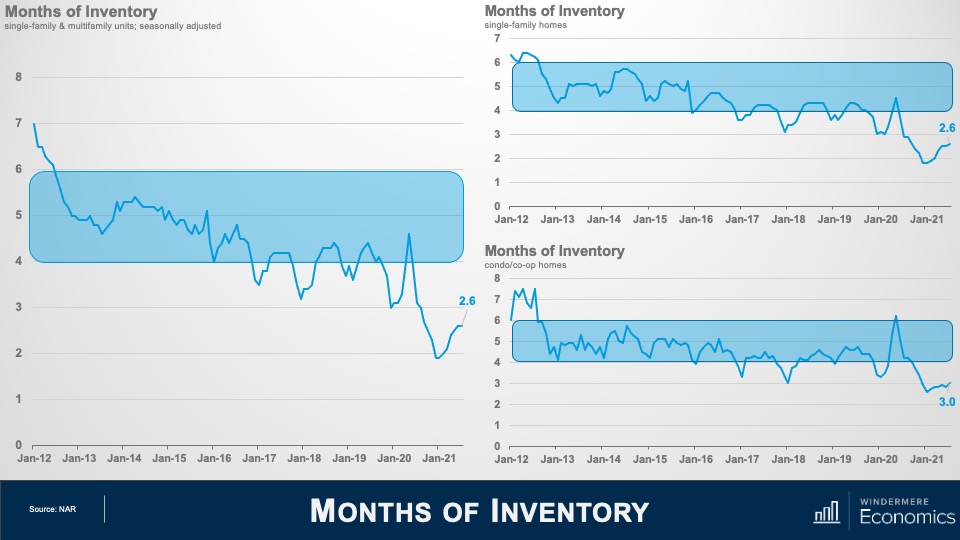
Even though we saw modest increases in listing inventory, the market is still far from balanced. At the existing sale pace, there is only 2.6 months of supply, well below the 4-6 months that is considered balanced, but certainly better than the 1.9 months we saw back in January.

The same was seen in the single-family arena which also showed 2.6 months of supply and things were slightly better in the condo and co-op world where there is currently 3 months of inventory.

As I went through the report in more detail, there were a few more nuggets worthwhile mentioning. Although it is true that inventory levels are somewhat higher – which is certainly a good thing – but the market remains remarkably tight.

For example, for every offer accepted on a home in July, there were 3.5 additional offers; half of all offers made in July were above the list price and, because the market remains highly competitive, the number of all-cash offers rose from 16% a year ago to 23% in July. And with 89% of homes going pending in the same month that they were listed, and the average days on market coming in at just 17, we are still quite far away from experiencing a normal housing market.

Well, I hope that you have found this month’s discussion to be interesting. As always if you have any questions or comments about this topic, please do reach out to me but, in the meantime, stay safe out there and I look forward the visiting with you all again, next month.

Bye now.

Design August 25, 2021

What is a Cape Cod Home?

Today, the Cape Cod architectural style is synonymous with waterfront property, windy beaches, and vacation getaways. Known for its distinct exterior features and cozy interior spaces, the Cape Cod home has become an American classic.

History of the Cade Cod Home

The original idea behind the Cape Cod home was to bring a bit of across-the-pond familiarity to the early English settlers in New England. The design of the home was conceptually similar to an English cottage, except with certain modifications to fit the harsher Northeast climate. These homes were built throughout the region during the 19th century, then experienced a surge in popularity in the early-to-mid twentieth century, due to a renewed interest in colonial-era architecture and their affordability in a post-World War II economy.


A close-up of the exterior of a cape cod home.

Image Source: Getty Images – Credit: OlegAlbinsky

What is a Cape Cod Home?

The Cape Cod style uses simple lines and shapes that recall the English cottages they’re inspired by. They are typically one or two stories, square or rectangle in shape, with steeply pitched roofs, shingled exteriors, window shutters, and a central chimney. The steepness of the roofs was designed to reduce snow buildup, thereby reducing the risk of a roof collapse from bearing too much weight. The characteristically low ceilings were meant to prevent heat from escaping, while the shutters served as a wind block against the cold New England breeze.

There are multiple styles of Cape Cod homes. The easiest way to tell the difference between styles is to count the number of windows on either side of the front door. If there are two windows on one side of the door, it is what is known as a “half cape.” A home with two windows on each side of the front door is known as a “full cape.”  Regardless of which sub-category a particular Cape Cod home falls under, they all share a flat front façade, which creates their square or rectangular shape. Over time, designers have updated the Cape Cod design to accommodate the needs of modern life, but their unmistakable aesthetic remains timeless.


Visit our Architectural Styles page to learn more about the history behind certain styles of home design, from A-Frame to Victorian. For more information on home design, remodeling, and decorating, visit the Design page on our blog.