
 Facebook
 X
X
 Pinterest
 Copy Link

The following analysis of the Oregon and Southwest Washington real estate market is provided by Windermere Real Estate Chief Economist Matthew Gardner. We hope that this information may assist you with making better informed real estate decisions. For further information about the housing market in your area, please don’t hesitate to contact your Windermere agent.
ECONOMIC OVERVIEW
Oregon added 30,900 new jobs over the past 12 months, representing an annual growth rate of 1.6%. The pace of job growth continues to taper, but it remains positive and I expect that this trend will continue as we move into 2020.
The Southwest Washington market (Clark, Cowlitz, Skamania, and Klickitat counties) added 3,180 new jobs over the past 12 months, which represents an annual growth rate of 1.4%.
Oregon’s unemployment rate was 3.9% in November, down from 4.3% a year ago. In Southwest Washington, the unemployment rate was 5%, up from 4.8% a year ago.
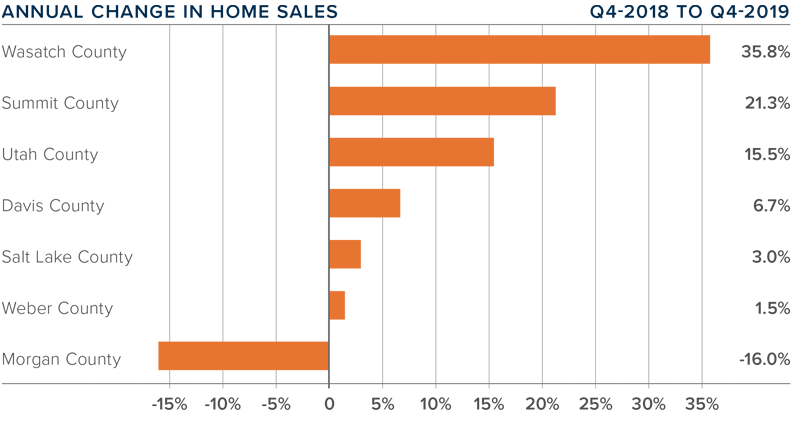
HOME SALES
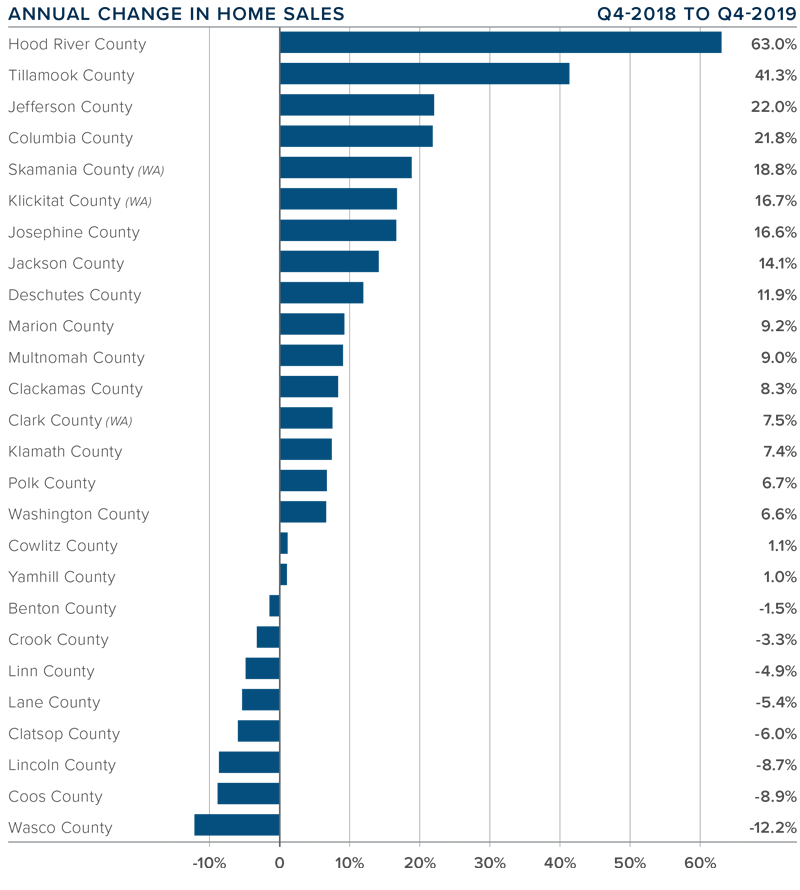
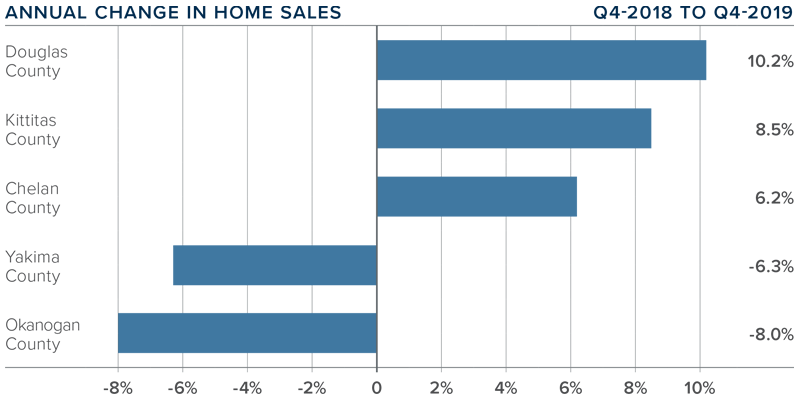
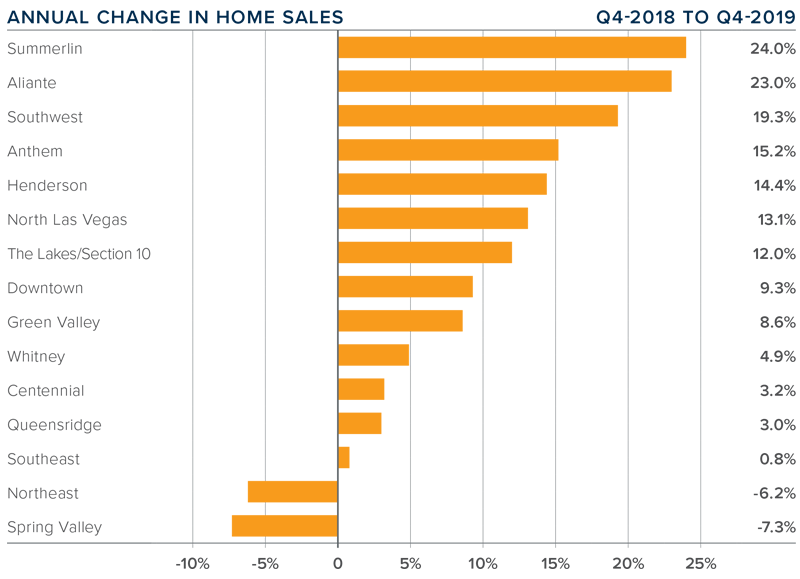
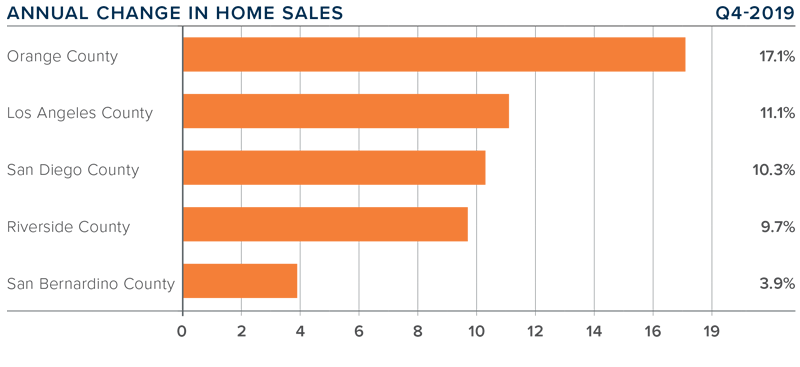
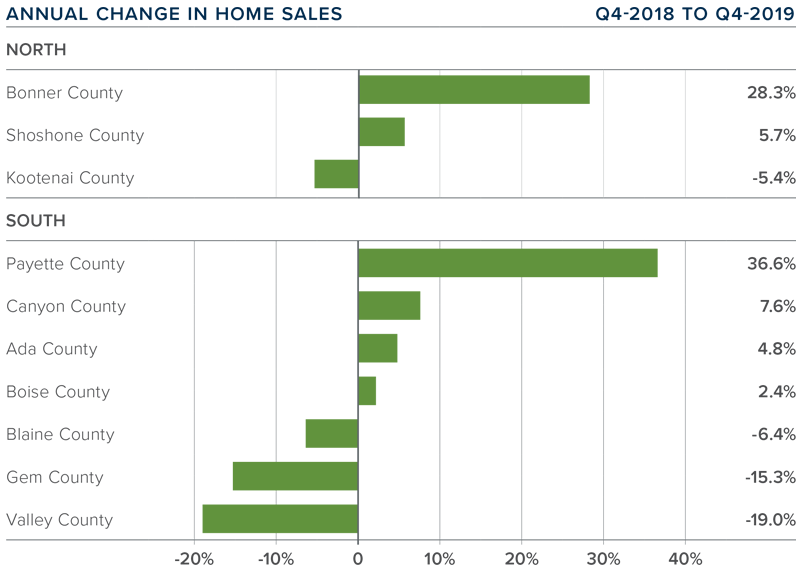
- Fourth quarter home sales rose 6.5% compared to the same period last year, with a total of 15,199 transactions occurring.
- Sales rose fastest in Hood River County, which saw a significant 63% increase compared to the fourth quarter of 2018 (though it should be said that this was an increase in sales of only 29 units). There were also solid increases in Tillamook, Jefferson, and Columbia counties. Five other counties had double-digit increases in sales as well. Home sales fell the most in Wasco County but, as it a relatively small market, I am not overly concerned.
- Year-over-year sales rose in 18 counties and dropped in the other 8 counties contained in this report.
- Sales in the final quarter of 2019 dropped 15% compared to the third quarter of the year, suggesting that closings in the first quarter of 2020 will likely be lower.
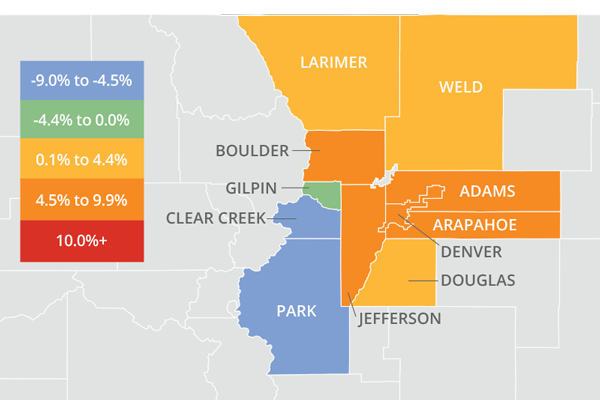
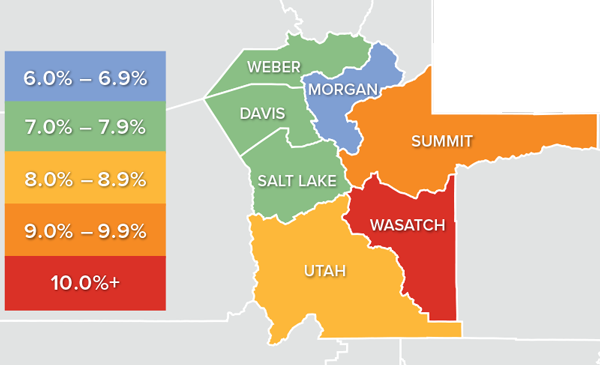
HOME PRICES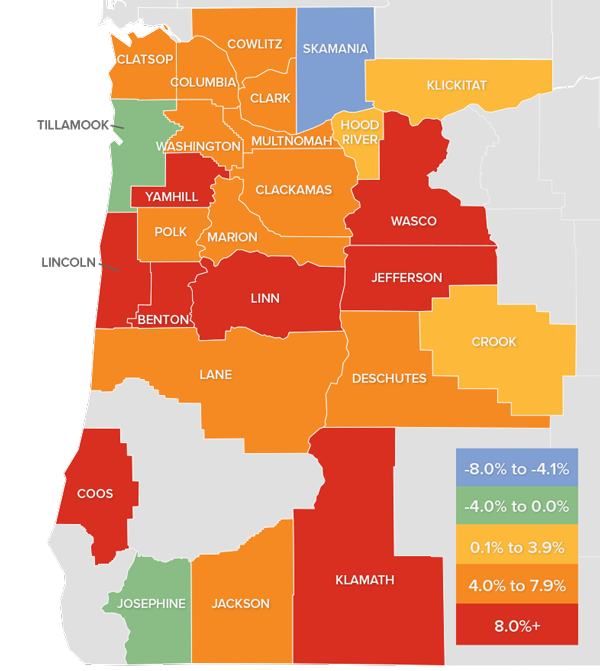
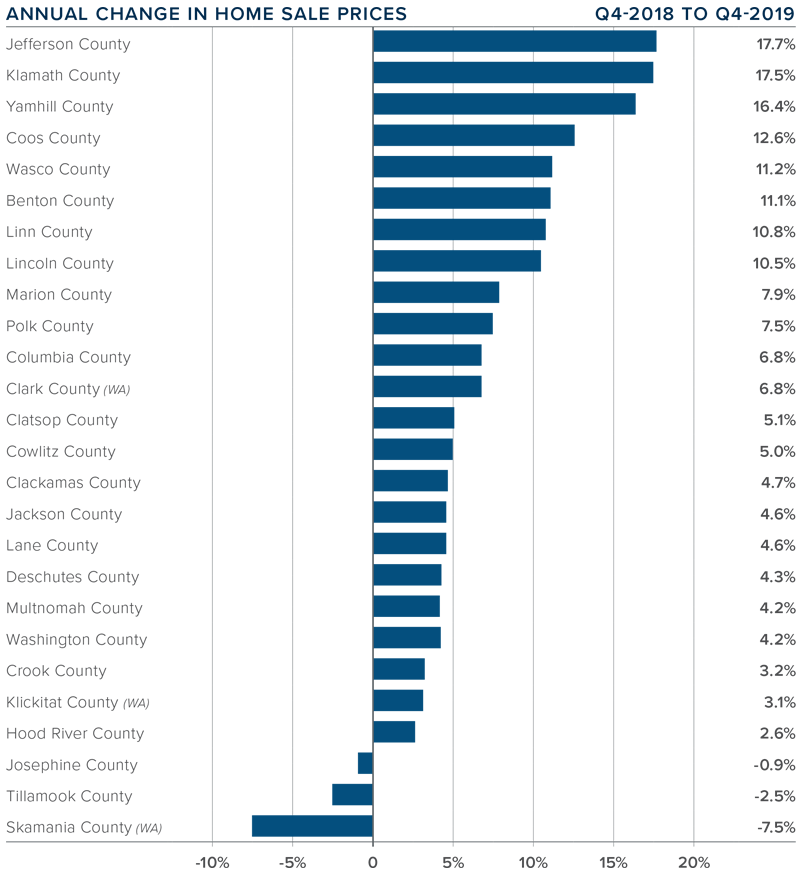
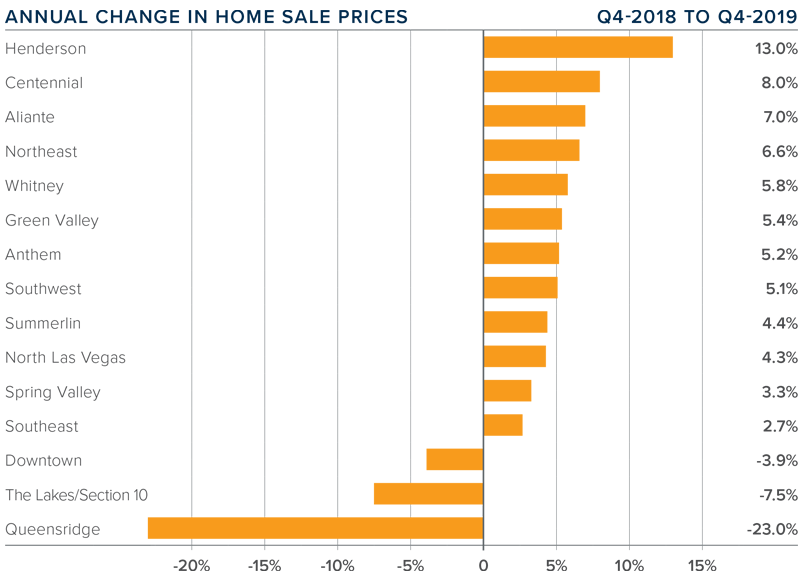
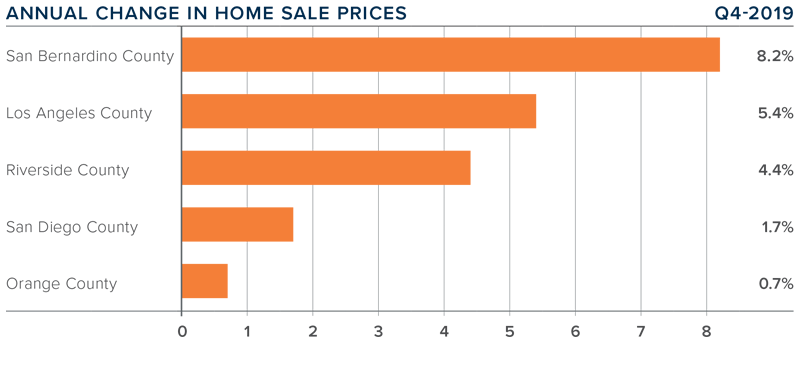
- The average home price in the region rose 6% year-over-year to $400,714, but prices were 0.7% lower than in the third quarter of 2019.
- Jefferson County led the market with the strongest annual price growth. Homes there sold for 17.7% more than a year ago. The greatest drop in sale prices was in small Skamania County. As I have mentioned previously, smaller markets can be prone to significant swings and I am not overly concerned at this time.
- All but three of the counties contained in this report experienced price growth compared to the final quarter of 2018. Although prices continue to appreciate, we are seeing some softening in many markets.
- The takeaway from this section is that price growth continues to moderate. Low mortgage rates will cause prices to continue rising, but more slowly than the past several years.
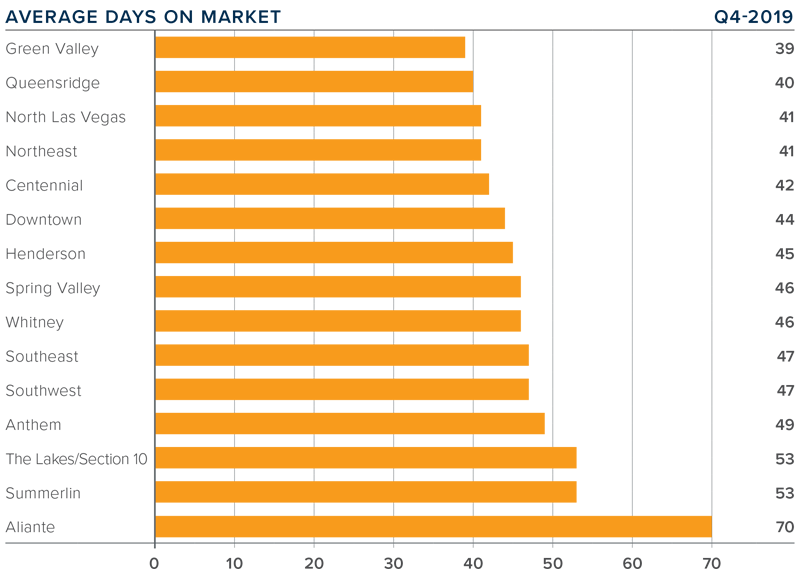
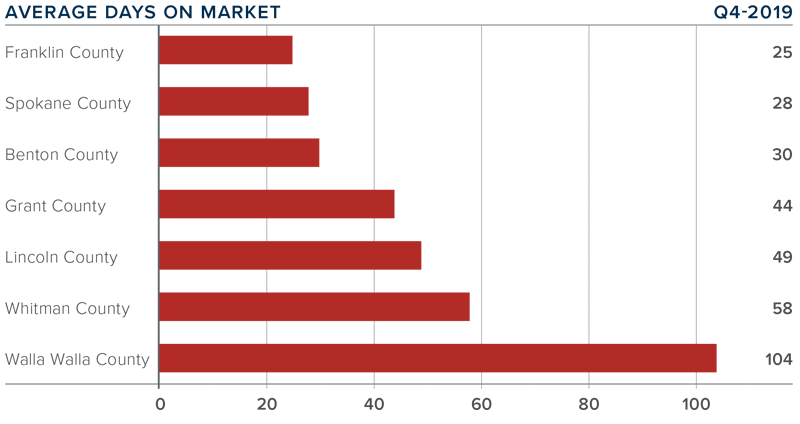
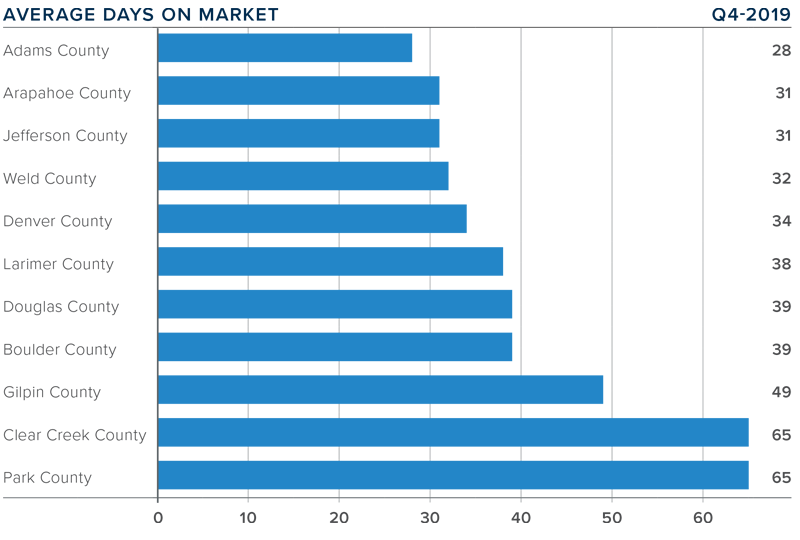
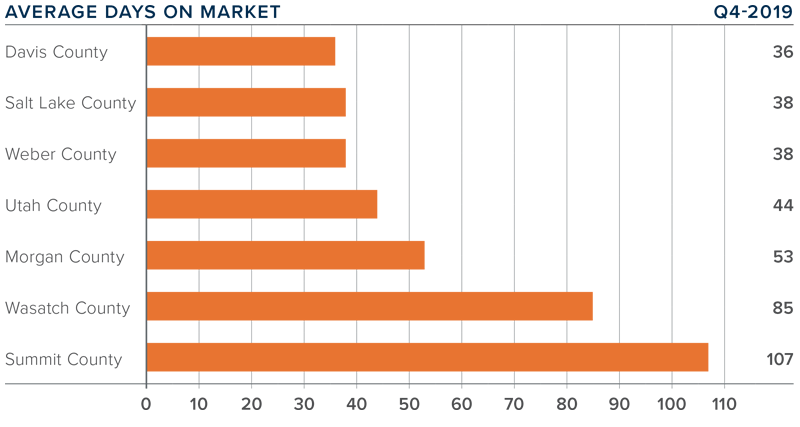
DAYS ON MARKET
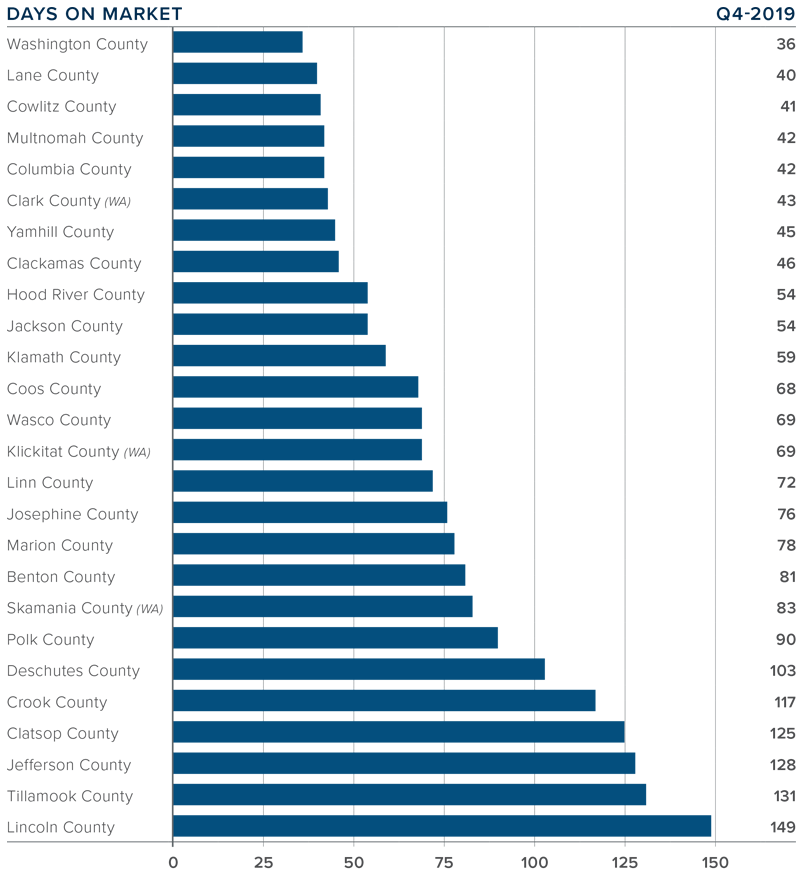
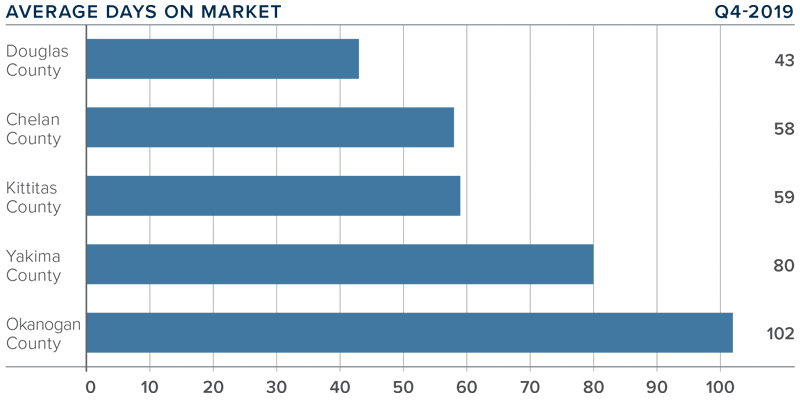
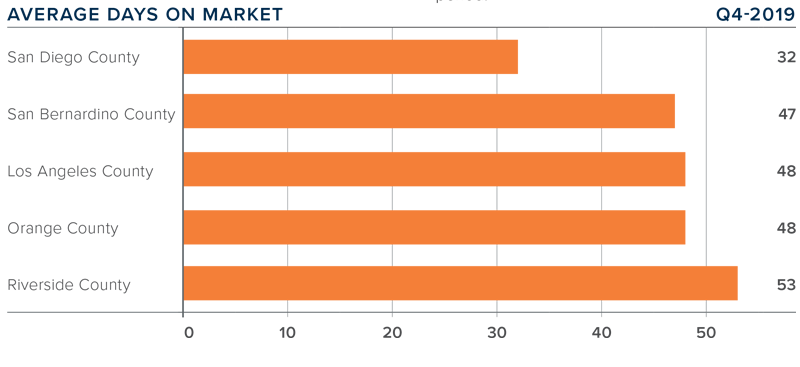
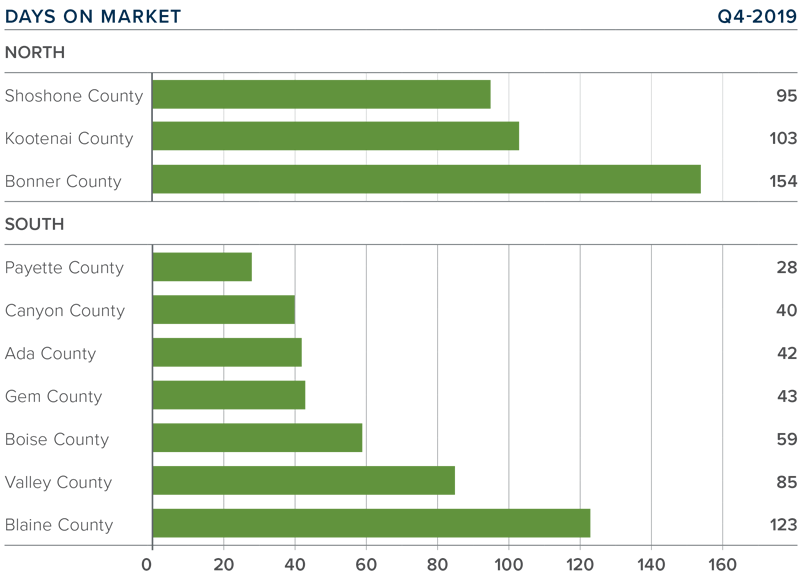
- The average number of days it took to sell a home in the region rose 2 days compared to the fourth quarter of 2018 and was up 13 days compared to the third quarter of 2019.
- The average time it took to sell a home last quarter was 75 days.
- Eleven counties saw the length of time it took to sell a home drop compared to a year ago, 2 remained static, and 13 saw market time rise.
- Homes sold fastest in Washington (36 days) and Lane (40 days) counties.
CONCLUSIONS
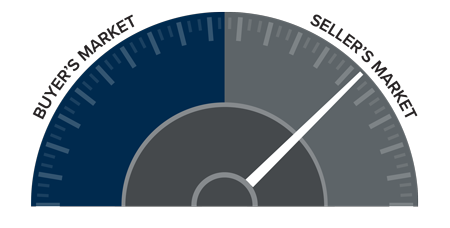
 The speedometer reflects the state of the region’s real estate market using housing inventory, price gains, home sales, interest rates, and larger economic factors.
Home sales rose in the quarter, which is certainly a good sign that there is still significant demand for housing in the region. Inventory levels are still a concern and remain lower than I would like to see. Given economic vitality in the state, as well as low mortgage rates, I expect to see more home buyers start their search for a new home as we move into the new year.
Because of these factors, I have moved the needle a little more in favor of home sellers.
ABOUT MATTHEW GARDNER
 As Chief Economist for Windermere Real Estate, Matthew Gardner is responsible for analyzing and interpreting economic data and its impact on the real estate market on both a local and national level. Matthew has over 30 years of professional experience both in the U.S. and U.K.
In addition to his day-to-day responsibilities, Matthew sits on the Washington State Governors Council of Economic Advisors; chairs the Board of Trustees at the Washington Center for Real Estate Research at the University of Washington; and is an Advisory Board Member at the Runstad Center for Real Estate Studies at the University of Washington where he also lectures in real estate economics.

 Year-over-year, the average home price in the region rose 7.7% to $352,643. Price growth continues to trend well above the long-term average, with limited inventory pushing prices higher.
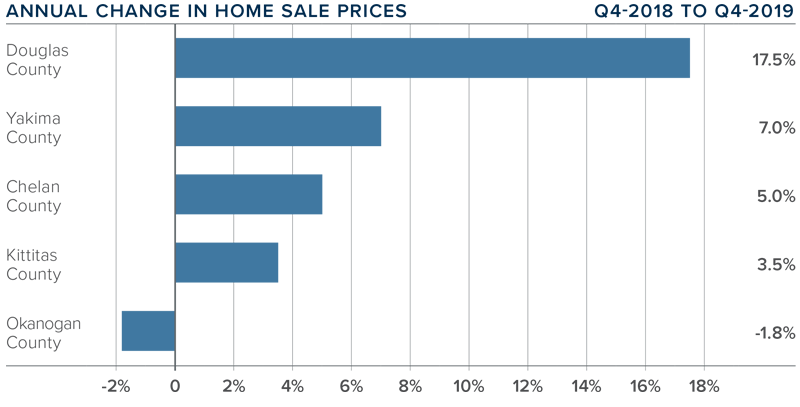
 This speedometer reflects the state of the region’s real estate market using housing inventory, price gains, home sales, interest rates, and larger economic factors.


 Image Source:
 The speedometer reflects the state of the region’s real estate market using housing inventory, price gains, home sales, interest rates, and larger economic factors.

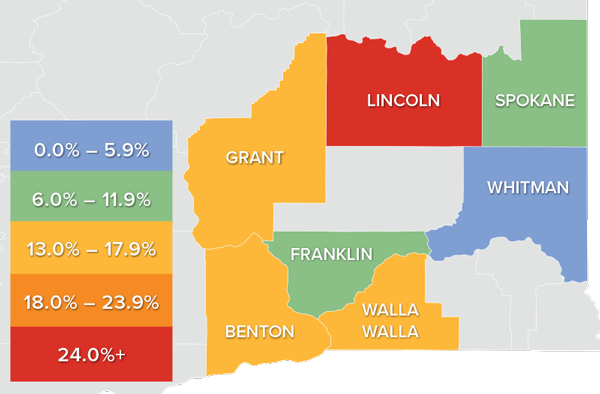 Year-over-year, the average home price in Eastern Washington rose by a significant 12.3% to $297,048. That said, prices were 2.2% lower than in the third quarter.
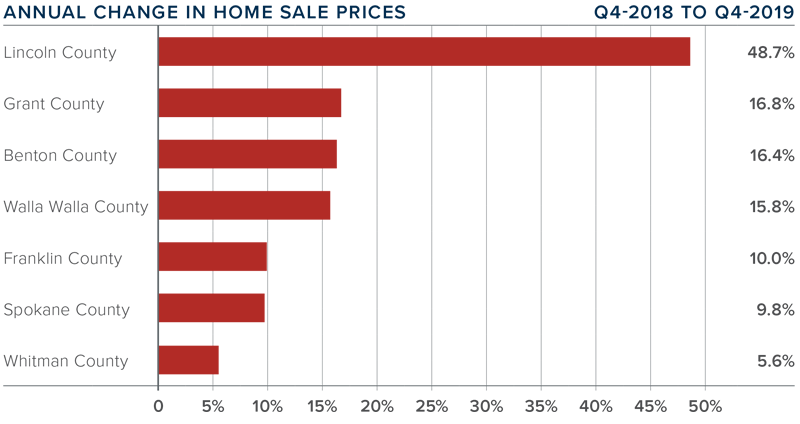
 This speedometer reflects the state of the region’s real estate market using housing inventory, price gains, home sales, interest rates, and larger economic factors.


 Home prices continue to trend higher, with the average home price in the region rising 4.3% year-over-year to $473,264.
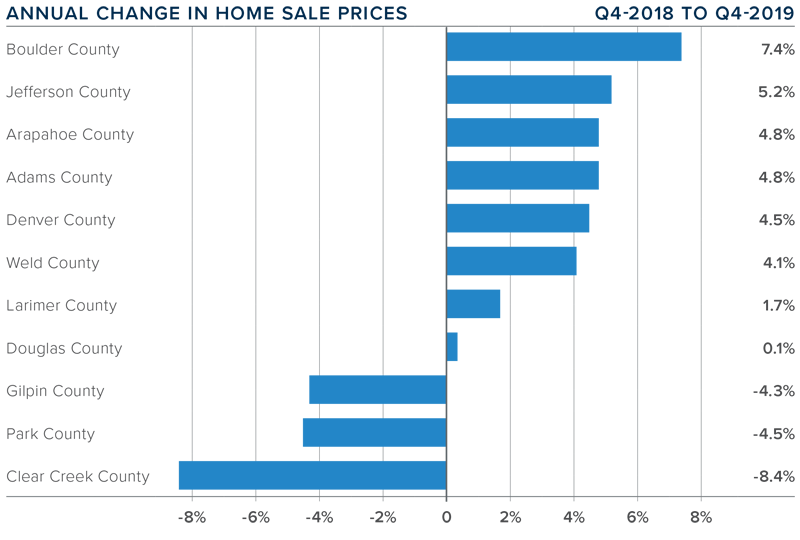
 This speedometer reflects the state of the region’s real estate market using housing inventory, price gains, home sales, interest rates, and larger economic factors.
 As Chief Economist for Windermere Real Estate, Matthew Gardner is responsible for analyzing and interpreting economic data and its impact on the real estate market on both a local and national level. Matthew has over 30 years of professional experience both in the U.S. and U.K.
 The average home price in the region continued to rise in the fourth quarter, with a year-over-year increase of 9.5% to an average of $403,186. Home prices were 0.4% higher than in the third quarter of 2019.
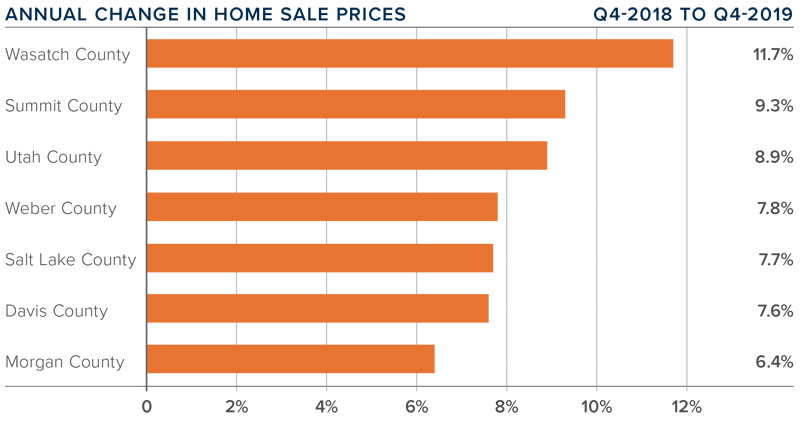
 This speedometer reflects the state of the region’s real estate market using housing inventory, price gains, home sales, interest rates, and larger economic factors.

 The speedometer reflects the state of the region’s real estate market using housing inventory, price gains, home sales, interest rates, and larger economic factors. Inventory levels and affordability concerns persist, but there still appears to be demand from home buyers. Pending sales have risen, which suggests the market still has legs to grow, thanks in no small part to competitive mortgage rates. Given the tight inventory levels and decent demand, I have moved the needle a little more toward sellers.
 The average home price in the region rose 11.7% year-over-year to $377,011 and sale prices were 2.5% higher than in the third quarter of 2019.
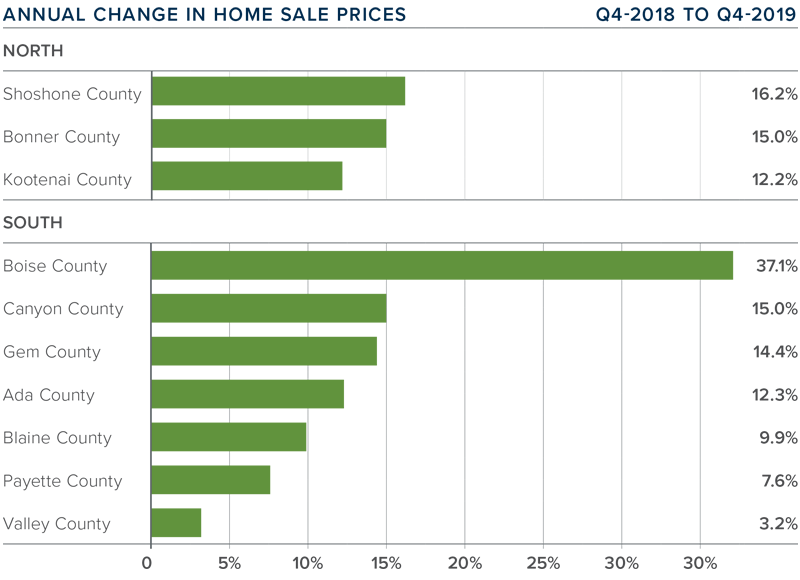
 The speedometer reflects the state of the region’s housing market using housing inventory, price gains, home sales, interest rates, and larger economic factors.
")


