
 Facebook
 X
X
 Pinterest
 Copy Link

The following analysis of select Maui real estate markets is provided by Windermere Real Estate Chief Economist Matthew Gardner. We hope that this information may assist you with making better-informed real estate decisions. For further information about the housing market in your area, please don’t hesitate to contact your Windermere agent.
ECONOMIC OVERVIEW
The State of Hawaii saw employment grow at an annual rate of 1.1%, with 6,000 jobs added over the past 12 months. In September, the state’s unemployment rate was 2.7%, marginally higher than the 2.6% rate of a year ago.
On the island of Maui, employment continues to contract, with a year-over-year drop of 2.8%. I would note that employment growth has been negative for the past 21 months. Even given the lack of new jobs, the island’s unemployment rate was still impressive, coming in at 2.5%, up from 2.4% a year ago.
HOME SALES
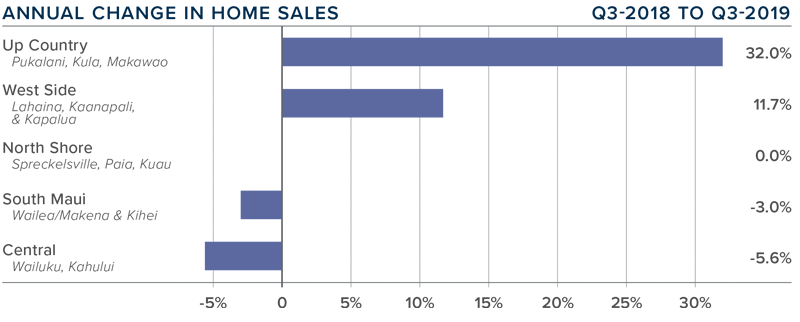
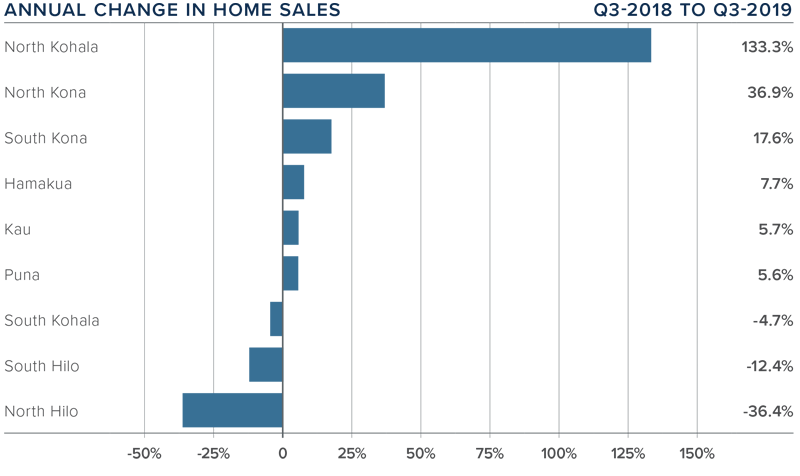
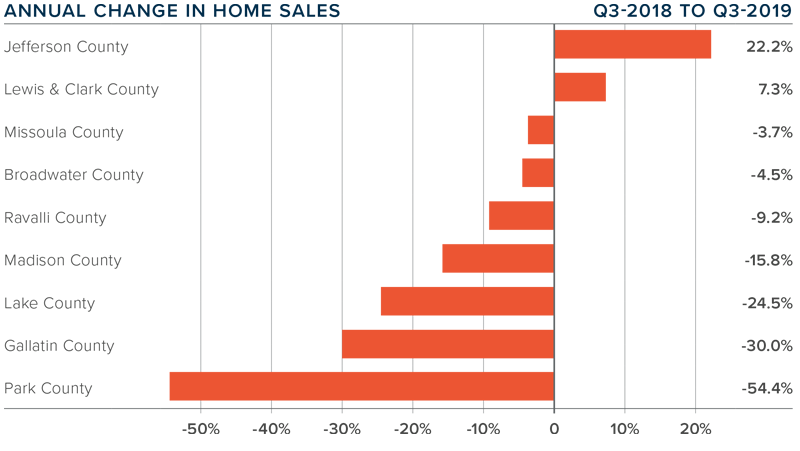
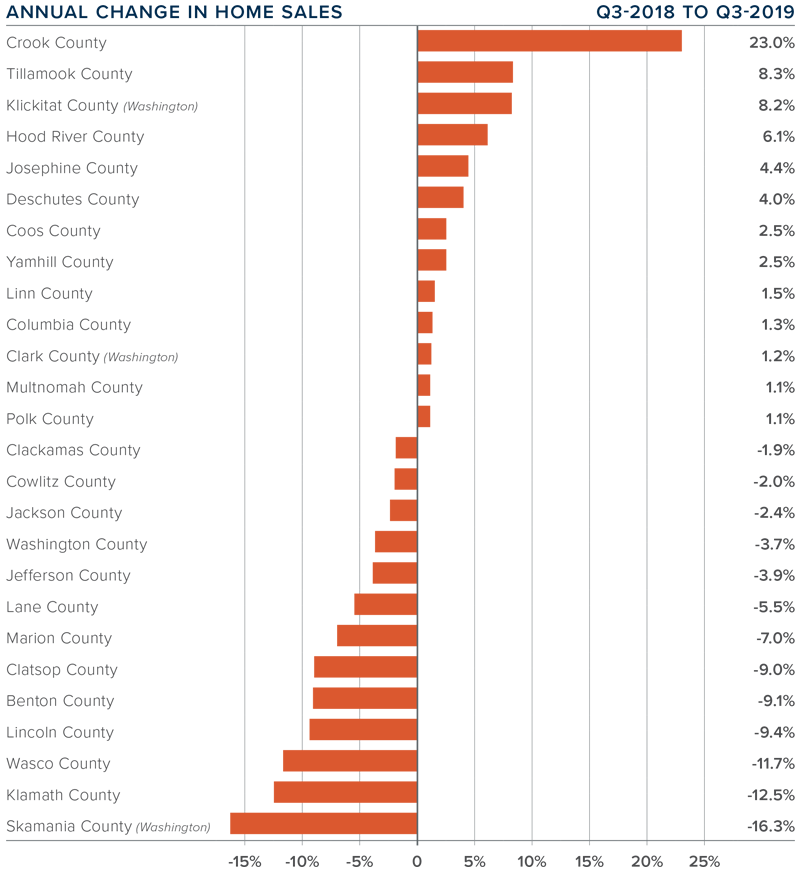
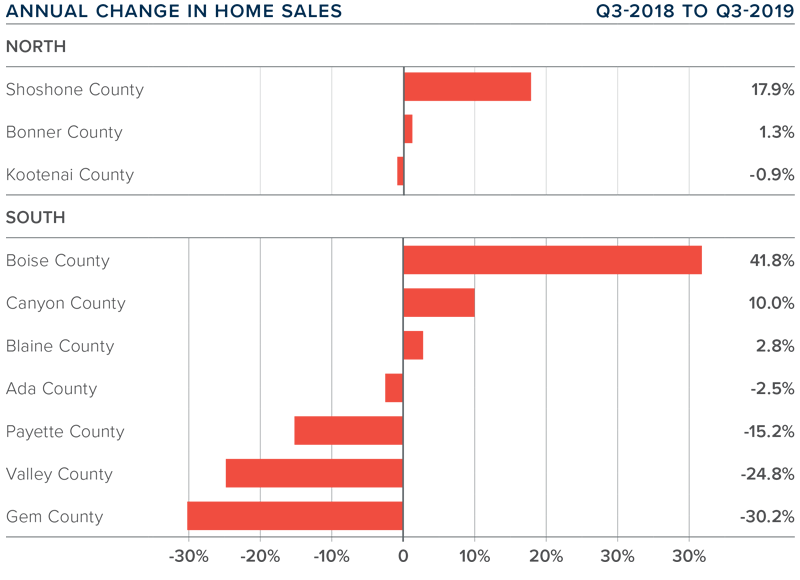
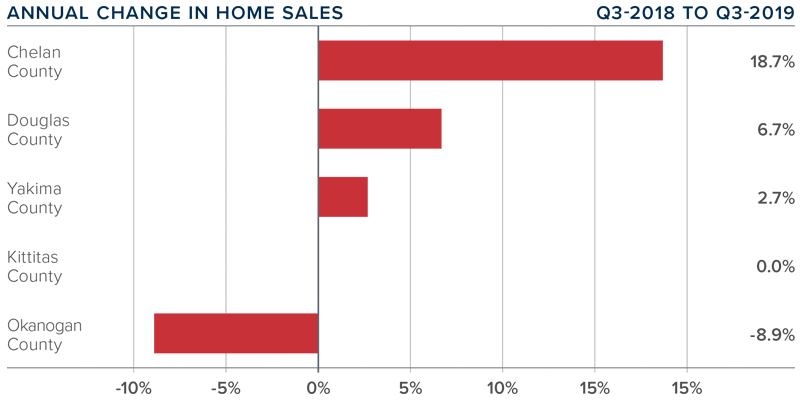
- In the third quarter of 2019, 578 homes sold, an increase of 2.1% compared to the third quarter of 2018. Sales were up 0.9% compared to the second quarter of this year.
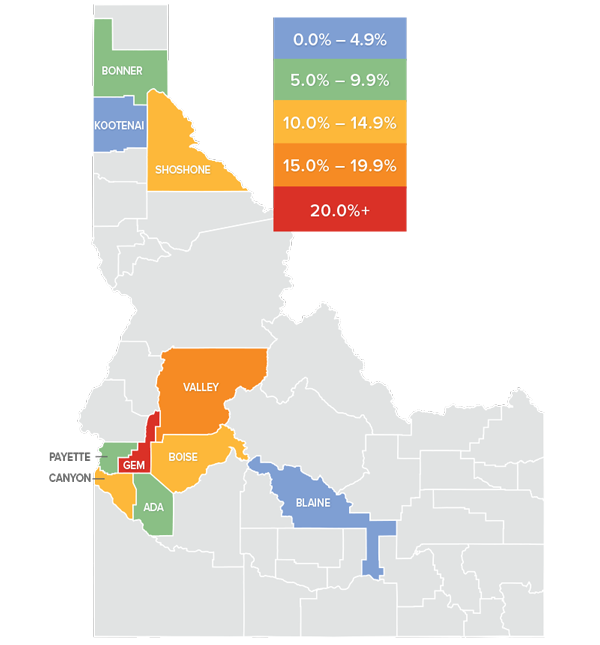
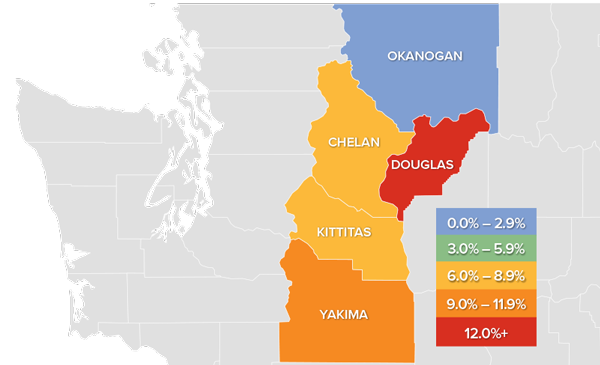
- Not all markets saw a drop in sales. There were notable increases in the Up Country and Westside markets compared to the third quarter of 2018.
- The rise in sales came as inventory levels dropped 13.7%.
- Pending home sales were down 5% from the second quarter of 2019, suggesting that fourth-quarter closings may disappoint.
HOME PRICES
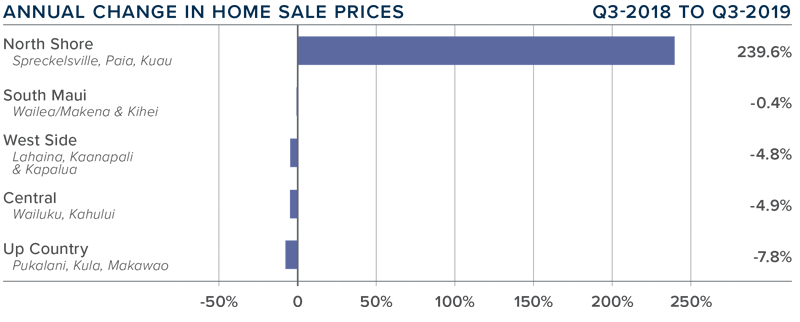
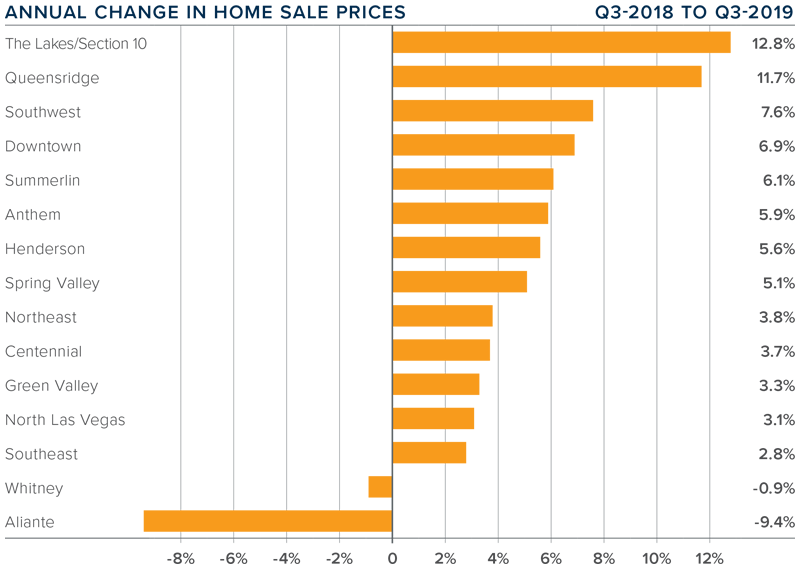
 The average home price in the region dropped 0.4% from last year to $889,694 but was up 0.7% compared to the second quarter of this year.
- Affordability remains a significant issue. As I discussed in the second quarter Gardner Report, the significant drop in interest rates this year has failed to stimulate sales, which is now affecting home prices.
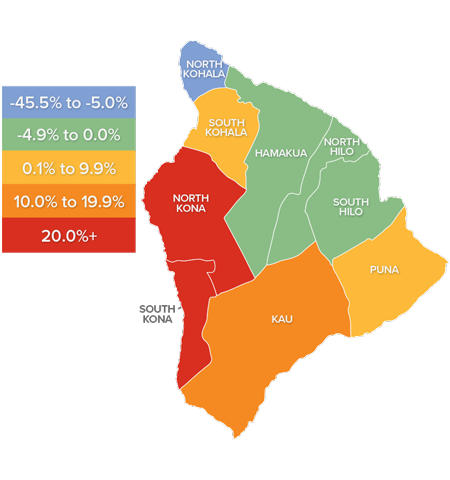
- Price changes by market were interesting: all but one market saw modest declines, but there was a massive 240% increase in the North Shore market. This increase was due to home sales in September when prices averaged $3.53 million. This is not necessarily uncommon in very small markets, where a few high-priced sales can create very significant swings in the average.
- I don’t expect to see a turnaround through the balance of the year but do expect there to be modest price growth in 2020.
DAYS ON MARKET
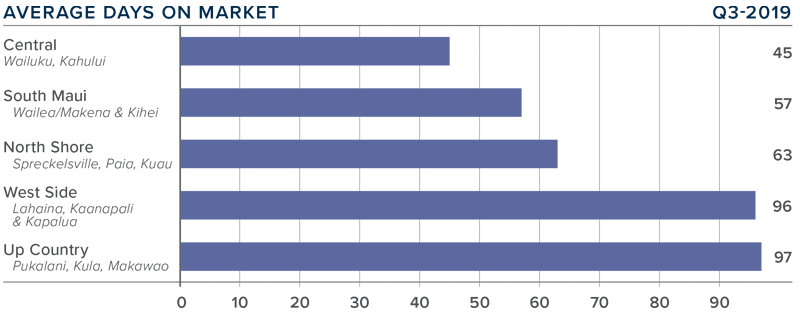
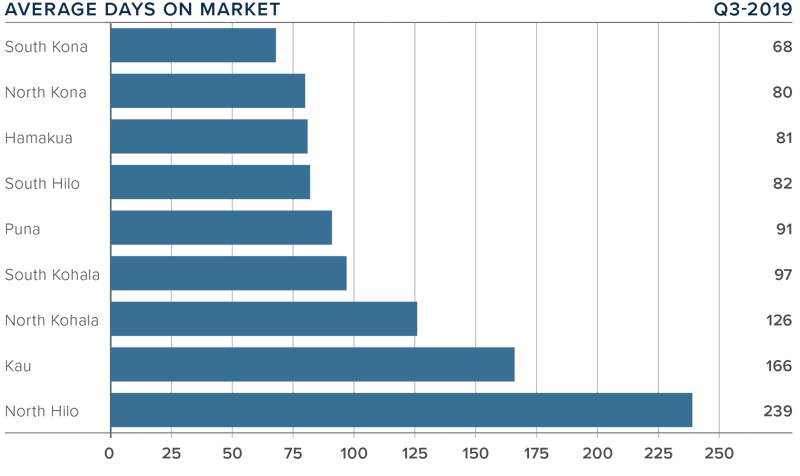
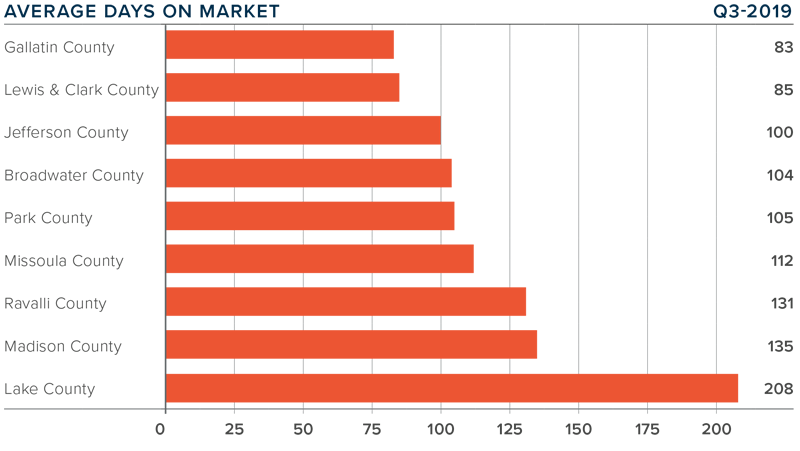
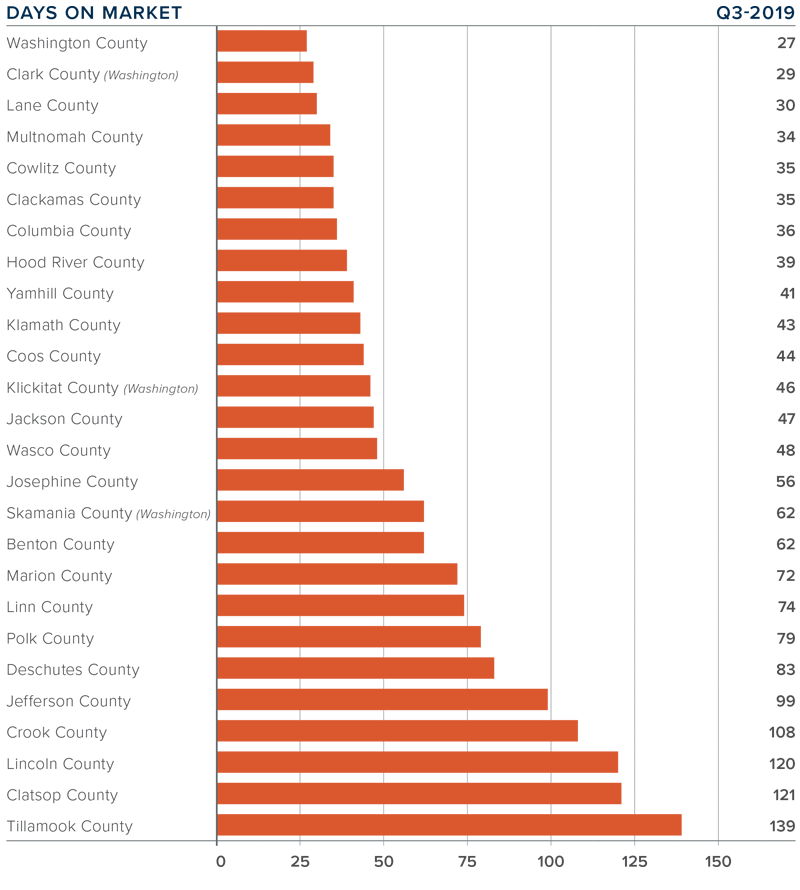
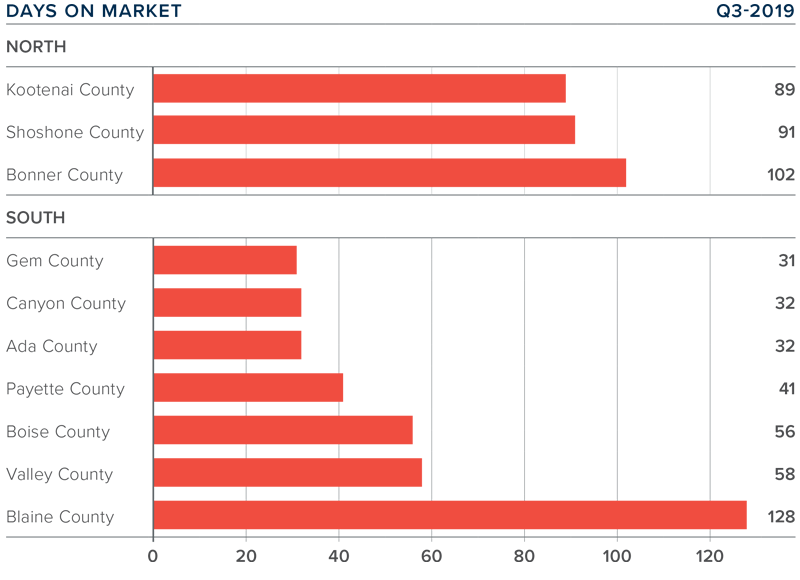
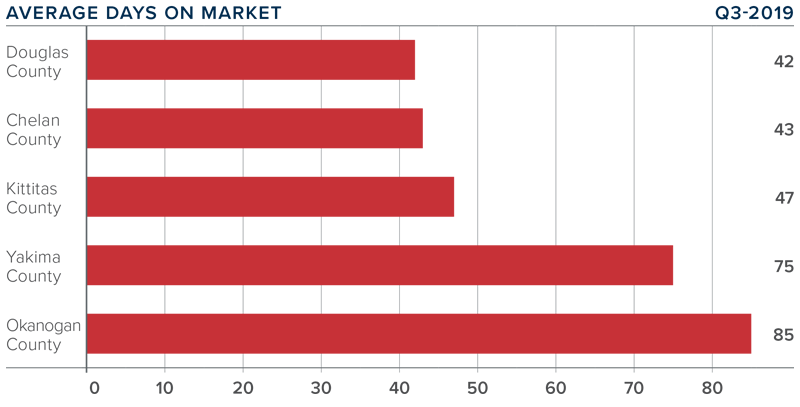
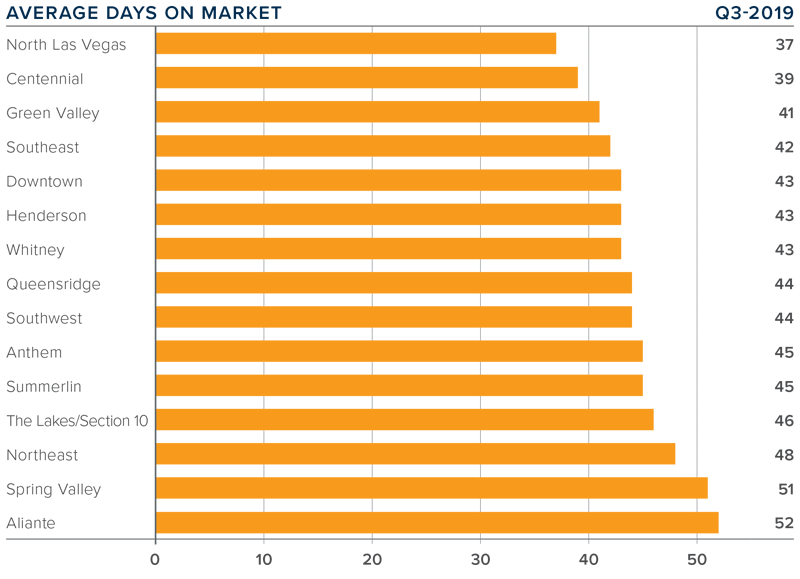
- The average number of days it took to sell a home on Maui dropped nine days compared to the third quarter of 2018.
- The amount of time it took to sell a home dropped in all markets other than the North Shore market area.
- In the third quarter, it took an average of 71 days to sell a home. Homes in the Central market sold at the fastest pace. It is taking the longest time to sell in the Up Country market.
- The length of time it takes to sell homes on Maui will likely trend slightly lower for the balance of the year.
CONCLUSIONS
 This speedometer reflects the state of the region’s real estate market using housing inventory, price gains, home sales, interest rates, and larger economic factors.
For the third quarter of 2019, I have moved the needle a little more in favor of home sellers. Inventory remains tight and, although we have seen a modest drop in home prices, well-priced and well-positioned homes are still selling relatively quickly.
ABOUT MATTHEW GARDNER
 As Chief Economist for Windermere Real Estate, Matthew Gardner is responsible for analyzing and interpreting economic data and its impact on the real estate market on both a local and national level. Matthew has over 30 years of professional experience both in the U.S. and U.K.
In addition to his day-to-day responsibilities, Matthew sits on the Washington State Governors Council of Economic Advisors; chairs the Board of Trustees at the Washington Center for Real Estate Research at the University of Washington; and is an Advisory Board Member at the Runstad Center for Real Estate Studies at the University of Washington where he also lectures in real estate economics.

 The average home price in the region rose 16.7% year-over-year to $584,756. Prices also rose between the second and third quarters of this year by 11.3%.
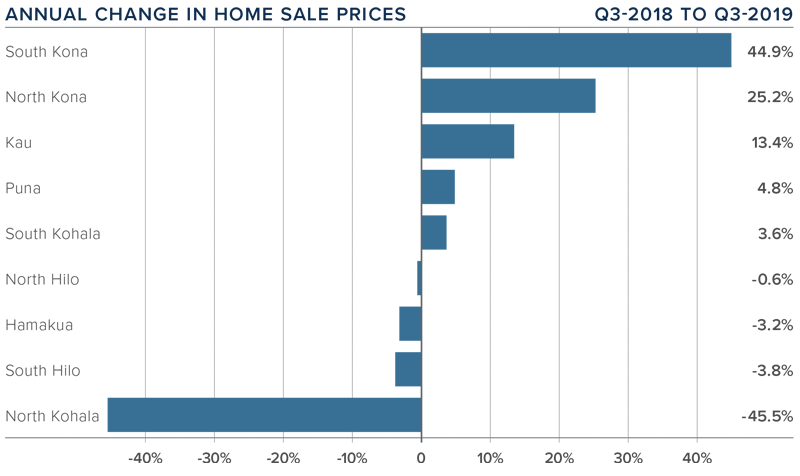
 This speedometer reflects the state of the region’s real estate market using housing inventory, price gains, home sales, interest rates, and larger economic factors.
 As Chief Economist for Windermere Real Estate, Matthew Gardner is responsible for analyzing and interpreting economic data and its impact on the real estate market on both a local and national level. Matthew has over 30 years of professional experience both in the U.S. and U.K.
 Following the significant 25.2% annual increase in home prices in the second quarter, the third-quarter figures were not as impressive. Year-over-year prices dropped 7.1% to an average of $373,133.
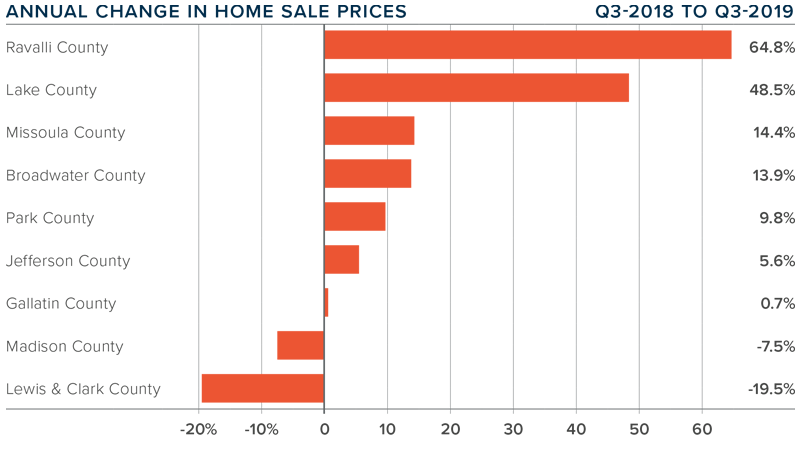
 This speedometer reflects the state of the region’s real estate market using housing inventory, price gains, home sales, interest rates, and larger economic factors.

 The average home price in the region rose 3.5% year-over-year to $403,584. Sale prices were 0.6% higher compared to the second quarter of this year.
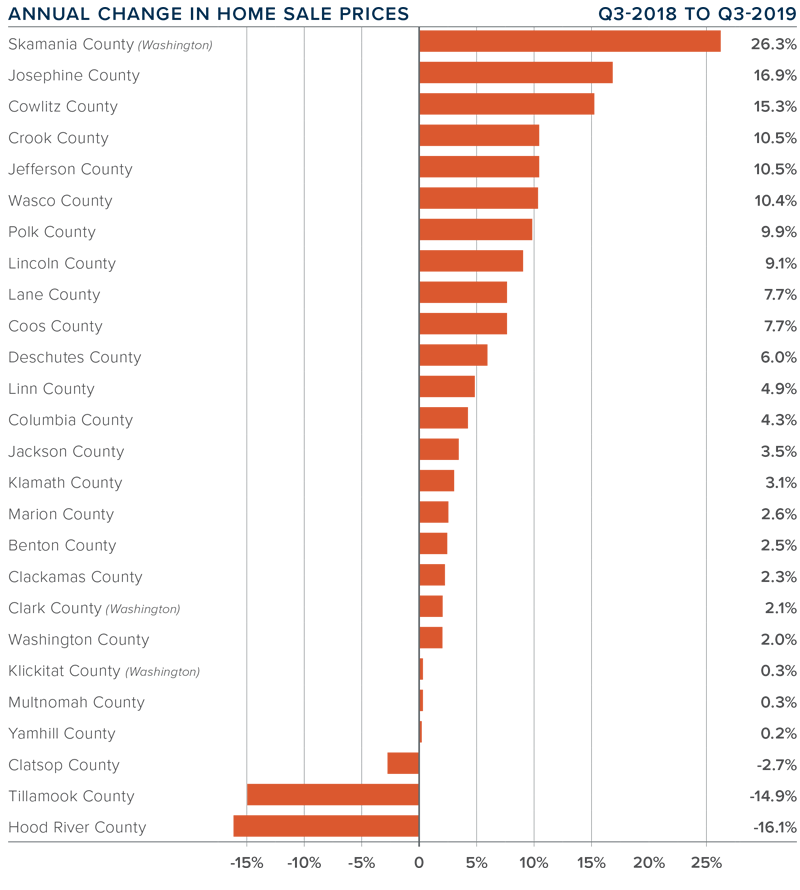
 The speedometer reflects the state of the region’s real estate market using housing inventory, price gains, home sales, interest rates, and larger economic factors.

 The average home price in the region rose 8% year-over-year to $367,963. Prices were 2.7% higher than in the second quarter of this year.
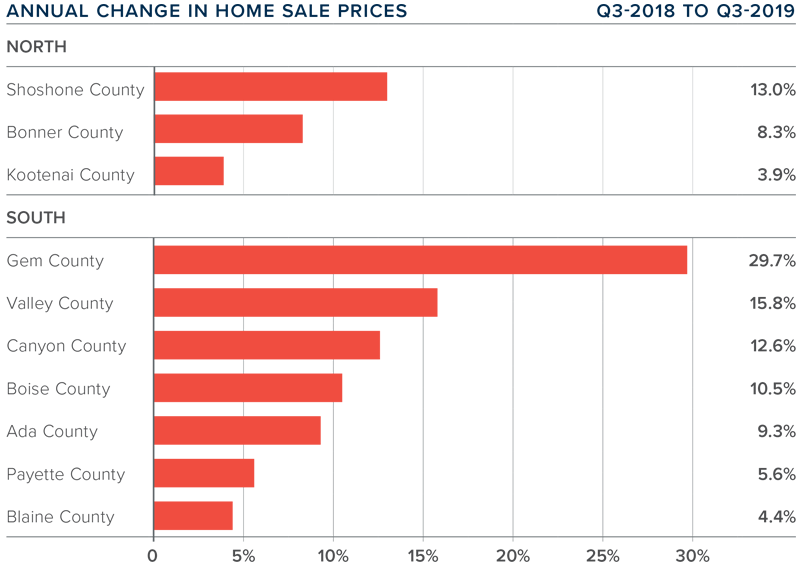
 The speedometer reflects the state of the region’s housing market using housing inventory, price gains, home sales, interest rates, and larger economic factors.
 Year-over-year, the average home price in the region rose 10.4% to $360,903. Price growth continues to trend well above the long-term average, with limited inventory pushing prices higher.
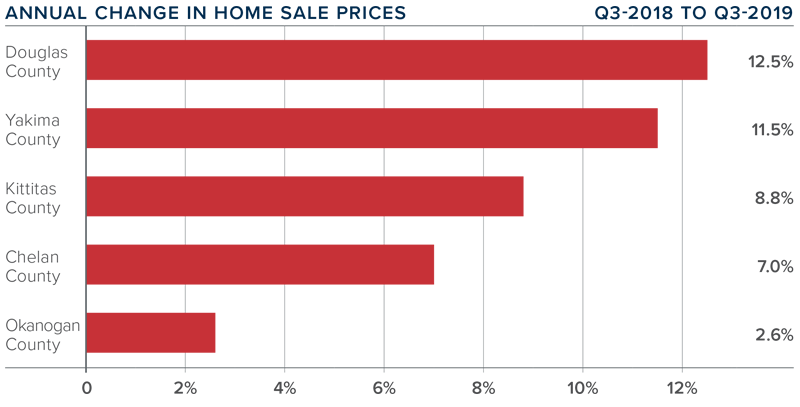
 This speedometer reflects the state of the region’s real estate market using housing inventory, price gains, home sales, interest rates, and larger economic factors.
 As Chief Economist for Windermere Real Estate, Matthew Gardner is responsible for analyzing and interpreting economic data and its impact on the real estate market on both a local and national level. Matthew has over 30 years of professional experience both in the U.S. and U.K.
 Job growth in the Las Vegas metropolitan area has been softening lately, but the area still added 17,900 new jobs over the past 12 months. This represents an annual growth rate of 1.8%, which is the lowest annual growth rate since the summer of 2012. Employment growth is still above the national average (1.4%) but slowing job growth came as a bit of a surprise. I will be watching to see if this is a pervasive trend or just a temporary blip.
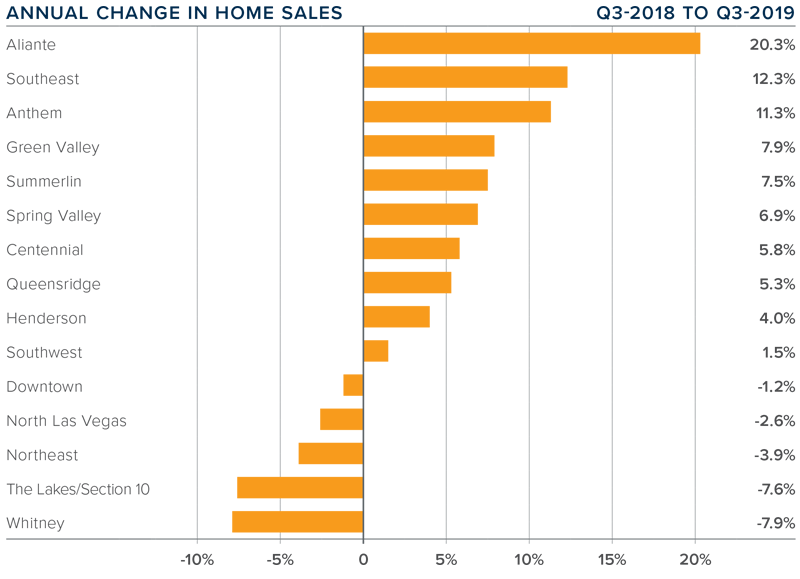
 The speedometer reflects the state of the region’s real estate market using housing inventory, price gains, home sales, interest rates, and larger economic factors.


")


