
 Facebook
 X
X
 Pinterest
 Copy Link

ECONOMIC OVERVIEW
Colorado added 62,000 new jobs over the past 12 months, an increase of 2.4% over this time last year. All of the metropolitan markets included in this report saw annual employment growth, with substantial growth in Boulder (4.7%) and Fort Collins (+4.1%), and more modest growth in Grand Junction (0.3%). In May, the unemployment rate in the state was 2.3%, matching the prior month and down 3.4% from a year ago. The lowest unemployment rate was in Fort Collins at just 2.0%. The highest rate was in Grand Junction, though it was still a relatively low 3.3%. It is reasonable to expect these markets will see above-average wage growth given the tight labor market.
HOME SALES ACTIVITY
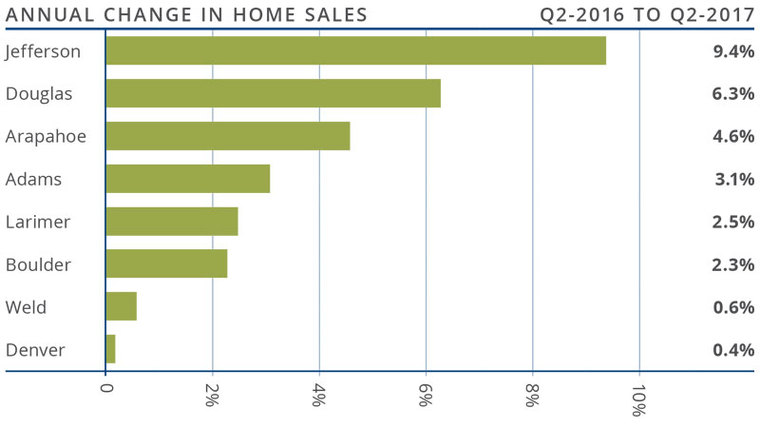
- There were 17,581 home sales during the first quarter of 2017, a solid annual increase of 3.9% over the first quarter of 2016.
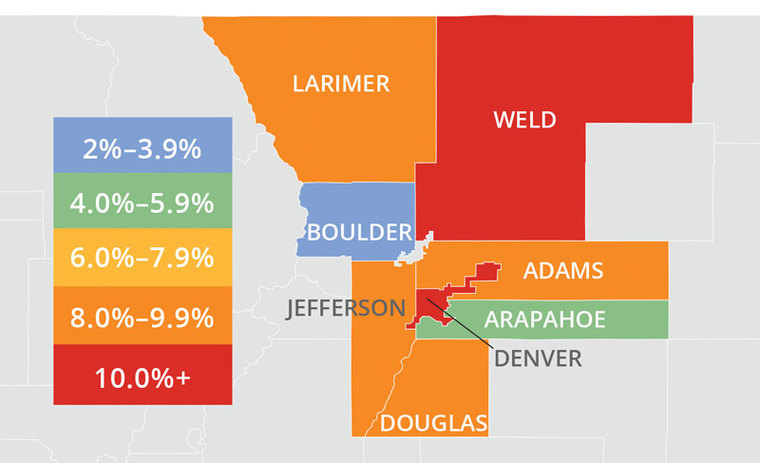
- Jefferson County saw sales grow at the fastest rate over the past 12 months, with a 9.4% increase. There was also an impressive increase in Douglas County (+6.3%). More modest sales growth was seen in Denver and Weld Counties.
- Even with the rise in sales, listing activity is still running at well below historic averages, with the total number of homes for sale in the second quarter 7.6% below a year ago.
- Sales growth continues to trend higher, but inventory levels remain well below where they need to be to satisfy demand.
HOME PRICES
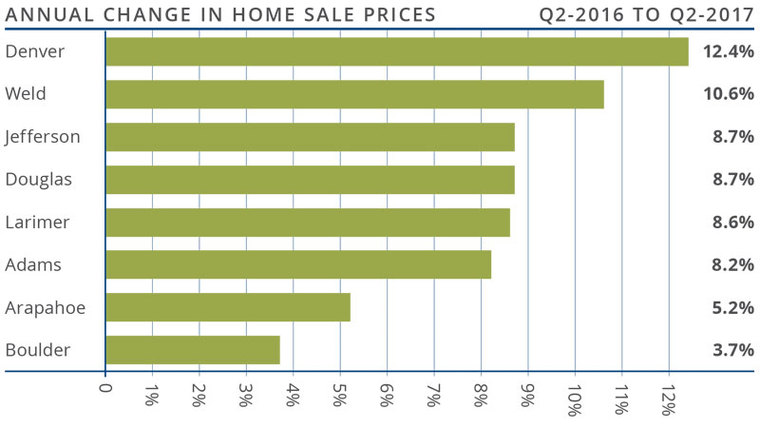
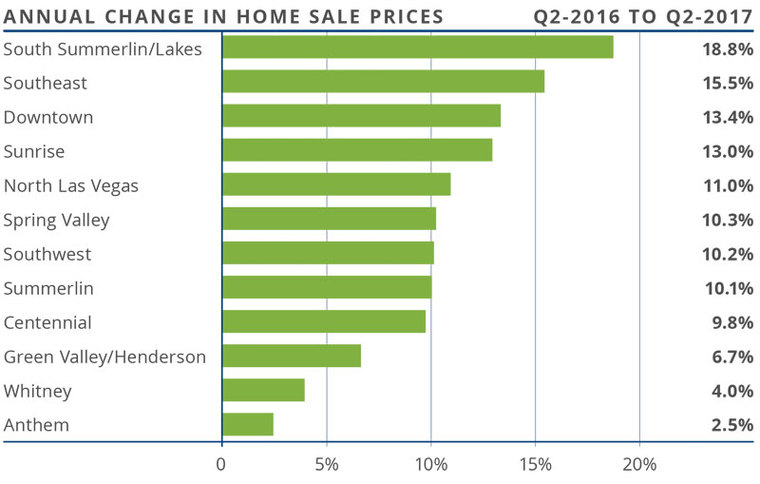
 Due to solid demand, home prices continue to rise with average prices up by 8.5% year-over-year to an average across the region of $438,980.
- Boulder County saw slower appreciation in home values, but the trend is still positive.
- Appreciation was strongest in Denver and Weld Counties, where prices rose by 12.4% and 10.6% respectively.
- Economic growth is driving job growth, which is driving housing demand. Given the relative shortage of homes for sale, expect to see home prices continue to appreciate at above-average rates at least through the rest of the year.
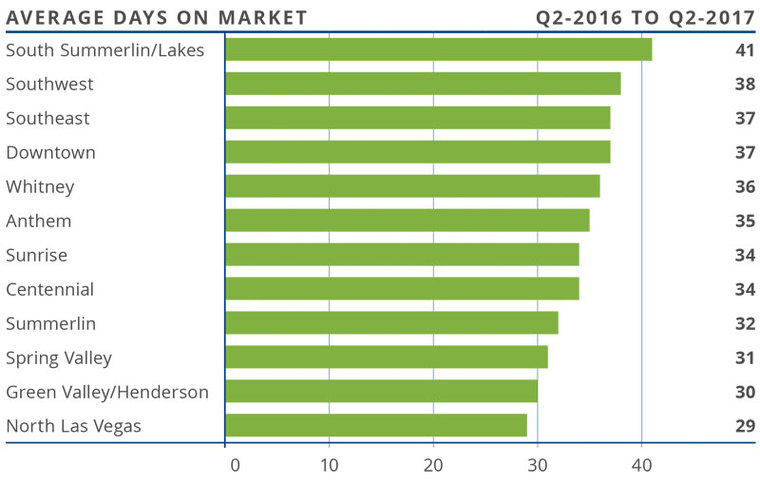
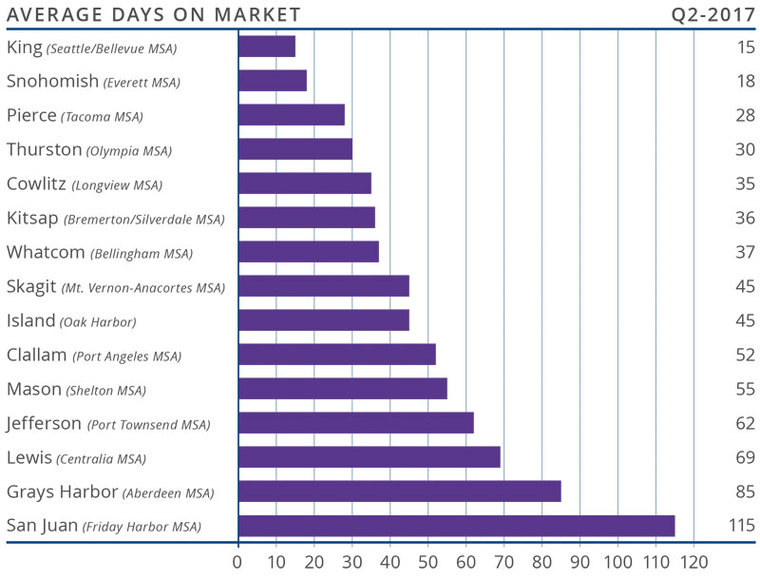
DAYS ON MARKET
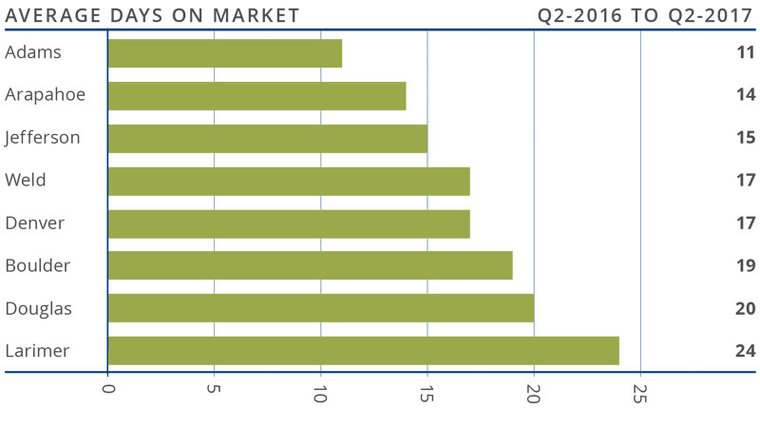
- The average number of days it took to sell a home dropped by three days when compared to the second quarter of 2016.
- Homes in all counties contained in this report took less than a month to sell. Adams County stood out as it took an average of only 11 days to sell a home.
- During the second quarter, it took an average of just 17 days to sell a home. This is down by a substantial 13 days compared to the first quarter of this year.
- The takeaway here is that demand remains robust as evidenced by the remarkably short amount of time that it is taking to sell a home.
CONCLUSIONS
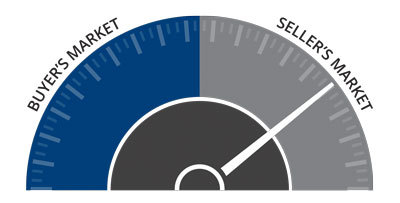
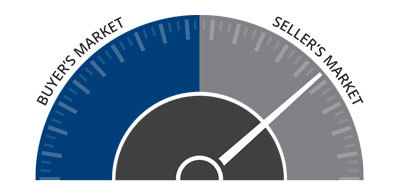
 This speedometer reflects the state of the region’s housing market using housing inventory, price gains, home sales, interest rates, and larger economic factors.
After the second quarter of 2017, I have moved the needle even farther in favor of sellers. Mortgage rates remain very competitive and, with the specter of lending standards easing a little, demand will remain robust, which will be reflected in rising home values.
 Matthew Gardner is the Chief Economist for Windermere Real Estate, specializing in residential market analysis, commercial/industrial market analysis, financial analysis, and land use and regional economics. He is the former Principal of Gardner Economics, and has over 25 years of professional experience both in the U.S. and U.K.
If you are in the market to buy or sell, we can connect you with an experienced agent here.

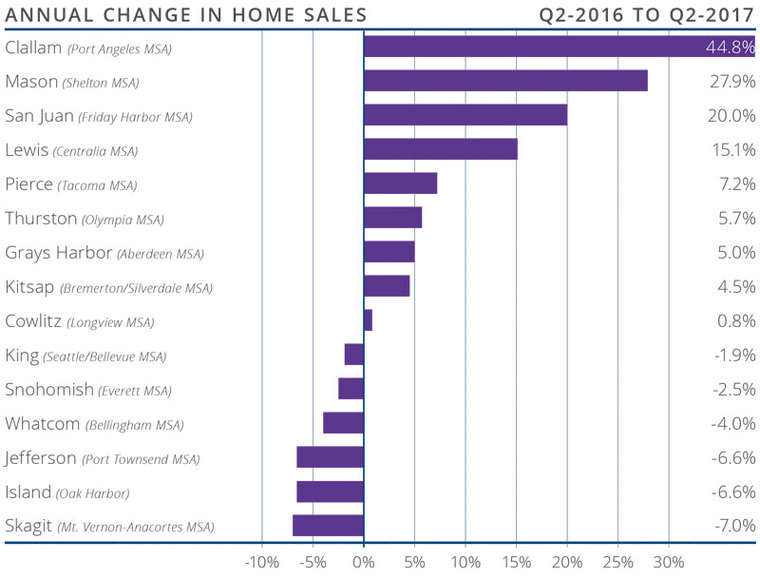
 There were 54,516 home sales in the second quarter of this year. This was only 1.8% higher than the same period in 2016, but 34.4% above the level seen in the first quarter of this year.
 The speedometer reflects the state of the region’s housing market using housing inventory, price gains, home sales, interest rates, and larger economic factors.
 Employment growth in the Las Vegas metropolitan area slowed down—albeit very modestly—as the market entered the summer, with an annual employment growth of 2.9%. That said, the market has added 27,300 new jobs over the past 12 months. With this growth in employment, the unemployment rate remained at 4.8%, which is marginally above the statewide level of 4.7%. Las Vegas continues to approach full employment but the market, like many others across the country, has yet to see robust wage growth. However, I do believe wages will start to rise as the labor market continues to tighten through the rest of the year.
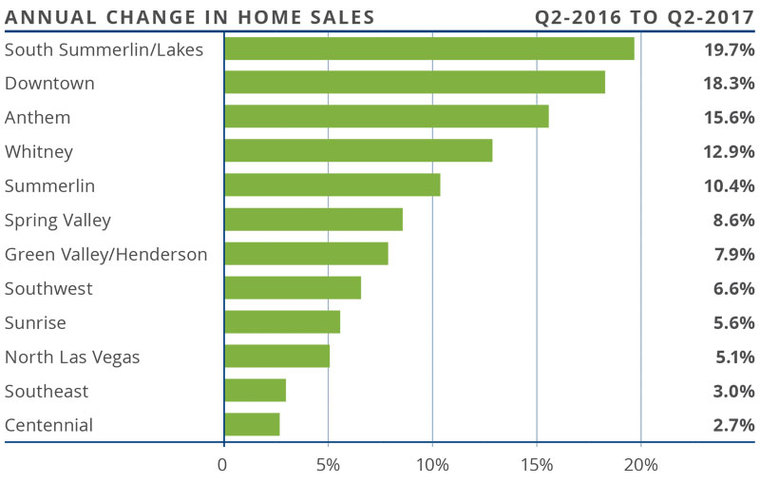
 The speedometer reflects the state of the region’s housing market using housing inventory, price gains, home sales, interest rates, and larger economic factors.
 Along with the expanding economy, home prices continue to rise at very robust rates. Year-over-year, average prices rose 14.9%. The region’s average sales price is now $470,187.
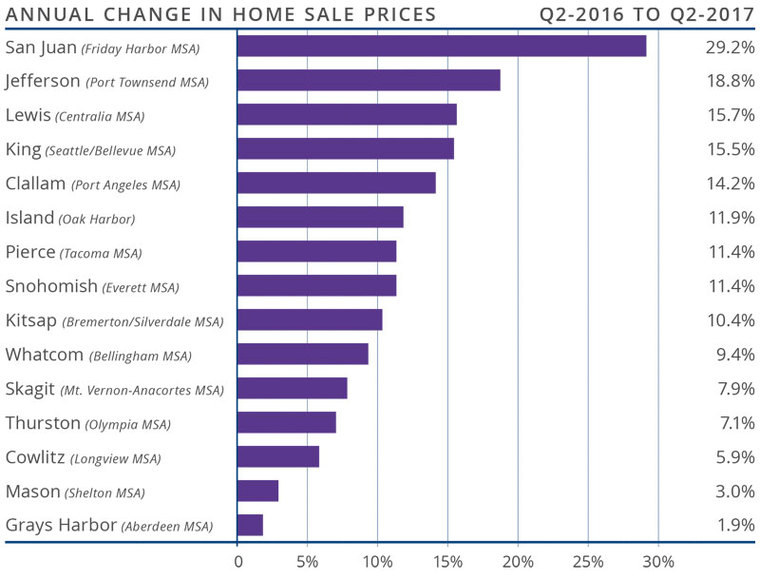
 This speedometer reflects the state of the region’s housing market using housing inventory, price gains, home sales, interest rates, and larger economic factors. For the second quarter of 2017, I moved the needle a little more in favor of sellers. To define the Western Washington market as “tight” is somewhat of an understatement.


")


